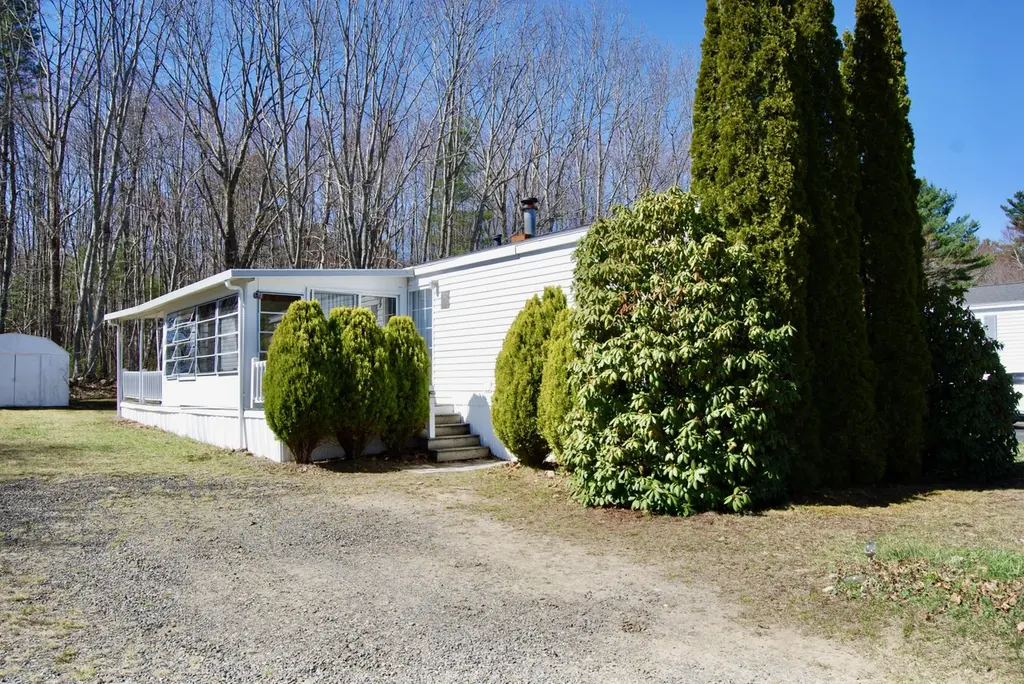
68 Poplar Park Dr · Kennebunk, ME
Flood risk 1/10 · Minimal
- FEMA flood zone
- X
- Chance of flooding over 30 yrs
- 0.0%
- Est. flood insurance / yr
- $507 – $1,088
Fire risk 1/10 · Minimal
- Est. fire insurance / yr
- $669 – $1,243
Heat risk 4/10 · Minor
- Hot days now (above 87°F)
- 6 days/yr
- Hot days in 30 yrs
- 15 days/yr
Wind risk 6/10 · Moderate
- Chance of severe wind over 30 yrs
- 56.0%
Air-quality risk 2/10 · Minimal
- Unhealthy air days now
- 1 days/yr
- Unhealthy air days in 30 yrs
- 2 days/yr
Risk factors via First Street. Map © Google.
Why this score? — see what drove the B grade
The composite is a weighted blend of 9 inputs, each scored 0–100. Each bar is that input's sub-score; the figure is the points it added to the 100-point composite (weight × sub-score).
- Cash flow +28.4/30.0
- DSCR +10.0/10.0
- 1% rule +9.4/10.0
- Schools +7.6/10.0
- ARV discount +7.5/15.0
- Livability +4.0/5.0
- Rent growth +2.5/5.0
- Condition / age +2.5/5.0
- Appreciation +0.0/10.0
$174,000
🖨 Deal sheet 📄 Offer letter ✓ Due diligence
Listing remarks
Tucked away on a quiet cul-de-sac, this charming and cozy 3-bedroom, 1.5-bath home offers comfort, privacy, and value. Inside, you'll find an inviting open-concept living space with a functional layout designed for easy, single-level living. Ideally located in the heart of Wells, you're just minutes from local beaches, restaurants, and everything the area has to offer. A spacious sunroom and open deck provide the perfect setting to relax or entertain with family and friends. Offering the best of both worlds--peaceful living and close proximity to coastal amenities--this home is a wonderful opportunity to put your stamp on it at an affordable price. Whether you're searching for a seasonal re
Key facts
- Parking
- Built 1996
- Listed 36 days
Property features AI
Finance
- Financial info: Land lease present
- HOA & community: Has association with a $360 monthly fee; No dogs allowed
Exterior
- Parking: Gravel parking; 1–4 parking spaces
- Utilities: Public water; Public sewer; Electric service with circuit breakers; Electric water heater; Utilities are on
- Home design: Mobile home (single wide); Fleetwood Oakland model; 1996 construction
- Construction: Vinyl siding; Metal and shingle roof
- Exterior features: Deck; Glassed-in porch; Shed(s); Located in a mobile home park; Near public beach; Near turnpike/interstate; Near town; Neighborhood setting; Cul-de-sac; Level lot; Private road frontage; Paved road
Interior
- Kitchen: Gas range; Refrigerator
- Bedrooms: Bedroom 1 on first floor; Bedroom 2 on first floor; Bedroom 3 on first floor
- Flooring: Carpet; Linoleum
- Bathrooms: 1 full bathroom; 1 half bathroom
- Heating & cooling: Forced air heating; Central air conditioning
- Interior features: One-floor living; First-floor bedroom; Bathtub; Storm windows
- Laundry & utility: Washer and dryer on main level
Neighborhood map
What this means for you Summary
Snapshot
- This is a 2-bed/2.0-bath manufactured listed at $174k.
Deal economics
- At list price, monthly cash flow is $565 ($7k/yr) — positive.
- The deal already cash-flows at list — no discount required.
- Meets the 1% rule at list price ($3k rent vs $174k).
- Recommended offer: $169k (3.0% below list) — sets the bar for market timing.
- Cap rate 10.2% vs local median 3.2% in Kennebunk — top-decile yield for the area; either an underpriced asset or a hidden risk that comps aren't pricing in. Stress-test before assuming the spread holds.
Location & tenants
- Location reads 79/100 on livability (#20 in ME, #2,049 nationally) — a middle-class / working-renter tenant base. Strengths: schools A+, crime A+, employment A+; Watch: cost of living D+, amenities F, commute F.
- Wells-Ogunquit CSD (rural): math 87% / reading 90% proficiency, ranked #32 of 112 in ME (top 29%) — strong family-tenant draw, lease renewals of 3-5y typical; only 17% free/reduced lunch — higher-income household profile.
- Market conditions: 267 active listings in the ZIP; 1,386 units permitted in York County in 2024 (338 in 5+ unit buildings).
Forward outlook
- Local home prices are declining (-3.0%/yr); year-one equity from $1k of loan paydown is wiped out by about $5k of value loss. Plan a longer hold.
- At projected returns (-3.0% appreciation + 3.0% rent growth), your $49k cash investment doubles in ~9 years — after that, you're playing with house money.
Negotiation context
- It's been on market 36 days — a 3% lower offer ($169k) is reasonable based on typical stale-listing flexibility.
Risks & watch-outs
- Climate carrying-cost: major wind risk, 56% chance of damaging wind over 30y — expect insurance premiums to compound above CPI over the hold.
Questions for the listing agent
- It's been on market 36 days. Have you received any prior offers? Is the seller open to a 3% concession, seller financing, or rate buy-down credit?
- What does the HOA fee cover, when was the last increase, and are there any pending special assessments or reserve-fund shortfalls?
- Is there a deadline driving the sale (1031 exchange, divorce, estate, relocation)? That informs how much negotiation room exists.
- Schools are A-rated — typically a magnet for longer-tenancy family renters. What's the average tenant stay here, and is there a school-zone premium baked into asking?
- What's the average days-on-market for RENTAL listings here right now (not sales)? A rising rental-DOM trend means longer vacancies and softer asking-rent achievability than the comps imply.
- What's the recent tenant-quality profile in this submarket — average credit score on applications, eviction rate, late-payment / NSF rate, and stable-employment percentage? A property-management company in the area should have these aggregated.
- How much new for-sale + rental construction is in the pipeline within 1–3 miles? Heavy new supply typically softens prices + rents 12–24 months out; constrained supply supports both.
Investment metrics
- 1% rule
- 1.44% ✓
- Cap rate
- 10.19%
- Cash-on-cash
- 13.90%
- DSCR
- 1.62
- GRM
- 5.8
CMA / ARV
- ARV (median comp)
- $84,007
- List price
- $174,000
- Delta
- 107.13%
- Verdict
- OVERPRICED
- Comps
- 20 within 1.0 mi
Show comp detail 12 sales within ~0.75 mi
| Address | Dist | Beds/Ba | Sqft | Sold | Price | $/sf | Match |
|---|---|---|---|---|---|---|---|
| 90 Poplar Park Dr | 0.05mi | 2/1.5 | 924 (0%) | 4mo | $200,000 | $216 | 93 |
| 61 Poplar Park Dr | 0.03mi | 2/2.0 | 938 (+2%) | 10mo | $245,000 | $261 | 87 |
| 150 Chapel Rd #118 | 0.29mi | 2/1.0 | 1,000 (+8%) | 1mo | $40,000 | $40 | 68 |
| 150 Chapel Rd #722 | 0.29mi | 2/1.0 | 884 (-4%) | 10mo | $79,900 | $90 | 67 |
| 150 Chapel Rd #821 | 0.29mi | 1/1.0 (-1) | 884 (-4%) | 9mo | $59,000 | $67 | 63 |
| 150 Chapel Rd Unit U-119 | 0.29mi | 2/1.0 | 1,000 (+8%) | 8mo | $44,000 | $44 | 62 |
| 150 Chapel Rd #706 | 0.29mi | 3/1.0 (+1) | 834 (-10%) | 7mo | $54,000 | $65 | 55 |
| 392 Sanford Rd | 0.70mi | 2/1.5 | 882 (-4%) | 4mo | $250,000 | $283 | 54 |
| 23 College Dr #121 | 0.70mi | 3/1.0 (+1) | 894 (-3%) | 1mo | $75,000 | $84 | 52 |
| 23 College Dr #214 | 0.70mi | 3/1.0 (+1) | 866 (-6%) | 11mo | $101,000 | $117 | 39 |
| 23 College Dr #117 | 0.70mi | 2/1.0 | 816 (-12%) | 10mo | $101,000 | $124 | 36 |
| 23 College Dr #512 | 0.70mi | 3/1.0 (+1) | 844 (-9%) | 10mo | $75,000 | $89 | 36 |
Match score weights: distance 35% · size 25% · config 20% · recency 20%. Top-matched comps best support the ARV.
Projected returns pro-forma
-3.0% appreciation · 3.0% rent growth · sell at horizon
- IRR
- 4.2%
- Equity multiple
- 1.16×
- Total profit
- $7,930
- Equity at exit
- $25,944
- IRR
- 13.8%
- Equity multiple
- 2.11×
- Total profit
- $53,898
- Equity at exit
- $15,044
Cash invested: $48,720 (down + closing). Projections, not guarantees.
Landlord ↔ Tenant lean methodology
- Overall (STATE)
- 41 Moderately Tenant-Leaning
- State Maine
- 41 Moderately Tenant-Leaning · D+2
- County
- — inherits STATE
- City
- — inherits STATE
ZIP-level market 04090
- Home prices YoY
- -20.0%
- Active inventory
- 267
- Price-to-rent
- 5.8×
Monthly cashflow live
- Estimated rent
- $2,511 medium interval (Pro) →
- Mortgage (P&I)
- −$912
- Tax from tax record
- −$74 /mo · $891/yr
- Insurance
- −$72
- HOA
- −$360
- Vacancy / Maint / Mgmt
- −$527
- Net cashflow
- $565
Break-even live
UW: 25.0% down · 7.5% · 30yr · 1.5% tax · 5.0% vac · 8.0% maint · 8.0% mgmt
Financing live
Cash to close
- Down payment
- $43,500
- Closing costs
- $5,220
- Reserves months
- —
- Total cash needed
- —
Loan-product check · same deal, 3 products live
Conventional
25% down · 7.5% · 30yr
- Down + closing
- —
- Monthly P&I
- —
- Monthly cashflow
- —
- DSCR
- —
- Eligible?
- —
Personal DTI + credit; lowest rate.
DSCR
20% down · 8.5% · 30yr
- Down + closing
- —
- Monthly P&I
- —
- Monthly cashflow
- —
- DSCR
- —
- Eligible?
- —
No personal income docs; deal must DSCR.
Hard money
10% down · 12.0% · 12mo
- Down + closing
- —
- Monthly P&I
- —
- Monthly cashflow
- —
- DSCR
- —
- Eligible?
- —
Short-term bridge; refi at stabilization.
HOA detail
- Monthly dues
- $360 · $4,320/yr
Listing history 11 events
-
2026-06-10status $174,000 Pending 36 DOM
-
2026-06-09days on market $174,000 Active 36 DOM
-
2026-06-08days on market $174,000 Active 35 DOM
-
2026-06-07days on market $174,000 Active 34 DOM
-
2026-06-05days on market $174,000 Active 31 DOM
-
2026-06-03days on market $174,000 Active 30 DOM
-
2026-06-02days on market $174,000 Active 29 DOM
-
2026-06-01days on market $174,000 Active 28 DOM
-
2026-05-31days on market $174,000 Active 27 DOM
-
2026-05-30days on market $174,000 Active 26 DOM
-
2026-05-04$189,000 Active 851-char remark
ⓘ Source: listings_history table (triggers on properties + properties_extension) + one-shot
backfill from property_details.listing_events for pre-trigger history.
Tax reassessment forecast ME · Partial reset (capped growth)
- Current annual tax
- $891 · $74/mo
- Projected year-2 tax
- $1,629 · $136/mo
- Expected delta
- +$738/yr (+$61/mo · 82.8%)
ⓘ Screening estimate from a state-policy table — verify with the county assessor before closing.
Climate risk First Street
- Flood 1/10 Low FEMA zone X · 0% chance over 30 yrs
- Wildfire 1/10 Low
- Heat 4/10 Moderate 6 d/yr ≥87°F today · 15 d/yr by 30 yrs out
- Wind 6/10 Major 56% chance of damaging wind over 30 yrs
- Air quality 2/10 Low 1 unhealthy d/yr today · 2 by 30 yrs out
Nearby sold comps map
Loading sold comps map…
Walkable amenities ~0.75 mi
Loading nearby amenities…
Taxation est. · year 1
- Rental income
- $30,133
- − Mortgage interest
- −$9,747
- − Property taxes
- −$891
- − Insurance
- −$870
- − Repairs & maintenance
- −$2,411
- − Management
- −$2,411
- − HOA
- −$4,320
- − Depreciation
- −$5,062
- Taxable income
- $4,422
- Est. tax owed @ 24.0%
- −$1,061
- After-tax cash flow
- $5,713/yr
For passive investors: Depreciation is non-cash, so a rental often shows a tax loss while cash-flowing — sheltering income. Rental losses are passive: they offset passive income freely, and up to $25,000/yr can offset ordinary (W-2) income if you actively participate and your MAGI is under $100k (phasing out to $0 by $150k); unused losses carry forward. On sale, claimed depreciation is recaptured at up to 25%, and gains may owe capital-gains tax (a 1031 exchange can defer both). Figures are a year-1 estimate at your 24.0% rate — not tax advice; consult a CPA.
Schools (NCES district)
- District
- Wells-Ogunquit CSD
- NCES district ID
- 2313490
- Math proficiency
- 87% ▲ 42.00%
- Reading proficiency
- 90% ▲ 26.00%
- Median HH income
- $61,341
- Composite
- 75.79/100
- National rank
- #125
- State rank
- #32 of 112 in ME
Livability — Kennebunk
- Score
- 79/100
- State rank
- #20
- US rank
- #2049
Category grades
Schools grade is shown separately in the Schools card above.
Census & demographics
- Population (ZIP)
- 11,544
Population outlook (York County) Hauer SSP2
- Today (2025)
- 209,961 people
- By 2030
- 212,816 · +1.4%
- By 2040
- 214,360 · +2.1%
- By 2050
- 210,350 · +0.2%
- By 2075
- 201,686 · -3.9%
- By 2100
- 183,392 · -12.7%
Race, ethnicity, and origin ACS 2023
- Neighborhood character
- Predominantly White (89%)
- Race & ethnicity
- White 89% Two or more races 5% Black 3% Asian 1%
- Common ancestry
- Lithuanian 11% Romanian 3% Slovak 3%
- Foreign-born
- 5% · Canada, China
- Languages at home
- 94% English-only · Other Indo-European 1% French/Haitian/Cajun 1% Other Asian/Pacific 1%
Political lean MEDSL · York
- 2024 margin
- D (+10.5) · D 54.3% · R 43.8% · Other 1.9%
- 2008→2024 swing
- -10.1pp toward R · 2008: 20.5pp · 2024: 10.5pp
- All cycles
- 2024: D+10.5 2020: D+12.6 2016: D+4.8 2012: D+16.4 2008: D+20.5
Not yet ingested
- Civics
- —
Market trends
- HPI YoY
- ▼ -103.52%
- Current HPI
- 413.9951
- Rent YoY
- —
- Metro
- —
- State GDP YoY
- —
- F500 in state
- 0
Price history
-7.9% since first listed3 events — show timeline
- 2026-06-09 Pending — MREIS
- 2026-05-20 Price Changed $174,000 MREIS
- 2026-05-04 Listed $189,000 MREIS
Property tax history
+6.7%/yrLatest (2025): $891 · +63.8% YoY. Source: county tax records.
Cash-flow waterfall
monthlySold comps — $/sqft
last 12 mo · ≤1 miLoading sold comps…