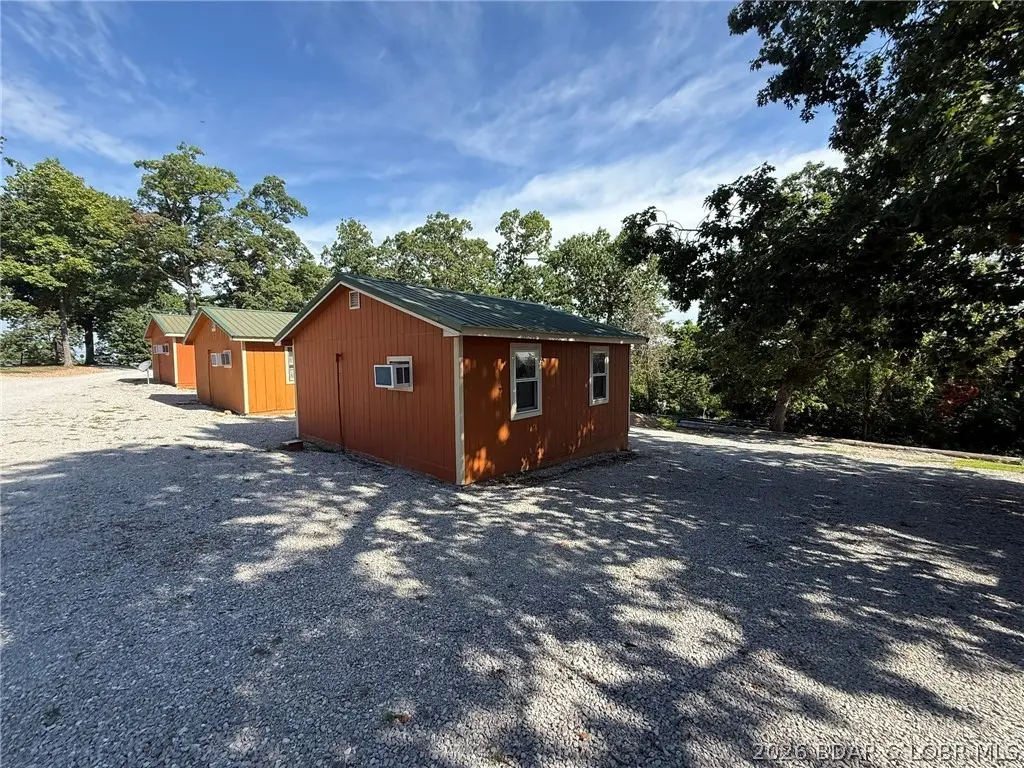
29774 Liars Loop Unit Cabis 1-3 · Bent Tree Harbor, MO
Flood risk 1/10 · Minimal
- FEMA flood zone
- X (unshaded)
- Chance of flooding over 30 yrs
- 0.0%
- Est. flood insurance / yr
- $507 – $1,088
Fire risk 3/10 · Minor
- Est. fire insurance / yr
- $1,054 – $1,958
Heat risk 4/10 · Minor
- Hot days now (above 109°F)
- 7 days/yr
- Hot days in 30 yrs
- 18 days/yr
Wind risk 2/10 · Minimal
- Chance of severe wind over 30 yrs
- 0.0%
Air-quality risk 1/10 · Minimal
- Unhealthy air days now
- 0 days/yr
- Unhealthy air days in 30 yrs
- 0 days/yr
Risk factors via First Street. Map © Google.
Why this score? — see what drove the D grade
The composite is a weighted blend of 9 inputs, each scored 0–100. Each bar is that input's sub-score; the figure is the points it added to the 100-point composite (weight × sub-score).
- ARV discount +15.0/15.0
- Appreciation +7.7/10.0
- Cash flow +6.4/30.0
- Schools +3.0/10.0
- Rent growth +2.5/5.0
- Livability +2.5/5.0
- Condition / age +2.5/5.0
- 1% rule +1.6/10.0
- DSCR +0.7/10.0
$201,750
🖨 Deal sheet (PDF) 📄 Offer letter ✓ Due diligence
Listing remarks
Cabin 1 & Cabin 2 are single-unit layouts, each with two full-size beds and a hide-a-bed, kitchenette with 4-burner cooktop, refrigerator, and toaster oven, plus full bath. Cabin 3 is a single-room unit with one king-size bed, kitchenette with 4-burner cooktop and refrigerator, toaster oven, and full bath. Just down the road from Truman State Park Marina giving you quick and easy access to Truman Lake, while also being close to Drake Harbor where you can access the Lake of the Ozarks. All three cabins have been successful rentals and have a long clients list. Would make for a great income producing opportunity.
Key facts
- Successful rentals
- 0.24 acre lot
- Built 1984
Tags
Property features AI
Finance
- Other: Directions provided by listing: Use 29720 State Highway UU; from Warsaw take MO-7 N toward Clinton, right on State Hwy UU, right toward Onlooker Ln, follow to cabins on left
- HOA & community: Association fee covers sewer
Exterior
- Parking: Gravel parking, no garage
- Utilities: Sewer included in association fees
- Home design: Detached single-family residence; Residential property
- Construction: Wood siding; Slab foundation; Built with approximately 1,200 square feet
- Exterior features: Asphalt-paved road access; Lot: 0.24 acres; Zoned residential
Interior
- Kitchen: Cooktop, Range, Refrigerator
- Bathrooms: 3 full bathrooms
- Heating & cooling: Window unit(s) cooling
- Interior features: Cooktop, Range, Refrigerator; No fireplace
Neighborhood map
What this means for you Summary
Snapshot
- This is a 3-bed/3.0-bath single-family listed at $202k.
Deal economics
- At list price, monthly cash flow is $-348 ($-4k/yr) — negative.
- To cash-flow at today's rent, offer at most $151k (24.9% below list).
- To meet the 1% rule (rent ≥ 1% of price), the offer needs to be $132k (34.3% below list).
- Recommended offer: $132k (34.3% below list) — sets the bar for 1% rule.
Location & tenants
- Location reads: area grade D — affects rentability + tenant quality, not the cash-flow math above.
- Warsaw R-IX (rural): math 30% / reading 42% proficiency, ranked #222 of 324 in MO (top 68%) — families likely to look elsewhere, expect single-tenant / working-renter base with shorter leases; 61% free/reduced lunch — lower-income household profile, screen leases tightly.
- Zoned schools: John Boise Middle School (math 37% / reading 40%, grade F, #202 of 391 statewide, top 54%, 278 students, 99% FRL); Warsaw High School (math 27% / reading 52%, grade F, #247 of 521 statewide, top 55%, 403 students, 99% FRL) — zoned schools average 99% FRL vs 61% district-wide (38 pts higher); higher-poverty schools than district average — tighter screening recommended.
- Market conditions: 275 active listings in the ZIP; 9 units permitted in Benton County in 2024 (0 in 5+ unit buildings).
Forward outlook
- In year one you build about $12k of equity ($1k loan paydown + $11k appreciation (5.5% local appreciation)).
- Benton County population projected at -21% by 2050 — secular population decline; favor cash flow + early exit over multi-decade hold.
- By year 3, paydown + projected appreciation supports a ~$31k cash-out refi (75% LTV) — recoverable capital for the next deal without selling this one.
Negotiation context
- It's been on market 45 days — a 3% lower offer ($196k) is reasonable based on typical stale-listing flexibility.
Questions for the listing agent
- What do current leases actually rent for vs. the listed asking? Can we see a recent rent roll and the last 12 months of T-12 income?
- It's been on market 45 days. Have you received any prior offers? Is the seller open to a 34% concession, seller financing, or rate buy-down credit?
- Is there a deadline driving the sale (1031 exchange, divorce, estate, relocation)? That informs how much negotiation room exists.
- The area grade is low — what's the realistic commute time and amenity access for the typical tenant pool here? Any planned neighborhood developments (good or bad) we should know about?
- What's the average days-on-market for RENTAL listings here right now (not sales)? A rising rental-DOM trend means longer vacancies and softer asking-rent achievability than the comps imply.
- What's the recent tenant-quality profile in this submarket — average credit score on applications, eviction rate, late-payment / NSF rate, and stable-employment percentage? A property-management company in the area should have these aggregated.
- How much new for-sale + rental construction is in the pipeline within 1–3 miles? Heavy new supply typically softens prices + rents 12–24 months out; constrained supply supports both.
Investment metrics
- 1% rule
- 0.66% ✗
- Cap rate
- 4.23%
- Cash-on-cash
- -7.38%
- DSCR
- 0.67
- GRM
- 12.7
CMA / ARV
- ARV (median comp)
- $274,239
- List price
- $201,750
- Delta
- -26.43%
- Verdict
- UNDERPRICED
- Comps
- 1 within 2.0 mi
Projected returns pro-forma
5.45% appreciation · 3.0% rent growth · sell at horizon
- IRR
- 7.9%
- Equity multiple
- 1.52×
- Total profit
- $29,610
- Equity at exit
- $119,888
- IRR
- 9.7%
- Equity multiple
- 2.88×
- Total profit
- $106,414
- Equity at exit
- $211,660
Cash invested: $56,490 (down + closing). Projections, not guarantees.
Landlord ↔ Tenant lean methodology
- Overall (STATE)
- 81 Strongly Landlord-Friendly
- State Missouri
- 81 Strongly Landlord-Friendly · R+10
- County
- — inherits STATE
- City
- — inherits STATE
ZIP-level market 65355
- Home prices YoY
- 2.4%
- Active inventory
- 275
- Price-to-rent
- 12.7×
Monthly cashflow live
- Estimated rent
- $1,325 medium interval (Pro) →
- Mortgage (P&I)
- −$1,058
- Tax est. 1.5%
- −$252 /mo · $3,026/yr
- Insurance
- −$84
- HOA
- −$0
- Vacancy / Maint / Mgmt
- −$278
- Net cashflow
- $-348
Break-even live
Sensitivity live
| Price | -10% $-208 | -5% $-278 | +0% $-348 | +5% $-417 | +10% $-487 |
|---|---|---|---|---|---|
| Rent | -10% $-452 | -5% $-400 | +0% $-348 | +5% $-295 | +10% $-243 |
| Rate | -1.0pp $-246 | -0.5pp $-296 | base $-348 | +0.5pp $-400 | +1.0pp $-453 |
UW: 25.0% down · 7.5% · 30yr · 1.5% tax · 5.0% vac · 8.0% maint · 8.0% mgmt
Financing live
Cash to close
- Down payment
- $50,438
- Closing costs
- $6,052
- Reserves months
- —
- Total cash needed
- —
Loan-product check · same deal, 3 products live
Conventional
25% down · 7.5% · 30yr
- Down + closing
- —
- Monthly P&I
- —
- Monthly cashflow
- —
- DSCR
- —
- Eligible?
- —
Personal DTI + credit; lowest rate.
DSCR
20% down · 8.5% · 30yr
- Down + closing
- —
- Monthly P&I
- —
- Monthly cashflow
- —
- DSCR
- —
- Eligible?
- —
No personal income docs; deal must DSCR.
Hard money
10% down · 12.0% · 12mo
- Down + closing
- —
- Monthly P&I
- —
- Monthly cashflow
- —
- DSCR
- —
- Eligible?
- —
Short-term bridge; refi at stabilization.
Listing history 18 events
-
2026-06-21days on market $201,750 Active 45 DOM
-
2026-06-21days on market $201,750 Active 44 DOM
-
2026-06-18days on market $201,750 Active 42 DOM
-
2026-06-17days on market $201,750 Active 41 DOM
-
2026-06-16days on market $201,750 Active 40 DOM
-
2026-06-15days on market $201,750 Active 39 DOM
-
2026-06-13days on market $201,750 Active 37 DOM
-
2026-06-12days on market $201,750 Active 36 DOM
-
2026-06-09days on market $201,750 Active 33 DOM
-
2026-06-08days on market $201,750 Active 32 DOM
-
2026-06-07days on market $201,750 Active 31 DOM
-
2026-06-07days on market $201,750 Active 30 DOM
-
2026-06-04days on market $201,750 Active 27 DOM
-
2026-06-02days on market $201,750 Active 26 DOM
-
2026-06-01days on market $201,750 Active 25 DOM
-
2026-05-31days on market $201,750 Active 24 DOM
-
2026-05-31days on market $201,750 Active 23 DOM
-
2026-05-07$201,750 Active 624-char remark
ⓘ Source: listings_history table (triggers on properties + properties_extension) + one-shot
backfill from property_details.listing_events for pre-trigger history.
Climate risk First Street
- Flood 1/10 Low FEMA zone X (unshaded) · 0% chance over 30 yrs
- Wildfire 3/10 Moderate
- Heat 4/10 Moderate 7 d/yr ≥109°F today · 18 d/yr by 30 yrs out
- Wind 2/10 Low 0% chance of damaging wind over 30 yrs
- Air quality 1/10 Low 0 unhealthy d/yr today · 0 by 30 yrs out
Nearby sold comps map
Loading sold comps map…
Walkable amenities ~0.75 mi
Loading nearby amenities…
Taxation est. · year 1
- Rental income
- $15,899
- − Mortgage interest
- −$11,301
- − Property taxes
- −$3,026
- − Insurance
- −$1,009
- − Repairs & maintenance
- −$1,272
- − Management
- −$1,272
- − Depreciation
- −$5,869
- Taxable loss
- −$7,850
- Est. tax savings @ 24.0%
- +$1,884
- After-tax cash flow
- $-2,287/yr
For passive investors: Depreciation is non-cash, so a rental often shows a tax loss while cash-flowing — sheltering income. Rental losses are passive: they offset passive income freely, and up to $25,000/yr can offset ordinary (W-2) income if you actively participate and your MAGI is under $100k (phasing out to $0 by $150k); unused losses carry forward. On sale, claimed depreciation is recaptured at up to 25%, and gains may owe capital-gains tax (a 1031 exchange can defer both). Figures are a year-1 estimate at your 24.0% rate — not tax advice; consult a CPA.
Schools (NCES district)
- District
- Warsaw R-IX
- NCES district ID
- 2931070
- Math proficiency
- 30% ▬ 0.00%
- Reading proficiency
- 42% ▲ 4.00%
- Median HH income
- $33,160
- Composite
- 29.53/100
- National rank
- #6495
- State rank
- #222 of 324 in MO
Livability — Bent Tree Harbor
No livability data for this city. (Only ~50 U.S. cities are tracked.)
Census & demographics
- Population (ZIP)
- 11,029
Population outlook (Benton County) Hauer SSP2
- Today (2025)
- 17,355 people
- By 2030
- 16,513 · -4.9%
- By 2040
- 14,898 · -14.2%
- By 2050
- 13,662 · -21.3%
- By 2075
- 11,308 · -34.8%
- By 2100
- 8,755 · -49.6%
Race, ethnicity, and origin ACS 2023
- Neighborhood character
- Predominantly White (92%)
- Race & ethnicity
- White 92% Two or more races 6% Hispanic / Latino 2% Native American 1%
- Common ancestry
- Slovak 3% Italian 2% Iranian 2%
- Foreign-born
- 1% · Canada
Political lean MEDSL · Benton
- 2024 margin
- Solid R (+59.1) · D 20.1% · R 79.2%
- 2008→2024 swing
- -36.8pp toward R · 2008: -22.3pp · 2024: -59.1pp
- All cycles
- 2024: R+59.1 2020: R+56.6 2016: R+54.1 2012: R+34.3 2008: R+22.3
Not yet ingested
- Civics
- —
Market trends
- HPI YoY
- ▲ 5.45%
- Current HPI
- 232.6924
- Rent YoY
- —
- Metro
- —
- State GDP YoY
- ▲ 1.84%
- F500 in state
- 20
Industry mix (Fortune 500 HQ in MO)
| Industry | F500 HQs | Revenue |
|---|---|---|
| Healthcare | 1 | $163B |
|
||
| Insurance | 1 | $21B |
|
||
| Industrial Technology | 1 | $17B |
|
||
| Retail | 1 | $16B |
|
||
| Industrial Distribution | 1 | $10B |
|
||
| Utilities | 1 | $9B |
|
||
Price history
1 event — show timeline
- 2026-05-07 Listed $201,750 LOBR
Cash-flow waterfall
monthlySold comps — $/sqft
last 12 mo · ≤1 miLoading sold comps…