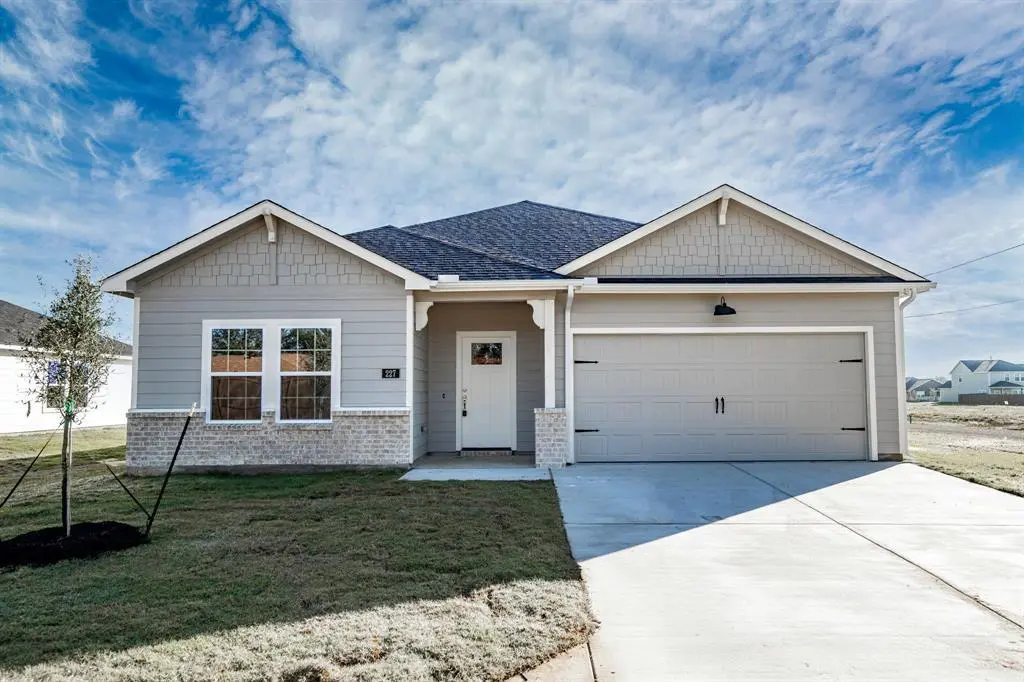
227 Faith Ln · Tioga, TX
Flood risk No data
- FEMA flood zone
- —
- Chance of flooding over 30 yrs
- —
- Est. flood insurance / yr
- —
Fire risk No data
- Est. fire insurance / yr
- —
Heat risk No data
- Hot days now (above threshold)
- —
- Hot days in 30 yrs
- —
Wind risk No data
- Chance of severe wind over 30 yrs
- —
Air-quality risk No data
- Unhealthy air days now
- —
- Unhealthy air days in 30 yrs
- —
Risk factors via First Street. Map © Google.
Why this score? — see what drove the C- grade
The composite is a weighted blend of 9 inputs, each scored 0–100. Each bar is that input's sub-score; the figure is the points it added to the 100-point composite (weight × sub-score).
- ARV discount +14.1/15.0
- Cash flow +9.5/30.0
- Appreciation +8.7/10.0
- 1% rule +4.0/10.0
- Schools +4.0/10.0
- Condition / age +4.0/5.0
- Livability +3.3/5.0
- DSCR +2.7/10.0
- Rent growth +2.5/5.0
$299,000
🖨 Deal sheet 📄 Offer letter ✓ Due diligence
Listing remarks MLS
BUILDER IS OFFERING 4% INTEREST, SPECIAL PROVISIONS APPLY. Welcome to this delightful, single-story Craftsman located in the heart of Tioga, perfectly situated near Tioga schools for added convenience. Step inside to discover an open and inviting floor plan designed for today's lifestyle. The primary suite offers a private oasis, complete with an ensuite bathroom that features dual sinks, a separate shower, linen cabinet and walk-in closet. The kitchen will delight any chef, boasting a central island, sleek granite countertops, and a walk-in pantry. A dedicated utility room enhances the home’s practicality. Relax in the cozy living room, ideal for gathering. Additional highlights include a 2-car garage, a covered rear patio, energy-efficient windows and appliances, a beautifully landscaped yard equipped with a sprinkler system and rain gutters. This home is a true find—combining style, comfort, and an unbeatable location!
Key facts
- Central island
- Private oasis
- Ensuite bathroom
Tags
Neighborhood map
What this means for you Summary
Snapshot
- This is a 3-bed/2.0-bath single-family listed at $299k. Condition is rated good.
Deal economics
- At list price, monthly cash flow is $-209 ($-3k/yr) — negative.
- To cash-flow at today's rent, offer at most $262k (12.3% below list).
- To meet the 1% rule (rent ≥ 1% of price), the offer needs to be $270k (9.7% below list).
- Recommended offer: $262k (12.3% below list) — sets the bar for cash-flow.
- Cap rate 5.5% vs local median 4.2% in Tioga — top-decile yield for the area; either an underpriced asset or a hidden risk that comps aren't pricing in. Stress-test before assuming the spread holds.
Location & tenants
- Location reads 66/100 on livability (#656 in TX) — a middle-class / working-renter tenant base. Strengths: crime A+, cost of living A+, housing A+; Watch: amenities F, commute F, health & safety F.
- Tioga ISD (rural): math 44% / reading 50% proficiency, ranked #226 of 826 in TX (top 27%) — families likely to look elsewhere, expect single-tenant / working-renter base with shorter leases.
- Market conditions: 84 active listings in the ZIP; 1 comparable units currently listed for rent nearby; 2,272 units permitted in Grayson County in 2024 (750 in 5+ unit buildings).
Forward outlook
- In year one you build about $24k of equity ($2k loan paydown + $22k appreciation (7.5% local appreciation)).
- Grayson County population projected at +12% by 2050 — modest demand growth; plan on rents tracking national, not racing it.
- By year 2, paydown + projected appreciation supports a ~$39k cash-out refi (75% LTV) — recoverable capital for the next deal without selling this one.
Negotiation context
- It's been on market 134 days — a 12% lower offer ($263k) is reasonable based on typical stale-listing flexibility.
- 2 sale attempts since 2y ago with the ask held roughly flat each time — persistent listings suggest the price (not the market) is what's stuck; bring a comps-based counter.
Risks & watch-outs
- Watch-outs: property tax is 2.6% of price.
Questions for the listing agent
- What do current leases actually rent for vs. the listed asking? Can we see a recent rent roll and the last 12 months of T-12 income?
- It's been on market 134 days. Have you received any prior offers? Is the seller open to a 12% concession, seller financing, or rate buy-down credit?
- Property tax is high relative to price — has the assessment been appealed recently, and will the sale trigger a re-assessment?
- Why hasn't it sold? Are there any deal-killer items the seller is aware of (foundation, flood, title, zoning, code violations)?
- Is there a deadline driving the sale (1031 exchange, divorce, estate, relocation)? That informs how much negotiation room exists.
- What's the average days-on-market for RENTAL listings here right now (not sales)? A rising rental-DOM trend means longer vacancies and softer asking-rent achievability than the comps imply.
- What's the recent tenant-quality profile in this submarket — average credit score on applications, eviction rate, late-payment / NSF rate, and stable-employment percentage? A property-management company in the area should have these aggregated.
- How much new for-sale + rental construction is in the pipeline within 1–3 miles? Heavy new supply typically softens prices + rents 12–24 months out; constrained supply supports both.
Investment metrics
- 1% rule
- 0.90% ✗
- Cap rate
- 5.46%
- Cash-on-cash
- -2.99%
- DSCR
- 0.87
- GRM
- 9.2
CMA / ARV
- ARV (median comp)
- $350,744
- List price
- $299,000
- Delta
- -14.75%
- Verdict
- UNDERPRICED
- Comps
- 20 within 1.0 mi
Show comp detail 12 sales within ~0.75 mi
| Address | Dist | Beds/Ba | Sqft | Sold | Price | $/sf | Match |
|---|---|---|---|---|---|---|---|
| 404 N Florence St | 0.39mi | 3/2.0 | 1,535 (+0%) | 0mo | $342,500 | $223 | 82 |
| 611 Kyle Dr | 0.17mi | 3/2.0 | 1,620 (+6%) | 10mo | $355,000 | $219 | 74 |
| 713 Arapaho Dr | 0.25mi | 3/2.0 | 1,667 (+9%) | 2mo | $275,000 | $165 | 72 |
| 615 N Lamar St | 0.08mi | 3/2.0 | 1,740 (+14%) | 3mo | $400,000 | $230 | 72 |
| 402 E Main St | 0.61mi | 3/2.5 | 1,529 (-0%) | 1mo | $299,999 | $196 | 68 |
| 718 Arapaho Dr | 0.35mi | 2/2.0 (-1) | 1,395 (-9%) | 2mo | $375,000 | $269 | 62 |
| 603 Mohawk Dr | 0.36mi | 3/2.0 | 1,674 (+9%) | 7mo | $445,000 | $266 | 62 |
| 401 Cutler St | 0.45mi | 3/1.0 | 1,476 (-4%) | 9mo | $229,000 | $155 | 62 |
| 504 N Texas St | 0.40mi | 2/1.0 (-1) | 1,661 (+8%) | 1mo | $525,000 | $316 | 58 |
| 714 Mohawk Dr | 0.36mi | 3/2.0 | 1,712 (+12%) | 8mo | $439,900 | $257 | 57 |
| 1008 N Main St | 0.68mi | 3/2.0 | 1,605 (+5%) | 8mo | $349,900 | $218 | 54 |
| 1207 Mary Ann Ct | 0.47mi | 3/2.0 | 1,762 (+15%) | 2mo | $349,000 | $198 | 52 |
Match score weights: distance 35% · size 25% · config 20% · recency 20%. Top-matched comps best support the ARV.
Projected returns pro-forma
7.47% appreciation · 3.0% rent growth · sell at horizon
- IRR
- 16.5%
- Equity multiple
- 2.19×
- Total profit
- $100,014
- Equity at exit
- $216,443
- IRR
- 16.0%
- Equity multiple
- 4.59×
- Total profit
- $300,462
- Equity at exit
- $419,802
Cash invested: $83,720 (down + closing). Projections, not guarantees.
Landlord ↔ Tenant lean methodology
- Overall (STATE)
- 87 Strongly Landlord-Friendly
- State Texas
- 87 Strongly Landlord-Friendly · R+5
- County
- — inherits STATE
- City
- — inherits STATE
ZIP-level market 76271
- Home prices YoY
- 2.6%
- Active inventory
- 84
- Price-to-rent
- 9.2×
Monthly cashflow live
- Estimated rent
- $2,700 medium interval (Pro) →
- Mortgage (P&I)
- −$1,568
- Tax from tax record
- −$649 /mo · $7,790/yr
- Insurance
- −$125
- HOA
- −$0
- Vacancy / Maint / Mgmt
- −$567
- Net cashflow
- $-209
Break-even live
UW: 25.0% down · 7.5% · 30yr · 1.5% tax · 5.0% vac · 8.0% maint · 8.0% mgmt
Financing live
Cash to close
- Down payment
- $74,750
- Closing costs
- $8,970
- Reserves months
- —
- Total cash needed
- —
Loan-product check · same deal, 3 products live
Conventional
25% down · 7.5% · 30yr
- Down + closing
- —
- Monthly P&I
- —
- Monthly cashflow
- —
- DSCR
- —
- Eligible?
- —
Personal DTI + credit; lowest rate.
DSCR
20% down · 8.5% · 30yr
- Down + closing
- —
- Monthly P&I
- —
- Monthly cashflow
- —
- DSCR
- —
- Eligible?
- —
No personal income docs; deal must DSCR.
Hard money
10% down · 12.0% · 12mo
- Down + closing
- —
- Monthly P&I
- —
- Monthly cashflow
- —
- DSCR
- —
- Eligible?
- —
Short-term bridge; refi at stabilization.
Rent comps 1 comps
| Address | Beds | Baths | Sqft | Rent | $/sqft | DOM | Units | Dist |
|---|---|---|---|---|---|---|---|---|
| 618 Kyle Dr Tioga, TX | 4.0 | 2.0 | 1741 | $2,700 | $1.55 | 43d | 1 | 0.11mi |
Listing history 19 events
-
2026-06-18days on market $299,000 Active 134 DOM
-
2026-06-17days on market $299,000 Active 133 DOM
-
2026-06-16days on market $299,000 Active 132 DOM
-
2026-06-15days on market $299,000 Active 131 DOM
-
2026-06-15days on market $299,000 Active 130 DOM
-
2026-06-13days on market $299,000 Active 129 DOM
-
2026-06-12days on market $299,000 Active 128 DOM
-
2026-06-09days on market $299,000 Active 125 DOM
-
2026-06-08days on market $299,000 Active 124 DOM
-
2026-06-08days on market $299,000 Active 123 DOM
-
2026-06-05days on market $299,000 Active 121 DOM
-
2026-06-03days on market $299,000 Active 119 DOM
-
2026-06-02days on market $299,000 Active 118 DOM
-
2026-06-01days on market $299,000 Active 117 DOM
-
2026-05-31days on market $299,000 Active 116 DOM
-
2026-02-04$299,000 Active 947-char remark
Show marketing remark (947 chars)
BUILDER IS OFFERING 4% INTEREST, SPECIAL PROVISIONS APPLY. Welcome to this delightful, single-story Craftsman located in the heart of Tioga, perfectly situated near Tioga schools for added convenience. Step inside to discover an open and inviting floor plan designed for today's lifestyle. The primary suite offers a private oasis, complete with an ensuite bathroom that features dual sinks, a separate shower, linen cabinet and walk-in closet. The kitchen will delight any chef, boasting a central island, sleek granite countertops, and a walk-in pantry. A dedicated utility room enhances the home’s practicality. Relax in the cozy living room, ideal for gathering. Additional highlights include a 2-car garage, a covered rear patio, energy-efficient windows and appliances, a beautifully landscaped yard equipped with a sprinkler system and rain gutters. This home is a true find—combining style, comfort, and an unbeatable location!
-
2026-01-02historical
-
2025-02-14price $319,000
-
2024-10-25$339,000 Active
ⓘ Source: listings_history table (triggers on properties + properties_extension) + one-shot
backfill from property_details.listing_events for pre-trigger history.
Tax reassessment forecast TX · Resets to sale price
- Current annual tax
- $7,790 · $649/mo
- Projected year-2 tax
- $7,790 · $649/mo
- Expected delta
- $0/yr ($0/mo · 0.0%)
ⓘ Screening estimate from a state-policy table — verify with the county assessor before closing.
Nearby sold comps map
Loading sold comps map…
Walkable amenities ~0.75 mi
Loading nearby amenities…
Taxation est. · year 1
- Rental income
- $32,400
- − Mortgage interest
- −$16,749
- − Property taxes
- −$7,790
- − Insurance
- −$1,495
- − Repairs & maintenance
- −$2,592
- − Management
- −$2,592
- − Depreciation
- −$8,698
- Taxable loss
- −$7,516
- Est. tax savings @ 24.0%
- +$1,804
- After-tax cash flow
- $-701/yr
For passive investors: Depreciation is non-cash, so a rental often shows a tax loss while cash-flowing — sheltering income. Rental losses are passive: they offset passive income freely, and up to $25,000/yr can offset ordinary (W-2) income if you actively participate and your MAGI is under $100k (phasing out to $0 by $150k); unused losses carry forward. On sale, claimed depreciation is recaptured at up to 25%, and gains may owe capital-gains tax (a 1031 exchange can defer both). Figures are a year-1 estimate at your 24.0% rate — not tax advice; consult a CPA.
Condition & rehab AI · 6 photos
This single-story Craftsman home in Tioga is in excellent condition with no visible repairs needed. It offers a good ROI with updates focusing on curb appeal and energy efficiency.
Value-add opportunities
- Both Painting exterior and interior walls — Fresh paint enhances curb appeal and interior aesthetics
- Both Landscaping and irrigation system — Aesthetic improvements and better water management
- Both Add a smart home system — Enhances home's value and energy efficiency
Renovation cost estimate screening
Value-add ROI direction
- Both Painting exterior and interior walls — Fresh paint enhances curb appeal and interior aesthetics ↑
- Both Landscaping and irrigation system — Aesthetic improvements and better water management ↑
- Both Add a smart home system — Enhances home's value and energy efficiency ↑
ⓘ Cost ranges are severity-bucket heuristics (US national rule-of-thumb). Get contractor quotes + a written scope before underwriting a rehab budget.
Schools (NCES district)
- District
- Tioga ISD
- NCES district ID
- 4842870
- Math proficiency
- 44% ▼ -12.00%
- Reading proficiency
- 50% ▼ -5.00%
- Median HH income
- $51,096
- Composite
- 40.38/100
- National rank
- #3735
- State rank
- #226 of 826 in TX
Livability — Tioga
- Score
- 66/100
- State rank
- #656
- US rank
- #12339
Category grades
Schools grade is shown separately in the Schools card above.
Census & demographics
- Census place
- Tioga, TX
- City population
- 1,864
- Population (ZIP)
- 1,864
Population outlook (Grayson County) Hauer SSP2
- Today (2025)
- 134,540 people
- By 2030
- 138,653 · +3.1%
- By 2040
- 145,958 · +8.5%
- By 2050
- 151,218 · +12.4%
- By 2075
- 161,802 · +20.3%
- By 2100
- 159,036 · +18.2%
Race, ethnicity, and origin ACS 2023
- Neighborhood character
- Predominantly White (91%)
- Race & ethnicity
- White 91% Hispanic / Latino 7% Two or more races 4% Native American 1%
- Hispanic origin (detail)
- Mexican 5%
- Common ancestry
- Slovak 2% Serbian 1% Romanian 1%
- Foreign-born
- 4% · Canada
- Languages at home
- 96% English-only · Spanish 4%
Political lean MEDSL · Grayson
- 2024 margin
- Solid R (+54.3) · D 22.5% · R 76.7%
- 2008→2024 swing
- -16.4pp toward R · 2008: -37.9pp · 2024: -54.3pp
- All cycles
- 2024: R+54.3 2020: R+49.9 2016: R+53.1 2012: R+48.0 2008: R+37.9
Not yet ingested
- Civics
- —
Market trends
- HPI YoY
- ▲ 7.47%
- Current HPI
- 297.1567
- Rent YoY
- —
- Metro
- —
- State GDP YoY
- ▲ 3.95%
- F500 in state
- 110
Industry mix (Fortune 500 HQ in TX)
| Industry | F500 HQs | Revenue |
|---|---|---|
| Energy | 16 | $1,198B |
|
||
| Technology | 5 | $198B |
|
||
| Engineering / Construction | 4 | $72B |
|
||
| Energy Services | 3 | $60B |
|
||
| Utilities | 3 | $41B |
|
||
| Healthcare | 2 | $330B |
|
||
Price history
-11.8% since first listed4 events — show timeline
- 2026-02-04 Listed $299,000 NTREIS
- 2026-01-02 Listing Removed — NTREIS
- 2025-02-14 Price Changed $319,000 NTREIS
- 2024-10-25 Listed $339,000 NTREIS
Property tax history
+276.5%/yrLatest (2025): $7,790 · +276.5% YoY. Source: county tax records.
Cash-flow waterfall
monthlySold comps — $/sqft
last 12 mo · ≤1 miLoading sold comps…