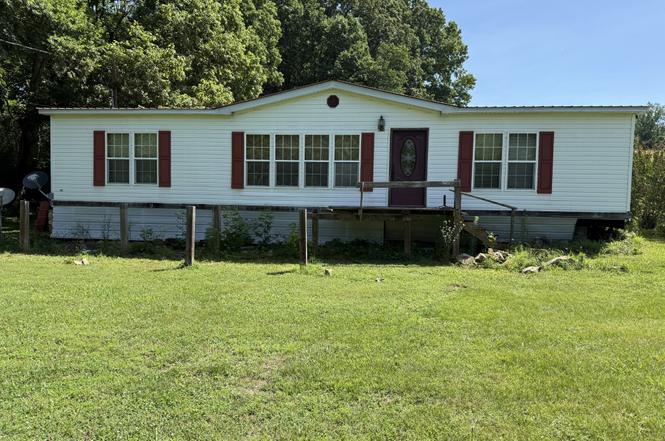
8356 Barren Fork Ln · Bon Aqua Junction, TN
Flood risk 8/10 · Major
- FEMA flood zone
- X (unshaded)
- Chance of flooding over 30 yrs
- 0.99%
- Est. flood insurance / yr
- $507 – $1,088
Fire risk 3/10 · Minor
- Est. fire insurance / yr
- $949 – $1,763
Heat risk 5/10 · Moderate
- Hot days now (above 108°F)
- 7 days/yr
- Hot days in 30 yrs
- 19 days/yr
Wind risk 4/10 · Minor
- Chance of severe wind over 30 yrs
- 12.0%
Air-quality risk 2/10 · Minimal
- Unhealthy air days now
- 1 days/yr
- Unhealthy air days in 30 yrs
- 1 days/yr
Risk factors via First Street. Map © Google.
Why this score? — see what drove the F grade
The composite is a weighted blend of 9 inputs, each scored 0–100. Each bar is that input's sub-score; the figure is the points it added to the 100-point composite (weight × sub-score).
- Cash flow +7.8/30.0
- ARV discount +7.5/15.0
- Appreciation +3.7/10.0
- Livability +3.2/5.0
- Rent growth +2.5/5.0
- Condition / age +2.5/5.0
- DSCR +1.8/10.0
- Schools +1.8/10.0
- 1% rule +1.1/10.0
$208,000
🖨 Deal sheet (PDF) 📄 Offer letter ✓ Due diligence
Listing remarks
Looking for privacy? You will find it here 5.23 ac offering 3 bedrooms, currently one bathroom, selling as is. Owner had started a remodel on primary bathroom and has not been completed. Large bedroom, great open kitchen, didn’t and living room with fireplace. Beautiful creek runs along side property.
Key facts
- 5.23 ac
- Open kitchen
- 5.23 acre lot
Tags
Property features AI
Exterior
- Utilities: Well water; Septic tank; Electricity available
- Home design: Residential mobile home; Single-story
- Construction: Vinyl siding
- Exterior features: 5.23-acre lot
Interior
- Kitchen: Electric range; Dishwasher; Refrigerator
- Bedrooms: 3 bedrooms (all on the main level)
- Flooring: Laminate flooring; Vinyl flooring
- Bathrooms: 1 full bathroom
- Heating & cooling: Central heating; Electric cooling
- Interior features: Electric range, dishwasher, and refrigerator; Living room fireplace; Crawl space basement
Neighborhood map
What this means for you Summary
Snapshot
- This is a 3-bed/2.0-bath manufactured listed at $208k.
Deal economics
- At list price, monthly cash flow is $-302 ($-4k/yr) — negative.
- To cash-flow at today's rent, offer at most $155k (25.6% below list).
- To meet the 1% rule (rent ≥ 1% of price), the offer needs to be $126k (39.5% below list).
- Recommended offer: $126k (39.5% below list) — sets the bar for 1% rule.
- Cap rate 4.9% vs local median 3.0% in Bon Aqua Junction — top-decile yield for the area; either an underpriced asset or a hidden risk that comps aren't pricing in. Stress-test before assuming the spread holds.
Location & tenants
- Location reads 64/100 on livability (#162 in TN) — a middle-class / working-renter tenant base. Strengths: cost of living A+, housing A+, crime B; Watch: health & safety C-, amenities F, commute F.
- Hickman County (rural): math 20% / reading 23% proficiency, ranked #107 of 139 in TN (top 77%) — low school quality limits family demand, transient renter base, plan for 1-2y turnover.
- Zoned schools: East Hickman Elementary (446 students, 0% FRL); East Hickman Middle School (math 7% / reading 16%, grade F, #247 of 333 statewide, top 75%, 385 students, 0% FRL); East Hickman High School (math 2% / reading 22%, grade F, #259 of 332 statewide, top 79%, 468 students, 0% FRL) — zoned schools average 0% FRL vs 54% district-wide (54 pts lower); this property's tenant base skews higher-income than the district average.
- Market conditions: 62 active listings in the ZIP; 121 units permitted in Hickman County in 2024 (0 in 5+ unit buildings).
Forward outlook
- Local home prices are declining (-2.6%/yr); year-one equity from $1k of loan paydown is wiped out by about $6k of value loss. Plan a longer hold.
- Hickman County population projected at -14% by 2050 — secular population decline; favor cash flow + early exit over multi-decade hold.
Negotiation context
- Only 3 days on market — expect competitive offers; lowballing is unlikely to land.
- Current owner paid $20k; list at $208k implies a 940% gain — meaningful room to come down on a strong offer.
Risks & watch-outs
- Watch-outs: flood insurance adds $66/mo.
- Climate carrying-cost: severe flood risk; extreme-heat days projected 7→19/yr by 2055 (HVAC capex compounding) — expect insurance premiums to compound above CPI over the hold.
Questions for the listing agent
- What do current leases actually rent for vs. the listed asking? Can we see a recent rent roll and the last 12 months of T-12 income?
- What's the actual annual flood-insurance premium (NFIP or private), and is the property in a SFHA with mandatory coverage?
- Is there a deadline driving the sale (1031 exchange, divorce, estate, relocation)? That informs how much negotiation room exists.
- Schools are D-rated, which usually means shorter tenancies and higher turnover. Who's the typical renter profile here, and what's been the actual vacancy rate?
- The area grade is low — what's the realistic commute time and amenity access for the typical tenant pool here? Any planned neighborhood developments (good or bad) we should know about?
- What's the average days-on-market for RENTAL listings here right now (not sales)? A rising rental-DOM trend means longer vacancies and softer asking-rent achievability than the comps imply.
- What's the recent tenant-quality profile in this submarket — average credit score on applications, eviction rate, late-payment / NSF rate, and stable-employment percentage? A property-management company in the area should have these aggregated.
- How much new for-sale + rental construction is in the pipeline within 1–3 miles? Heavy new supply typically softens prices + rents 12–24 months out; constrained supply supports both.
Investment metrics
- 1% rule
- 0.61% ✗
- Cap rate
- 4.94%
- Cash-on-cash
- -4.84%
- DSCR
- 0.78
- GRM
- 13.8
CMA / ARV
No comps found within radius.
Projected returns pro-forma
-2.65% appreciation · 3.0% rent growth · sell at horizon
- IRR
- -24.3%
- Equity multiple
- 0.14×
- Total profit
- $-49,967
- Equity at exit
- $34,218
- IRR
- -19.5%
- Equity multiple
- -0.13×
- Total profit
- $-65,921
- Equity at exit
- $23,537
Cash invested: $58,240 (down + closing). Projections, not guarantees.
Landlord ↔ Tenant lean methodology
- Overall (STATE)
- 87 Strongly Landlord-Friendly
- State Tennessee
- 87 Strongly Landlord-Friendly · R+13
- County
- — inherits STATE
- City
- — inherits STATE
ZIP-level market 37025
- Home prices YoY
- -0.7%
- Active inventory
- 62
- Price-to-rent
- 13.8×
Monthly cashflow live
- Estimated rent
- $1,259 medium interval (Pro) →
- Mortgage (P&I)
- −$1,091
- Tax from tax record
- −$52 /mo · $624/yr
- Insurance
- −$87
- Flood insurance flood zone
- −$66 /mo · $798/yr
- HOA
- −$0
- Lot rent leased land?
- −$0
- Vacancy / Maint / Mgmt
- −$264
- Net cashflow
- $-302
Break-even live
Sensitivity live
| Price | -10% $-184 | -5% $-243 | +0% $-302 | +5% $-360 | +10% $-419 |
|---|---|---|---|---|---|
| Rent | -10% $-401 | -5% $-351 | +0% $-302 | +5% $-252 | +10% $-202 |
| Rate | -1.0pp $-197 | -0.5pp $-249 | base $-302 | +0.5pp $-355 | +1.0pp $-410 |
UW: 25.0% down · 7.5% · 30yr · 1.5% tax · 5.0% vac · 8.0% maint · 8.0% mgmt
Financing live
Cash to close
- Down payment
- $52,000
- Closing costs
- $6,240
- Reserves months
- —
- Total cash needed
- —
Loan-product check · same deal, 3 products live
Conventional
25% down · 7.5% · 30yr
- Down + closing
- —
- Monthly P&I
- —
- Monthly cashflow
- —
- DSCR
- —
- Eligible?
- —
Personal DTI + credit; lowest rate.
DSCR
20% down · 8.5% · 30yr
- Down + closing
- —
- Monthly P&I
- —
- Monthly cashflow
- —
- DSCR
- —
- Eligible?
- —
No personal income docs; deal must DSCR.
Hard money
10% down · 12.0% · 12mo
- Down + closing
- —
- Monthly P&I
- —
- Monthly cashflow
- —
- DSCR
- —
- Eligible?
- —
Short-term bridge; refi at stabilization.
Listing history 3 events
-
2026-06-22days on market $208,000 Active 3 DOM
-
2026-06-21remarks 302-char remark
-
2026-06-21$208,000 Active 2 DOM
ⓘ Source: listings_history table (triggers on properties + properties_extension) + one-shot
backfill from property_details.listing_events for pre-trigger history.
Tax reassessment forecast TN · Resets to sale price
- Current annual tax
- $624 · $52/mo
- Projected year-2 tax
- $1,477 · $123/mo
- Expected delta
- +$853/yr (+$71/mo · 136.7%)
ⓘ Screening estimate from a state-policy table — verify with the county assessor before closing.
Climate risk First Street
- Flood 8/10 Severe FEMA zone X (unshaded) · 99% chance over 30 yrs
- Wildfire 3/10 Moderate
- Heat 5/10 Major 7 d/yr ≥108°F today · 19 d/yr by 30 yrs out
- Wind 4/10 Moderate 12% chance of damaging wind over 30 yrs
- Air quality 2/10 Low 1 unhealthy d/yr today · 1 by 30 yrs out
Nearby sold comps map
Loading sold comps map…
Walkable amenities ~0.75 mi
Loading nearby amenities…
Taxation est. · year 1
- Rental income
- $15,104
- − Mortgage interest
- −$11,651
- − Property taxes
- −$624
- − Insurance
- −$1,838
- − Repairs & maintenance
- −$1,208
- − Management
- −$1,208
- − Depreciation
- −$6,051
- Taxable loss
- −$7,476
- Est. tax savings @ 24.0%
- +$1,794
- After-tax cash flow
- $-1,824/yr
For passive investors: Depreciation is non-cash, so a rental often shows a tax loss while cash-flowing — sheltering income. Rental losses are passive: they offset passive income freely, and up to $25,000/yr can offset ordinary (W-2) income if you actively participate and your MAGI is under $100k (phasing out to $0 by $150k); unused losses carry forward. On sale, claimed depreciation is recaptured at up to 25%, and gains may owe capital-gains tax (a 1031 exchange can defer both). Figures are a year-1 estimate at your 24.0% rate — not tax advice; consult a CPA.
Schools (NCES district)
- District
- Hickman County
- NCES district ID
- 4701860
- Math proficiency
- 20% ▼ -9.00%
- Reading proficiency
- 23% ▼ -6.00%
- Median HH income
- $39,457
- Composite
- 18.14/100
- National rank
- #8966
- State rank
- #107 of 139 in TN
Livability — Bon Aqua Junction
- Score
- 64/100
- State rank
- #162
- US rank
- #14050
Category grades
Schools grade is shown separately in the Schools card above.
Census & demographics
- Population (ZIP)
- 6,321
Population outlook (Hickman County) Hauer SSP2
- Today (2025)
- 23,337 people
- By 2030
- 22,650 · -2.9%
- By 2040
- 21,310 · -8.7%
- By 2050
- 19,972 · -14.4%
- By 2075
- 17,073 · -26.8%
- By 2100
- 14,630 · -37.3%
Race, ethnicity, and origin ACS 2023
- Neighborhood character
- Predominantly White (95%)
- Race & ethnicity
- White 95% Hispanic / Latino 3% Asian 1%
- Common ancestry
- Serbian 8% Italian 4% Slovak 4%
- Foreign-born
- 0%
- Languages at home
- 98% English-only · Spanish 1%
Political lean MEDSL · Hickman
- 2024 margin
- Solid R (+61.1) · D 19.1% · R 80.2%
- 2008→2024 swing
- -46.7pp toward R · 2008: -14.4pp · 2024: -61.1pp
- All cycles
- 2024: R+61.1 2020: R+55.4 2016: R+49.8 2012: R+27.2 2008: R+14.4
Not yet ingested
- Civics
- —
Market trends
- HPI YoY
- ▼ -2.65%
- Current HPI
- 359.6663
- Rent YoY
- —
- Metro
- —
- State GDP YoY
- ▲ 2.78%
- F500 in state
- 22
Industry mix (Fortune 500 HQ in TN)
| Industry | F500 HQs | Revenue |
|---|---|---|
| Healthcare | 3 | $91B |
|
||
| Retail | 3 | $72B |
|
||
| Transportation / Logistics | 1 | $88B |
|
||
| Paper / Packaging | 1 | $19B |
|
||
| Insurance | 1 | $13B |
|
||
| Energy | 1 | $12B |
|
||
Price history
+940.0% since first listed2 events — show timeline
- 2026-06-19 Listed $208,000 REALTRACS as Distributed by MLS Grid
- 1997-05-16 Sold (Public Records) $20,000 Public Records
Property tax history
+2.6%/yrLatest (2025): $624 · +3.5% YoY. Source: county tax records.
Cash-flow waterfall
monthlySold comps — $/sqft
last 12 mo · ≤1 miLoading sold comps…