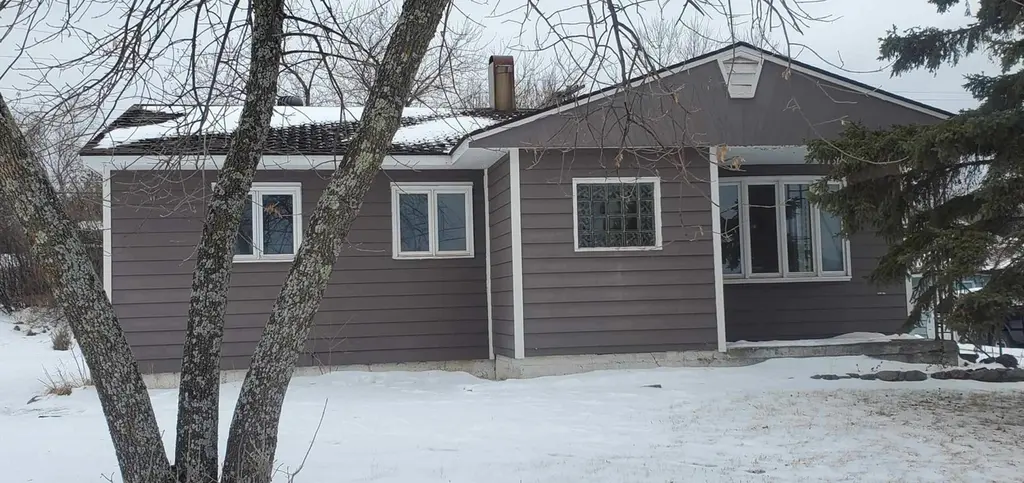
122 Banks Blvd · Silver Bay, MN
Flood risk 1/10 · Minimal
- FEMA flood zone
- —
- Chance of flooding over 30 yrs
- 0.0%
- Est. flood insurance / yr
- —
Fire risk 5/10 · Moderate
- Est. fire insurance / yr
- $888 – $1,650
Heat risk 1/10 · Minimal
- Hot days now (above 86°F)
- 7 days/yr
- Hot days in 30 yrs
- 14 days/yr
Wind risk 1/10 · Minimal
- Chance of severe wind over 30 yrs
- —
Air-quality risk 1/10 · Minimal
- Unhealthy air days now
- 0 days/yr
- Unhealthy air days in 30 yrs
- 0 days/yr
Risk factors via First Street. Map © Google.
Why this score? — see what drove the A- grade
The composite is a weighted blend of 9 inputs, each scored 0–100. Each bar is that input's sub-score; the figure is the points it added to the 100-point composite (weight × sub-score).
- Cash flow +29.2/30.0
- ARV discount +15.0/15.0
- DSCR +10.0/10.0
- Appreciation +10.0/10.0
- 1% rule +7.8/10.0
- Schools +3.8/10.0
- Livability +3.7/5.0
- Rent growth +2.5/5.0
- Condition / age +2.5/5.0
$75,000
🖨 Deal sheet 📄 Offer letter ✓ Due diligence
Listing remarks MLS
Wholesale purchase opportunity. Being sold AS IS, needs new roof and interior finishing.
Key facts
- 9,191 sq ft lot
- 2 garage spots
- Built 1954
Neighborhood map
What this means for you Summary
Snapshot
- This is a 2-bed/1.0-bath single-family listed at $75k.
Deal economics
- At list price, monthly cash flow is $261 ($3k/yr) — positive.
- The deal already cash-flows at list — no discount required.
- Meets the 1% rule at list price ($962 rent vs $75k).
- Recommended offer: $66k (12.0% below list) — sets the bar for market timing.
- Cap rate 10.5% vs local median 4.7% in Silver Bay — top-decile yield for the area; either an underpriced asset or a hidden risk that comps aren't pricing in. Stress-test before assuming the spread holds.
Location & tenants
- Location reads 74/100 on livability (#217 in MN, #4,547 nationally) — a middle-class / working-renter tenant base. Strengths: cost of living A+, housing A+, health & safety A+; Watch: amenities F, commute F.
- Lake Superior Public School District (rural): math 34% / reading 53% proficiency, ranked #191 of 301 in MN (top 64%) — families likely to look elsewhere, expect single-tenant / working-renter base with shorter leases.
- Market conditions: 66 active listings in the ZIP; 81 units permitted in Lake County in 2024 (0 in 5+ unit buildings).
Forward outlook
- In year one you build about $8k of equity ($519 loan paydown + $8k appreciation (10.0% local appreciation)).
- Lake County population projected at -26% by 2050 — secular population decline; favor cash flow + early exit over multi-decade hold.
- At projected returns (10.0% appreciation + 3.0% rent growth), your $21k cash investment doubles in ~2 years — after that, you're playing with house money.
- By year 5, paydown + projected appreciation supports a ~$37k cash-out refi (75% LTV) — recoverable capital for the next deal without selling this one.
Negotiation context
- It's been on market 131 days — a 12% lower offer ($66k) is reasonable based on typical stale-listing flexibility.
- 2 sale attempts; this cycle's ask has dropped $25k (25%) from the opening price — seller is motivated, your offer sets the floor, not the list.
Risks & watch-outs
- Watch-outs: built in 1954 — expect roof / HVAC / electrical / plumbing capex.
- Climate carrying-cost: moderate wildfire risk — expect insurance premiums to compound above CPI over the hold.
Questions for the listing agent
- It's been on market 131 days. Have you received any prior offers? Is the seller open to a 12% concession, seller financing, or rate buy-down credit?
- Built in 1954 — when were the roof, HVAC, electrical panel, plumbing, and water heater last replaced?
- Why hasn't it sold? Are there any deal-killer items the seller is aware of (foundation, flood, title, zoning, code violations)?
- Is there a deadline driving the sale (1031 exchange, divorce, estate, relocation)? That informs how much negotiation room exists.
- Schools are B-rated — typically a magnet for longer-tenancy family renters. What's the average tenant stay here, and is there a school-zone premium baked into asking?
- What's the average days-on-market for RENTAL listings here right now (not sales)? A rising rental-DOM trend means longer vacancies and softer asking-rent achievability than the comps imply.
- What's the recent tenant-quality profile in this submarket — average credit score on applications, eviction rate, late-payment / NSF rate, and stable-employment percentage? A property-management company in the area should have these aggregated.
- How much new for-sale + rental construction is in the pipeline within 1–3 miles? Heavy new supply typically softens prices + rents 12–24 months out; constrained supply supports both.
Investment metrics
- 1% rule
- 1.28% ✓
- Cap rate
- 10.47%
- Cash-on-cash
- 14.92%
- DSCR
- 1.66
- GRM
- 6.5
CMA / ARV
- ARV (median comp)
- $146,655
- List price
- $75,000
- Delta
- -48.86%
- Verdict
- UNDERPRICED
- Comps
- 20 within 1.0 mi
Show comp detail 12 sales within ~0.75 mi
| Address | Dist | Beds/Ba | Sqft | Sold | Price | $/sf | Match |
|---|---|---|---|---|---|---|---|
| 51 Davis Dr | 0.23mi | 3/1.0 (+1) | 864 (0%) | 3mo | $107,500 | $124 | 82 |
| 88 Banks Blvd | 0.27mi | 3/1.0 (+1) | 864 (0%) | 0mo | $105,000 | $122 | 82 |
| 12 Dodge Ln | 0.28mi | 2/1.0 | 864 (0%) | 18mo | $141,000 | $163 | 72 |
| 10 Drake Cr Cir | 0.32mi | 2/1.0 | 864 (0%) | 23mo | $150,000 | $174 | 66 |
| 31 Charles Cr Cir | 0.44mi | 2/1.0 | 864 (0%) | 18mo | $145,000 | $168 | 64 |
| 33 Charles Crk | 0.42mi | 3/1.0 (+1) | 864 (0%) | 14mo | $145,000 | $168 | 63 |
| 66 Banks Blvd | 0.48mi | 2/1.0 | 768 (-11%) | 4mo | $117,000 | $152 | 56 |
| 100 Edison Blvd | 0.49mi | 3/1.0 (+1) | 960 (+11%) | 3mo | $135,000 | $141 | 51 |
| 52 Burk Dr | 0.68mi | 3/1.0 (+1) | 864 (0%) | 23mo | $153,000 | $177 | 44 |
| 42 Banks Blvd | 0.68mi | 3/1.0 (+1) | 900 (+4%) | 20mo | $163,900 | $182 | 39 |
| 27 James Rd | 0.66mi | 3/2.0 (+1) | 960 (+11%) | 8mo | $130,000 | $135 | 35 |
| 77 Hays Crk | 0.66mi | 3/1.0 (+1) | 960 (+11%) | 20mo | $230,000 | $240 | 29 |
Match score weights: distance 35% · size 25% · config 20% · recency 20%. Top-matched comps best support the ARV.
Projected returns pro-forma
10.0% appreciation · 3.0% rent growth · sell at horizon
- IRR
- 35.3%
- Equity multiple
- 3.74×
- Total profit
- $57,476
- Equity at exit
- $67,566
- IRR
- 30.4%
- Equity multiple
- 8.44×
- Total profit
- $156,187
- Equity at exit
- $145,709
Cash invested: $21,000 (down + closing). Projections, not guarantees.
Landlord ↔ Tenant lean methodology
- Overall (STATE)
- 46 Balanced
- State Minnesota
- 46 Balanced · D+2
- County
- — inherits STATE
- City
- — inherits STATE
ZIP-level market 55614
- Home prices YoY
- 11.9%
- Active inventory
- 66
- Price-to-rent
- 6.5×
Monthly cashflow live
- Estimated rent
- $962 medium interval (Pro) →
- Mortgage (P&I)
- −$393
- Tax from tax record
- −$74 /mo · $894/yr
- Insurance
- −$31
- HOA
- −$0
- Vacancy / Maint / Mgmt
- −$202
- Net cashflow
- $261
Break-even live
UW: 25.0% down · 7.5% · 30yr · 1.5% tax · 5.0% vac · 8.0% maint · 8.0% mgmt
Financing live
Cash to close
- Down payment
- $18,750
- Closing costs
- $2,250
- Reserves months
- —
- Total cash needed
- —
Loan-product check · same deal, 3 products live
Conventional
25% down · 7.5% · 30yr
- Down + closing
- —
- Monthly P&I
- —
- Monthly cashflow
- —
- DSCR
- —
- Eligible?
- —
Personal DTI + credit; lowest rate.
DSCR
20% down · 8.5% · 30yr
- Down + closing
- —
- Monthly P&I
- —
- Monthly cashflow
- —
- DSCR
- —
- Eligible?
- —
No personal income docs; deal must DSCR.
Hard money
10% down · 12.0% · 12mo
- Down + closing
- —
- Monthly P&I
- —
- Monthly cashflow
- —
- DSCR
- —
- Eligible?
- —
Short-term bridge; refi at stabilization.
Listing history 22 events
-
2026-06-18days on market $75,000 Active 131 DOM
-
2026-06-17days on market $75,000 Active 130 DOM
-
2026-06-16days on market $75,000 Active 129 DOM
-
2026-06-15price $75,000 Active 128 DOM
-
2026-06-15days on market $79,900 Active 128 DOM
-
2026-06-14days on market $79,900 Active 126 DOM
-
2026-06-13days on market $79,900 Active 125 DOM
-
2026-06-10pricedays on market $79,900 Active 123 DOM
-
2026-06-09days on market $84,900 Active 122 DOM
-
2026-06-08days on market $84,900 Active 121 DOM
-
2026-06-07days on market $84,900 Active 120 DOM
-
2026-06-02days on market $84,900 Active 115 DOM
-
2026-06-01days on market $84,900 Active 114 DOM
-
2026-05-31days on market $84,900 Active 113 DOM
-
2026-05-30days on market $84,900 Active 112 DOM
-
2026-05-13price $88,900 88-char remark
Show marketing remark (88 chars)
Wholesale purchase opportunity. Being sold AS IS, needs new roof and interior finishing.
-
2026-04-24price $91,900 88-char remark
Show marketing remark (88 chars)
Wholesale purchase opportunity. Being sold AS IS, needs new roof and interior finishing.
-
2026-04-03price $99,000 88-char remark
Show marketing remark (88 chars)
Wholesale purchase opportunity. Being sold AS IS, needs new roof and interior finishing.
-
2026-02-06$99,900 Active 88-char remark
Show marketing remark (88 chars)
Wholesale purchase opportunity. Being sold AS IS, needs new roof and interior finishing.
-
2026-02-05historical
-
2026-01-14price $99,900
-
2025-12-05$109,900 Active
ⓘ Source: listings_history table (triggers on properties + properties_extension) + one-shot
backfill from property_details.listing_events for pre-trigger history.
Tax reassessment forecast MN · Partial reset (capped growth)
- Current annual tax
- $894 · $74/mo
- Projected year-2 tax
- $894 · $74/mo
- Expected delta
- $0/yr ($0/mo · 0.0%)
ⓘ Screening estimate from a state-policy table — verify with the county assessor before closing.
Climate risk First Street
- Flood 1/10 Low 0% chance over 30 yrs
- Wildfire 5/10 Major
- Heat 1/10 Low 7 d/yr ≥86°F today · 14 d/yr by 30 yrs out
- Wind 1/10 Low
- Air quality 1/10 Low 0 unhealthy d/yr today · 0 by 30 yrs out
Nearby sold comps map
Loading sold comps map…
Walkable amenities ~0.75 mi
Loading nearby amenities…
Taxation est. · year 1
- Rental income
- $11,545
- − Mortgage interest
- −$4,201
- − Property taxes
- −$894
- − Insurance
- −$375
- − Repairs & maintenance
- −$924
- − Management
- −$924
- − Depreciation
- −$2,182
- Taxable income
- $2,046
- Est. tax owed @ 24.0%
- −$491
- After-tax cash flow
- $2,641/yr
For passive investors: Depreciation is non-cash, so a rental often shows a tax loss while cash-flowing — sheltering income. Rental losses are passive: they offset passive income freely, and up to $25,000/yr can offset ordinary (W-2) income if you actively participate and your MAGI is under $100k (phasing out to $0 by $150k); unused losses carry forward. On sale, claimed depreciation is recaptured at up to 25%, and gains may owe capital-gains tax (a 1031 exchange can defer both). Figures are a year-1 estimate at your 24.0% rate — not tax advice; consult a CPA.
Schools (NCES district)
- District
- Lake Superior Public School District
- NCES district ID
- 2740740
- Math proficiency
- 34% ▼ -24.00%
- Reading proficiency
- 53% ▼ -9.00%
- Median HH income
- $51,958
- Composite
- 37.51/100
- National rank
- #4399
- State rank
- #191 of 301 in MN
Livability — Silver Bay
- Score
- 74/100
- State rank
- #217
- US rank
- #4547
Category grades
Schools grade is shown separately in the Schools card above.
Census & demographics
- Census place
- Silver Bay, MN
- Population (ZIP)
- 2,450
Population outlook (Lake County) Hauer SSP2
- Today (2025)
- 9,943 people
- By 2030
- 9,437 · -5.1%
- By 2040
- 8,326 · -16.3%
- By 2050
- 7,365 · -25.9%
- By 2075
- 6,008 · -39.6%
- By 2100
- 5,038 · -49.3%
Race, ethnicity, and origin ACS 2023
- Neighborhood character
- Predominantly White (91%)
- Race & ethnicity
- White 91% Two or more races 7% Hispanic / Latino 2%
- Common ancestry
- Portuguese 21% Lithuanian 2% Scottish 2%
- Foreign-born
- 1% · Vietnam
- Languages at home
- 98% English-only · Other Indo-European 1%
Political lean MEDSL · Lake
- 2024 margin
- Toss-up / Even · D 51.0% · R 47.1% · Other 1.9%
- 2008→2024 swing
- -18.2pp toward R · 2008: 22.1pp · 2024: 3.9pp
- All cycles
- 2024: D+3.9 2020: D+3.5 2016: D+2.2 2012: D+21.1 2008: D+22.1
Not yet ingested
- Civics
- —
Market trends
- HPI YoY
- ▲ 52.26%
- Current HPI
- 490.17
- Rent YoY
- —
- Metro
- —
- State GDP YoY
- ▲ 2.41%
- F500 in state
- 34
Industry mix (Fortune 500 HQ in MN)
| Industry | F500 HQs | Revenue |
|---|---|---|
| Healthcare | 2 | $407B |
|
||
| Retail | 2 | $150B |
|
||
| Consumer Goods | 2 | $32B |
|
||
| Industrial Machinery | 2 | $6B |
|
||
| Agriculture | 1 | $40B |
|
||
| Healthcare / Medical Devices | 1 | $32B |
|
||
Price history
-19.1% since first listed7 events — show timeline
- 2026-05-13 Price Changed $88,900 NORTHSTARMLS as Distributed by MLS Grid
- 2026-04-24 Price Changed $91,900 NORTHSTARMLS as Distributed by MLS Grid
- 2026-04-03 Price Changed $99,000 NORTHSTARMLS as Distributed by MLS Grid
- 2026-02-06 Listed $99,900 NORTHSTARMLS as Distributed by MLS Grid
- 2026-02-05 Listing Removed — NORTHSTARMLS as Distributed by MLS Grid
- 2026-01-14 Price Changed $99,900 NORTHSTARMLS as Distributed by MLS Grid
- 2025-12-05 Listed $109,900 NORTHSTARMLS as Distributed by MLS Grid
Property tax history
+3.8%/yrLatest (2025): $894 · +182.7% YoY. Source: county tax records.
Cash-flow waterfall
monthlySold comps — $/sqft
last 12 mo · ≤1 miLoading sold comps…