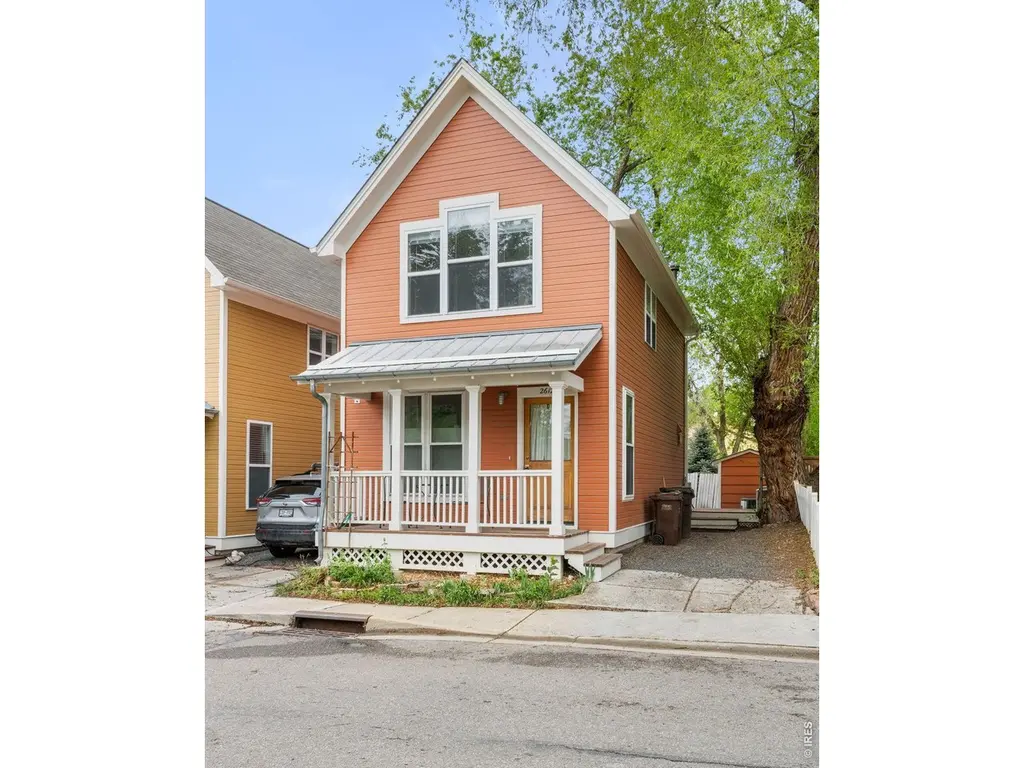
2612 Thornbird Pl · Boulder, CO
Flood risk 6/10 · Moderate
- FEMA flood zone
- X (shaded)
- Chance of flooding over 30 yrs
- 0.71%
- Est. flood insurance / yr
- $507 – $1,088
Fire risk 4/10 · Minor
- Est. fire insurance / yr
- $939 – $1,743
Heat risk 3/10 · Minor
- Hot days now (above 92°F)
- 7 days/yr
- Hot days in 30 yrs
- 17 days/yr
Wind risk 1/10 · Minimal
- Chance of severe wind over 30 yrs
- —
Air-quality risk 2/10 · Minimal
- Unhealthy air days now
- 2 days/yr
- Unhealthy air days in 30 yrs
- 2 days/yr
Risk factors via First Street. Map © Google.
Why this score? — see what drove the C grade
The composite is a weighted blend of 9 inputs, each scored 0–100. Each bar is that input's sub-score; the figure is the points it added to the 100-point composite (weight × sub-score).
- Cash flow +16.8/30.0
- ARV discount +15.0/15.0
- DSCR +5.2/10.0
- Schools +5.1/10.0
- 1% rule +4.1/10.0
- Livability +3.9/5.0
- Rent growth +3.0/5.0
- Condition / age +2.5/5.0
- Appreciation +0.0/10.0
$278,070
🖨 Deal sheet 📄 Offer letter ✓ Due diligence
Listing remarks
IMPORTANT - This home is part of the Boulder Regional Affordable Homeownership Program. For more information, please visit www. BoulderColorado. gov. Tucked into the award-winning Iris Hollow community in Boulder, 2612 Thornbird Place offers an exceptional blend of comfort, convenience, and the vibrant Boulder lifestyle. Built by Coburn Homes, this thoughtfully designed 2-bedroom, 1-bath residence delivers quality craftsmanship and an efficient, inviting layout. Step inside to find a light-filled interior with an open-concept living and dining space that flows seamlessly into the kitchen, perfect for everyday living and entertaining. Wood floors run throughout the home, enhancing its warmth
Key facts
- Wood floors
- Nearby parks
- Scenic bike paths
Tags
Property features AI
Finance
- Other: Zoned: AFFORDABLE
- HOA & community: Iris Hollow Master HOA; Monthly association fee of $125; Association transfer fee required; Association has reserves; Community park
Exterior
- Parking: Off-street parking; 1 garage space
- Utilities: City water (meter installed); Natural gas available (Xcel); Electricity available; Trash service by Western Disposal
- Home design: Single family residence; Two levels; Residential property; Not new (previously owned)
- Construction: Frame construction; Composition siding; Composition roof
- Exterior features: Deck; Partial fencing; 500-year floodplain or B/X rating
Interior
- Kitchen: Electric range; Refrigerator; Disposal
- Bedrooms: 2 bedrooms (all bedrooms conform)
- Flooring: Wood
- Bathrooms: 1 full bathroom
- Heating & cooling: Forced air heating; Central air conditioning
- Interior features: Open floorplan; Window coverings; Fire alarm
- Laundry & utility: Washer; Dryer
Neighborhood map
What this means for you Summary
Snapshot
- This is a 2-bed/1.5-bath single-family listed at $278k.
Deal economics
- At list price, monthly cash flow is $180 ($2k/yr) — positive.
- The deal already cash-flows at list — no discount required.
- To meet the 1% rule (rent ≥ 1% of price), the offer needs to be $254k (8.5% below list).
- Recommended offer: $254k (8.5% below list) — sets the bar for 1% rule.
- Cap rate 7.1% vs local median 1.7% in Boulder — top-decile yield for the area; either an underpriced asset or a hidden risk that comps aren't pricing in. Stress-test before assuming the spread holds.
Location & tenants
- Location reads 77/100 on livability (#24 in CO, #2,958 nationally) — a middle-class / working-renter tenant base. Strengths: amenities A+, commute A+, health & safety A+; Watch: crime D+, cost of living F.
- Boulder Valley School District No. Re2 (urban): math 49% / reading 67% proficiency, ranked #6 of 86 in CO (top 7%) — acceptable for families but not a draw, mixed tenant base, ~2y average lease; only 16% free/reduced lunch — higher-income household profile.
- Zoned schools: Columbine Elementary School (math 15% / reading 32%, grade F, #634 of 966 statewide, top 67%, 405 students, 64% FRL); Boulder High School (math 64% / reading 81%, grade B+, #18 of 381 statewide, top 4%, 2,074 students, 28% FRL) — zoned schools average 46% FRL vs 16% district-wide (30 pts higher); higher-poverty schools than district average — tighter screening recommended.
- Market conditions: Rents rising (+1.8%/yr); 256 active listings in the ZIP; 40 comparable units currently listed for rent nearby; rentals at typical pace (median 21d on market — plan ~3-4 weeks tenant-placement turnaround); high-income renter base; 1,688 units permitted in Boulder County in 2024 (1,136 in 5+ unit buildings).
Forward outlook
- Local home prices are declining (-3.0%/yr); year-one equity from $2k of loan paydown is wiped out by about $8k of value loss. Plan a longer hold.
- Boulder County population projected at +40% by 2050 — long-run rental-demand tailwind backs the buy-and-hold thesis.
Negotiation context
- It's been on market 36 days — a 3% lower offer ($270k) is reasonable based on typical stale-listing flexibility.
- 3 sale attempts since 28y ago with the ask held roughly flat each time — persistent listings suggest the price (not the market) is what's stuck; bring a comps-based counter.
- Current owner paid $166k; list at $278k implies a 68% gain — meaningful room to come down on a strong offer.
Risks & watch-outs
- Climate carrying-cost: major flood risk — expect insurance premiums to compound above CPI over the hold.
Questions for the listing agent
- It's been on market 36 days. Have you received any prior offers? Is the seller open to a 9% concession, seller financing, or rate buy-down credit?
- What does the HOA fee cover, when was the last increase, and are there any pending special assessments or reserve-fund shortfalls?
- Is there a deadline driving the sale (1031 exchange, divorce, estate, relocation)? That informs how much negotiation room exists.
- Schools are B-rated — typically a magnet for longer-tenancy family renters. What's the average tenant stay here, and is there a school-zone premium baked into asking?
- Crime grade is D in this area — have there been break-ins, vandalism, or insurance claims at this property in the last 3 years? What carrier currently insures it and at what premium?
- What's the average days-on-market for RENTAL listings here right now (not sales)? A rising rental-DOM trend means longer vacancies and softer asking-rent achievability than the comps imply.
- What's the recent tenant-quality profile in this submarket — average credit score on applications, eviction rate, late-payment / NSF rate, and stable-employment percentage? A property-management company in the area should have these aggregated.
- How much new for-sale + rental construction is in the pipeline within 1–3 miles? Heavy new supply typically softens prices + rents 12–24 months out; constrained supply supports both.
Investment metrics
- 1% rule
- 0.91% ✗
- Cap rate
- 7.07%
- Cash-on-cash
- 2.77%
- DSCR
- 1.12
- GRM
- 9.1
CMA / ARV
- ARV (on-the-fly)
- $348,192
- Comps found
- 12
Show comp detail 12 sales within ~0.75 mi
| Address | Dist | Beds/Ba | Sqft | Sold | Price | $/sf | Match |
|---|---|---|---|---|---|---|---|
| 2800 Kalmia Ave Unit C-103 | 0.34mi | 2/2.0 | 880 (+2%) | 1mo | $334,500 | $380 | 78 |
| 2800 Kalmia Ave Unit A310 | 0.40mi | 2/2.0 | 880 (+2%) | 0mo | $368,000 | $418 | 76 |
| 2800 Kalmia Ave Unit A306 | 0.40mi | 2/2.0 | 880 (+2%) | 2mo | $355,000 | $403 | 75 |
| 3565 28th St #201 | 0.39mi | 2/2.0 | 830 (-4%) | 2mo | $400,000 | $482 | 72 |
| 3565 28th St #305 | 0.39mi | 2/2.0 | 830 (-4%) | 4mo | $330,000 | $398 | 70 |
| 2800 Kalmia Ave Unit A-206 | 0.40mi | 2/2.0 | 920 (+6%) | 0mo | $290,000 | $315 | 68 |
| 3055 30th St Unit 4A | 0.54mi | 2/2.0 | 886 (+2%) | 2mo | $415,000 | $468 | 67 |
| 2800 Kalmia Ave #320 | 0.42mi | 2/2.0 | 902 (+4%) | 12mo | $370,000 | $410 | 61 |
| 3335 Chisholm Trl #202 | 0.57mi | 2/1.5 | 963 (+12%) | 0mo | $255,000 | $265 | 54 |
| 3390 34th St Unit B | 0.74mi | 2/1.0 | 882 (+2%) | 13mo | $452,500 | $513 | 49 |
| 3120 Corona Trl Unit L-301 | 0.56mi | 2/1.5 | 988 (+14%) | 4mo | $269,200 | $272 | 47 |
| 3335 Chisholm Trl #206 | 0.57mi | 2/1.0 | 947 (+10%) | 13mo | $375,000 | $396 | 44 |
Match score weights: distance 35% · size 25% · config 20% · recency 20%. Top-matched comps best support the ARV.
Projected returns pro-forma
-3.0% appreciation · 1.82% rent growth · sell at horizon
- IRR
- -13.2%
- Equity multiple
- 0.53×
- Total profit
- $-36,619
- Equity at exit
- $41,461
- IRR
- -6.1%
- Equity multiple
- 0.63×
- Total profit
- $-29,187
- Equity at exit
- $24,042
Cash invested: $77,860 (down + closing). Projections, not guarantees.
Landlord ↔ Tenant lean methodology
- Overall (STATE)
- 38 Tenant-Leaning
- State Colorado
- 38 Tenant-Leaning · D+4
- County
- — inherits STATE
- City
- — inherits STATE
ZIP-level market 80304
- Rents YoY
- 1.8%
- Active inventory
- 256
- Price-to-rent
- 9.1×
Monthly cashflow live
- Estimated rent
- $2,543 high interval (Pro) →
- Mortgage (P&I)
- −$1,458
- Tax from tax record
- −$131 /mo · $1,567/yr
- Insurance
- −$116
- HOA
- −$125
- Vacancy / Maint / Mgmt
- −$534
- Net cashflow
- $180
Break-even live
UW: 25.0% down · 7.5% · 30yr · 1.5% tax · 5.0% vac · 8.0% maint · 8.0% mgmt
Financing live
Cash to close
- Down payment
- $69,518
- Closing costs
- $8,342
- Reserves months
- —
- Total cash needed
- —
Loan-product check · same deal, 3 products live
Conventional
25% down · 7.5% · 30yr
- Down + closing
- —
- Monthly P&I
- —
- Monthly cashflow
- —
- DSCR
- —
- Eligible?
- —
Personal DTI + credit; lowest rate.
DSCR
20% down · 8.5% · 30yr
- Down + closing
- —
- Monthly P&I
- —
- Monthly cashflow
- —
- DSCR
- —
- Eligible?
- —
No personal income docs; deal must DSCR.
Hard money
10% down · 12.0% · 12mo
- Down + closing
- —
- Monthly P&I
- —
- Monthly cashflow
- —
- DSCR
- —
- Eligible?
- —
Short-term bridge; refi at stabilization.
Rent comps 40 comps
| Address | Beds | Baths | Sqft | Rent | $/sqft | DOM | Units | Dist |
|---|---|---|---|---|---|---|---|---|
| 2625 Tabriz Pl Boulder, CO | 3.0 | 1.0 | 1097 | $3,600 | $3.28 | 20d | 1 | 0.06mi |
| 2606 Juniper Ave Unit 34-1 Boulder, CO | 1.0 | 1.0 | 548 | $1,325 | $2.42 | 13d | 1 | 0.13mi |
| 2747 Glenwood Ct Boulder, CO | 2.0 | 1.5 | 1000 | $1,850 | $1.85 | 13d | 1 | 0.13mi |
| 2820 Hibiscus AVE Boulder, CO | 3.0 | 1.0–2.5 | 1010 | $3,678 | $3.64 | 13d | 91 | 0.24mi |
| 3487 28th St #21 Boulder, CO | 2.0 | 1.5 | 936 | $2,600 | $2.78 | 20d | 1 | 0.26mi |
| 3545 28th St #308 Boulder, CO | 2.0 | 2.0 | 838 | $2,950 | $3.52 | 20d | 1 | 0.31mi |
| 2707 Valmont Rd Boulder, CO | 1.0–2.0 | 1.0 | 684 | $2,200 | $3.22 | 20d | 6 | 0.37mi |
| 2800 Kalmia Ave Boulder, CO | 2.0 | 1.5–2.0 | 880 | $2,150 | $2.44 | 20d | 2 | 0.39mi |
| 2995 Glenwood Dr Boulder, CO | 1.0–2.0 | 1.0–1.5 | 807 | $2,136 | $2.65 | 13d | 17 | 0.42mi |
| 2850 Kalmia Ave Boulder, CO | 1.0–2.0 | 1.0–2.0 | 850 | $2,795 | $3.29 | 13d | 4 | 0.44mi |
| 2995 Eagle Way Boulder, CO | 2.0 | 1.0–1.5 | 639 | $1,845 | $2.89 | 20d | 1 | 0.48mi |
| 2727 Folsom St Unit 1 Boulder, CO | 2.0 | 1.0 | 708 | $2,295 | $3.24 | 13d | 1 | 0.50mi |
| 3725 Birchwood Dr #23 Boulder, CO | 2.0 | 1.5 | 1114 | $2,295 | $2.06 | 20d | 1 | 0.53mi |
| 3120 Corona Trl #209 Boulder, CO | 2.0 | 2.0 | 966 | $2,650 | $2.74 | 20d | 1 | 0.54mi |
| 3150 Iris Ave Unit F309 Boulder, CO | 1.0 | 1.0 | 676 | $1,595 | $2.36 | 20d | 1 | 0.54mi |
| 3315 Chisholm Trl Unit 1546453P Boulder, CO | 2.0 | 1.0 | 861 | $2,639 | $3.07 | 13d | 1 | 0.57mi |
| 3485 Hayden Pl Unit 3 Boulder, CO | 2.0 | 1.5 | 785 | $2,495 | $3.18 | 20d | 1 | 0.74mi |
| 3303 Bluff St Boulder, CO | 3.0 | 1.0–2.5 | 1131 | $3,789 | $3.35 | 13d | 38 | 0.80mi |
| 2530 Junction Pl Boulder, CO | 1.0–3.0 | 1.0–3.5 | 1204 | $3,416 | $2.84 | 13d | 69 | 0.82mi |
| 2437 Spruce St Boulder, CO | 2.0 | 1.0 | 750 | $1,900 | $2.53 | 20d | 1 | 0.86mi |
| 2445 19th St Boulder, CO | 1.0 | 1.0 | 800 | $2,000 | $2.50 | 20d | 1 | 0.91mi |
| 3000 Pearl Pkwy Boulder, CO | 2.0 | 1.0–2.0 | 1249 | $3,936 | $3.15 | 13d | 19 | 0.95mi |
| 3100 Pearl St Boulder, CO | 2.0 | 1.0–2.0 | 849 | $3,875 | $4.56 | 13d | 23 | 0.98mi |
| 1245 Elder Ave Boulder, CO | 1.0–2.0 | 1.0–2.0 | 670 | $2,100 | $3.13 | 13d | 4 | 1.06mi |
| 1850 Folsom St Boulder, CO | 1.0–2.0 | 1.0–2.0 | 1069 | $2,650 | $2.48 | 20d | 2 | 1.08mi |
| 1850 Folsom St Boulder, CO | 1.0–2.0 | 1.0–2.0 | 1228 | $2,650 | $2.16 | 13d | 2 | 1.08mi |
| 1250 Elder Ave Boulder, CO | 2.0 | 1.0 | 765 | $1,600 | $2.09 | 20d | 1 | 1.09mi |
| 3715 Canfield St Boulder, CO | 2.0 | 1.0–2.0 | 827 | $2,576 | $3.11 | 13d | 24 | 1.10mi |
| 2113 Walnut St Unit 9B Boulder, CO | 2.0 | 2.0 | 900 | $4,295 | $4.77 | 20d | 1 | 1.11mi |
| 1805 Spruce St Apt C Boulder, CO | 1.0 | 1.0 | 550 | $2,250 | $4.09 | 20d | 1 | 1.12mi |
| 1853 26th St Boulder, CO | 1.0–3.0 | 1.0–3.0 | 957 | $2,678 | $2.80 | 13d | 21 | 1.13mi |
| 1833 Folsom St Boulder, CO | 1.0–2.0 | 1.0 | 782 | $2,055 | $2.63 | 20d | 7 | 1.15mi |
| 3073 Fulton Cir Boulder, CO | 2.0 | 1.5 | 1032 | $2,403 | $2.33 | 13d | 1 | 1.15mi |
| 1830 22nd St #15 Boulder, CO | 2.0 | 2.0 | 905 | $2,500 | $2.76 | 20d | 1 | 1.16mi |
| 1811 Folsom St Boulder, CO | 1.0 | 1.0 | 450 | $1,595 | $3.54 | 13d | 9 | 1.18mi |
| 2000 Walnut St Boulder, CO | 2.0 | 1.0–1.5 | 637 | $2,399 | $3.76 | 20d | 13 | 1.18mi |
| 1823 22nd St Boulder, CO | 1.0 | 1.0 | 550 | $1,615 | $2.94 | 20d | 4 | 1.19mi |
| 2845 Broadway Unit 308 Boulder, CO | 2.0 | 2.0 | 900 | $1,895 | $2.11 | 20d | 1 | 1.20mi |
| 1821 22nd St Boulder, CO | 1.0–2.0 | 1.0 | 538 | $1,700 | $3.16 | 13d | 5 | 1.21mi |
| 2121 Canyon Blvd Boulder, CO | 2.0 | 1.0 | 687 | $2,549 | $3.71 | 13d | 13 | 1.21mi |
HOA detail
- Monthly dues
- $125 · $1,500/yr
Listing history 23 events
-
2026-06-17status $278,070 Pending 36 DOM
-
2026-06-17days on market $278,070 Active 36 DOM
-
2026-06-16days on market $278,070 Active 35 DOM
-
2026-06-15days on market $278,070 Active 34 DOM
-
2026-06-14days on market $278,070 Active 32 DOM
-
2026-06-13days on market $278,070 Active 31 DOM
-
2026-06-10days on market $278,070 Active 29 DOM
-
2026-06-09days on market $278,070 Active 28 DOM
-
2026-06-09days on market $278,070 Active 27 DOM
-
2026-06-07days on market $278,070 Active 26 DOM
-
2026-06-05days on market $278,070 Active 23 DOM
-
2026-06-03days on market $278,070 Active 22 DOM
-
2026-06-02days on market $278,070 Active 21 DOM
-
2026-06-01days on market $278,070 Active 20 DOM
-
2026-05-31days on market $278,070 Active 19 DOM
-
2026-05-30days on market $278,070 Active 18 DOM
-
2026-05-01$278,070 Active
-
2001-09-25soldstatus $165,900
-
2001-08-31soldstatus $171,000
-
2001-07-16$170,973
-
1999-02-23soldstatus $145,000
-
1999-02-19soldstatus $145,000
-
1998-11-10$145,000
ⓘ Source: listings_history table (triggers on properties + properties_extension) + one-shot
backfill from property_details.listing_events for pre-trigger history.
Tax reassessment forecast CO · Resets to sale price
- Current annual tax
- $1,567 · $131/mo
- Projected year-2 tax
- $1,567 · $131/mo
- Expected delta
- $0/yr ($0/mo · 0.0%)
ⓘ Screening estimate from a state-policy table — verify with the county assessor before closing.
Climate risk First Street
- Flood 6/10 Major FEMA zone X (shaded) · 71% chance over 30 yrs
- Wildfire 4/10 Moderate
- Heat 3/10 Moderate 7 d/yr ≥92°F today · 17 d/yr by 30 yrs out
- Wind 1/10 Low
- Air quality 2/10 Low 2 unhealthy d/yr today · 2 by 30 yrs out
Nearby sold comps map
Loading sold comps map…
Walkable amenities ~0.75 mi
Loading nearby amenities…
Taxation est. · year 1
- Rental income
- $30,522
- − Mortgage interest
- −$15,576
- − Property taxes
- −$1,567
- − Insurance
- −$1,390
- − Repairs & maintenance
- −$2,442
- − Management
- −$2,442
- − HOA
- −$1,500
- − Depreciation
- −$8,089
- Taxable loss
- −$2,485
- Est. tax savings @ 24.0%
- +$596
- After-tax cash flow
- $2,752/yr
For passive investors: Depreciation is non-cash, so a rental often shows a tax loss while cash-flowing — sheltering income. Rental losses are passive: they offset passive income freely, and up to $25,000/yr can offset ordinary (W-2) income if you actively participate and your MAGI is under $100k (phasing out to $0 by $150k); unused losses carry forward. On sale, claimed depreciation is recaptured at up to 25%, and gains may owe capital-gains tax (a 1031 exchange can defer both). Figures are a year-1 estimate at your 24.0% rate — not tax advice; consult a CPA.
Schools (NCES district)
- District
- Boulder Valley School District No. Re2
- NCES district ID
- 0802490
- Math proficiency
- 49% ▼ -3.00%
- Reading proficiency
- 67% ▲ 4.00%
- Median HH income
- $70,395
- Composite
- 51.3/100
- National rank
- #1747
- State rank
- #6 of 86 in CO
Livability — Boulder
- Score
- 77/100
- State rank
- #24
- US rank
- #2958
Category grades
Schools grade is shown separately in the Schools card above.
Census & demographics
- Census place
- Boulder, CO
- County
- Boulder County · 271,666 people
- City population
- 121,246
- Metro
- Boulder, CO
- Population (ZIP)
- 25,383
- Household income
- $126,558
- Rent vs Own
- Severe rent burden
- 891.0
Population outlook (Boulder County) Hauer SSP2
- Today (2025)
- 380,833 people
- By 2030
- 412,028 · +8.2%
- By 2040
- 472,764 · +24.1%
- By 2050
- 532,029 · +39.7%
- By 2075
- 679,723 · +78.5%
- By 2100
- 766,278 · +101.2%
Race, ethnicity, and origin ACS 2023
- Neighborhood character
- Predominantly White (76%)
- Race & ethnicity
- White 76% Hispanic / Latino 16% Two or more races 10% Asian 3%
- Hispanic origin (detail)
- Mexican 11%
- Common ancestry
- Italian 4% Romanian 4% Slovak 3%
- Foreign-born
- 12% · Canada, China, Jamaica
- Languages at home
- 84% English-only · Spanish 9% Other Indo-European 2% German/W. Germanic 1%
Political lean MEDSL · Boulder
- 2024 margin
- Solid D (+55.8) · D 76.5% · R 20.8% · Other 2.7%
- 2008→2024 swing
- +9.6pp toward D · 2008: 46.1pp · 2024: 55.8pp
- All cycles
- 2024: D+55.8 2020: D+56.6 2016: D+48.6 2012: D+41.5 2008: D+46.1
Not yet ingested
- Civics
- —
Market trends
- HPI YoY
- ▼ -1111.31%
- Current HPI
- 324.6478
- Rent YoY
- ▲ 1.82%
- Metro
- Boulder, CO
- State GDP YoY
- ▲ 1.95%
- F500 in state
- 14
Industry mix (Fortune 500 HQ in CO)
| Industry | F500 HQs | Revenue |
|---|---|---|
| Technology Distribution | 1 | $31B |
|
||
| Food / Agriculture | 1 | $18B |
|
||
| Packaging | 1 | $14B |
|
||
| Healthcare | 1 | $13B |
|
||
| Energy | 1 | $10B |
|
||
| Technology | 1 | $4B |
|
||
Price history
+91.8% since first listed7 events — show timeline
- 2026-05-01 Listed $278,070 IRES
- 2001-09-25 Sold (MLS) $165,900 IRES
- 2001-08-31 Sold (Public Records) $171,000 Public Records
- 2001-07-16 Listed $170,973 IRES
- 1999-02-23 Sold (Public Records) $145,000 Public Records
- 1999-02-19 Sold (MLS) $145,000 IRES
- 1998-11-10 Listed $145,000 IRES
Property tax history
+2.0%/yrLatest (2025): $1,567 · +34.9% YoY. Source: county tax records.
Cash-flow waterfall
monthlySold comps — $/sqft
last 12 mo · ≤1 miLoading sold comps…