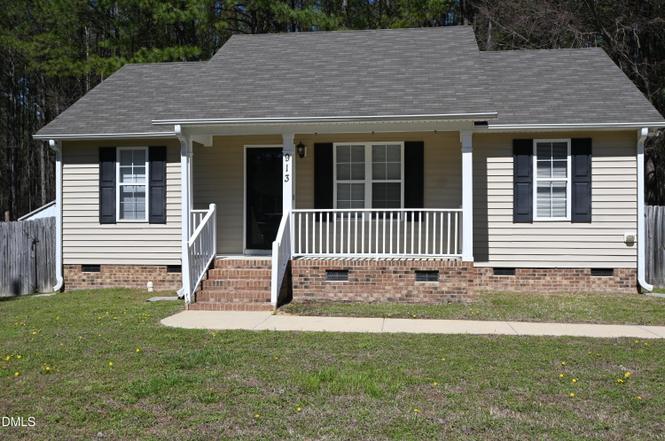
913 Amber Acres Ln · Wendell, NC
Flood risk 1/10 · Minimal
- FEMA flood zone
- X (unshaded)
- Chance of flooding over 30 yrs
- 0.0%
- Est. flood insurance / yr
- $507 – $1,088
Fire risk 2/10 · Minimal
- Est. fire insurance / yr
- $906 – $1,684
Heat risk 6/10 · Moderate
- Hot days now (above 105°F)
- 7 days/yr
- Hot days in 30 yrs
- 17 days/yr
Wind risk 6/10 · Moderate
- Chance of severe wind over 30 yrs
- 61.0%
Air-quality risk 3/10 · Minor
- Unhealthy air days now
- 2 days/yr
- Unhealthy air days in 30 yrs
- 3 days/yr
Risk factors via First Street. Map © Google.
Why this score? — see what drove the D grade
The composite is a weighted blend of 9 inputs, each scored 0–100. Each bar is that input's sub-score; the figure is the points it added to the 100-point composite (weight × sub-score).
- Cash flow +12.4/30.0
- ARV discount +10.7/15.0
- Schools +4.9/10.0
- Livability +3.9/5.0
- DSCR +3.7/10.0
- 1% rule +2.8/10.0
- Condition / age +2.5/5.0
- Rent growth +2.1/5.0
- Appreciation +0.0/10.0
$259,000
🖨 Deal sheet 📄 Offer letter ✓ Due diligence
Listing remarks MLS
Beautiful home in knightdale.
Key facts
- Fenced back yard
- Garden area
- Patio for dining
Tags
Property features AI
Finance
- Other: Lot approximately 0.23 acres; Private maintained road; Zoning: GR8
- HOA & community: Homeowners association (Bishop Pointe) with annual fee; Association provides storage amenity
Exterior
- Parking: Open parking; Concrete parking surface
- Utilities: Public sewer; Water available and connected; Sewer available and connected; Electricity available; Cable available
- Home design: Single-story house; Site-built construction; Shingle roof
- Construction: Vinyl siding
- Exterior features: Patio; Porch; Fenced yard (back yard); Private yard; Storage (including on-site storage structure); Other exterior storage
Interior
- Kitchen: Dishwasher; Electric oven; Microwave; Exhaust fan
- Bedrooms: 3 bedrooms (all on the main level)
- Flooring: Laminate
- Bathrooms: 2 full bathrooms
- Heating & cooling: Central heating (forced air); Central air; Heat pump; Electric cooling
- Interior features: Eat-in kitchen; Pantry; Walk-in closet(s); Blinds; Level flooring
- Laundry & utility: Washer hookup; Electric dryer hookup; Laundry located in kitchen; Electric water heater
Neighborhood map
What this means for you Summary
Snapshot
- This is a 3-bed/2.0-bath single-family listed at $259k.
Deal economics
- At list price, monthly cash flow is $-43 ($-514/yr) — negative.
- To cash-flow at today's rent, offer at most $251k (2.9% below list).
- To meet the 1% rule (rent ≥ 1% of price), the offer needs to be $202k (22.2% below list).
- Recommended offer: $202k (22.2% below list) — sets the bar for 1% rule.
- Cap rate 6.1% vs local median 3.7% in Wendell — top-decile yield for the area; either an underpriced asset or a hidden risk that comps aren't pricing in. Stress-test before assuming the spread holds.
Location & tenants
- Location reads 78/100 on livability (#25 in NC, #2,391 nationally) — a middle-class / working-renter tenant base. Strengths: housing A+, health & safety A+, crime A; Watch: amenities D.
- Wake County Schools (suburban): math 52% / reading 60% proficiency, ranked #35 of 178 in NC (top 20%) — acceptable for families but not a draw, mixed tenant base, ~2y average lease.
- Zoned schools: Lake Myra Elementary (math 23% / reading 35%, grade F, #1,007 of 1,410 statewide, top 72%, 648 students, 55% FRL); Wendell Middle (math 21% / reading 39%, grade F, #335 of 475 statewide, top 72%, 719 students, 68% FRL); East Wake High (math 51% / reading 44%, grade D, #331 of 535 statewide, top 62%, 1,646 students, 62% FRL) — zoned schools average 62% FRL vs 30% district-wide (31 pts higher); higher-poverty schools than district average — tighter screening recommended.
- Zoned-school proficiency averages 36% at this address vs 56% district-wide (-20 pts) — the specific schools serving this property underperform the Wake County Schools average; the district grade overstates school quality for this exact location.
- Market conditions: Rents soft (-1.4%/yr); 399 active listings in the ZIP; 8 comparable units currently listed for rent nearby; rentals at typical pace (median 21d on market — plan ~3-4 weeks tenant-placement turnaround); solid renter incomes; 15,249 units permitted in Wake County in 2024 (5,568 in 5+ unit buildings).
Forward outlook
- Local home prices are declining (-3.0%/yr); year-one equity from $2k of loan paydown is wiped out by about $8k of value loss. Plan a longer hold.
- Wake County population projected at +51% by 2050 — long-run rental-demand tailwind backs the buy-and-hold thesis.
Negotiation context
- It's been on market 97 days — a 9% lower offer ($236k) is reasonable based on typical stale-listing flexibility.
- 3 sale attempts since 16y ago; this cycle's ask has dropped $18k (6%) from the opening price — seller is motivated, your offer sets the floor, not the list.
- Current owner paid $170k; list at $259k implies a 52% gain — meaningful room to come down on a strong offer.
Risks & watch-outs
- Climate carrying-cost: major wind risk, 61% chance of damaging wind over 30y; extreme-heat days projected 7→17/yr by 2055 (HVAC capex compounding) — expect insurance premiums to compound above CPI over the hold.
Questions for the listing agent
- What do current leases actually rent for vs. the listed asking? Can we see a recent rent roll and the last 12 months of T-12 income?
- It's been on market 97 days. Have you received any prior offers? Is the seller open to a 22% concession, seller financing, or rate buy-down credit?
- What does the HOA fee cover, when was the last increase, and are there any pending special assessments or reserve-fund shortfalls?
- Why hasn't it sold? Are there any deal-killer items the seller is aware of (foundation, flood, title, zoning, code violations)?
- Is there a deadline driving the sale (1031 exchange, divorce, estate, relocation)? That informs how much negotiation room exists.
- Schools are D-rated, which usually means shorter tenancies and higher turnover. Who's the typical renter profile here, and what's been the actual vacancy rate?
- The area grade is low — what's the realistic commute time and amenity access for the typical tenant pool here? Any planned neighborhood developments (good or bad) we should know about?
- What's the average days-on-market for RENTAL listings here right now (not sales)? A rising rental-DOM trend means longer vacancies and softer asking-rent achievability than the comps imply.
- What's the recent tenant-quality profile in this submarket — average credit score on applications, eviction rate, late-payment / NSF rate, and stable-employment percentage? A property-management company in the area should have these aggregated.
- How much new for-sale + rental construction is in the pipeline within 1–3 miles? Heavy new supply typically softens prices + rents 12–24 months out; constrained supply supports both.
Investment metrics
- 1% rule
- 0.78% ✗
- Cap rate
- 6.09%
- Cash-on-cash
- -0.71%
- DSCR
- 0.97
- GRM
- 10.7
CMA / ARV
- ARV (on-the-fly)
- $278,850
- Comps found
- 2
Show comp detail 2 sales within ~0.75 mi
| Address | Dist | Beds/Ba | Sqft | Sold | Price | $/sf | Match |
|---|---|---|---|---|---|---|---|
| 2001 Ballston Pl | 0.37mi | 3/2.0 | 1,018 (+0%) | 12mo | $280,000 | $275 | 73 |
| 5717 Woof Pl | 0.31mi | 3/2.0 | 1,032 (+2%) | 14mo | $280,000 | $271 | 72 |
Match score weights: distance 35% · size 25% · config 20% · recency 20%. Top-matched comps best support the ARV.
Projected returns pro-forma
-3.0% appreciation · 0.0% rent growth · sell at horizon
- IRR
- -20.6%
- Equity multiple
- 0.30×
- Total profit
- $-50,670
- Equity at exit
- $38,618
- IRR
- -21.6%
- Equity multiple
- 0.02×
- Total profit
- $-70,724
- Equity at exit
- $22,394
Cash invested: $72,520 (down + closing). Projections, not guarantees.
Landlord ↔ Tenant lean methodology
- Overall (STATE)
- 85 Strongly Landlord-Friendly
- State North Carolina
- 85 Strongly Landlord-Friendly · R+3
- County
- — inherits STATE
- City
- — inherits STATE
ZIP-level market 27545
- Home prices YoY
- -33.1%
- Rents YoY
- -1.4%
- Active inventory
- 399
- Price-to-rent
- 10.7×
Monthly cashflow live
- Estimated rent
- $2,015 high interval (Pro) →
- Mortgage (P&I)
- −$1,358
- Tax from tax record
- −$155 /mo · $1,855/yr
- Insurance
- −$108
- HOA
- −$14
- Vacancy / Maint / Mgmt
- −$423
- Net cashflow
- $-43
Break-even live
UW: 25.0% down · 7.5% · 30yr · 1.5% tax · 5.0% vac · 8.0% maint · 8.0% mgmt
Financing live
Cash to close
- Down payment
- $64,750
- Closing costs
- $7,770
- Reserves months
- —
- Total cash needed
- —
Loan-product check · same deal, 3 products live
Conventional
25% down · 7.5% · 30yr
- Down + closing
- —
- Monthly P&I
- —
- Monthly cashflow
- —
- DSCR
- —
- Eligible?
- —
Personal DTI + credit; lowest rate.
DSCR
20% down · 8.5% · 30yr
- Down + closing
- —
- Monthly P&I
- —
- Monthly cashflow
- —
- DSCR
- —
- Eligible?
- —
No personal income docs; deal must DSCR.
Hard money
10% down · 12.0% · 12mo
- Down + closing
- —
- Monthly P&I
- —
- Monthly cashflow
- —
- DSCR
- —
- Eligible?
- —
Short-term bridge; refi at stabilization.
Rent comps 8 comps
| Address | Beds | Baths | Sqft | Rent | $/sqft | DOM | Units | Dist |
|---|---|---|---|---|---|---|---|---|
| 1112 Amber Acres Ln Knightdale, NC | 3.0 | 2.0 | 950 | $2,000 | $2.11 | 23d | 1 | 0.22mi |
| 1005 Henchman Ct Knightdale, NC | 3.0 | 2.0 | 1295 | $1,995 | $1.54 | 2d | 1 | 0.46mi |
| 5809 Taylor Rd Wendell, NC | 1.0–3.0 | 1.0–2.0 | 1109 | $2,134 | $1.92 | 1d | 12 | 0.76mi |
| 207 Meadow Run Knightdale, NC | 3.0 | 1.5 | 1138 | $1,800 | $1.58 | 23d | 1 | 0.93mi |
| 3301 Renee Ct Knightdale, NC | 3.0 | 2.0 | 1283 | $1,920 | $1.50 | 21d | 1 | 1.00mi |
| 621 Glen Manor Trl Knightdale, NC | 1.0–3.0 | 1.0–2.0 | 1062 | $2,100 | $1.98 | 1d | 16 | 1.44mi |
| 5169 Parkerwood Dr Knightdale, NC | 3.0 | 2.0 | 1186 | $1,829 | $1.54 | 4d | 1 | 1.46mi |
| 5141 Limewood St Knightdale, NC | 3.0 | 2.0 | 1230 | $1,525 | $1.24 | 23d | 1 | 1.49mi |
HOA detail
- Monthly dues
- $14 · $168/yr
Listing history 24 events
-
2026-06-18days on market $259,000 Active 97 DOM
-
2026-06-17days on market $259,000 Active 96 DOM
-
2026-06-16days on market $259,000 Active 95 DOM
-
2026-06-15days on market $259,000 Active 94 DOM
-
2026-06-13days on market $259,000 Active 92 DOM
-
2026-06-13pricedays on market $259,000 Active 91 DOM
-
2026-06-09days on market $267,000 Active 88 DOM
-
2026-06-08days on market $267,000 Active 87 DOM
-
2026-06-07days on market $267,000 Active 86 DOM
-
2026-06-05days on market $267,000 Active 83 DOM
-
2026-06-03days on market $267,000 Active 82 DOM
-
2026-06-02days on market $267,000 Active 81 DOM
-
2026-06-01days on market $267,000 Active 80 DOM
-
2026-05-31days on market $267,000 Active 79 DOM
-
2026-04-25price $267,000
-
2026-03-13$277,000 Active
-
2019-08-20soldstatus $170,000 Closed 29-char remark
Show marketing remark (29 chars)
Beautiful home in knightdale.
-
2019-08-20soldstatus $170,000
Show marketing remark (29 chars)
Beautiful home in knightdale.
-
2019-07-12status Pending 29-char remark
Show marketing remark (29 chars)
Beautiful home in knightdale.
-
2019-07-12$170,000 Active 29-char remark
Show marketing remark (29 chars)
Beautiful home in knightdale.
-
2011-02-25soldstatus $70,000 385-char remark
Show marketing remark (385 chars)
The seller requires any buyer requiring financing to complete a pre-approval loan application with Nationstar Mortgage. Information on loan products and other lender related questions see agent only remarks. SomThe price is right on this home. .. great neighborhood in Knightdale. Functional ranch with 3 bedrooms/2 full baths/front porch and back patio. Bring your offer, don't delay.
-
2011-01-25historical 385-char remark
Show marketing remark (385 chars)
The seller requires any buyer requiring financing to complete a pre-approval loan application with Nationstar Mortgage. Information on loan products and other lender related questions see agent only remarks. SomThe price is right on this home. .. great neighborhood in Knightdale. Functional ranch with 3 bedrooms/2 full baths/front porch and back patio. Bring your offer, don't delay.
-
2010-12-03$74,900 385-char remark
Show marketing remark (385 chars)
The seller requires any buyer requiring financing to complete a pre-approval loan application with Nationstar Mortgage. Information on loan products and other lender related questions see agent only remarks. SomThe price is right on this home. .. great neighborhood in Knightdale. Functional ranch with 3 bedrooms/2 full baths/front porch and back patio. Bring your offer, don't delay.
-
2006-12-21soldstatus $114,000
ⓘ Source: listings_history table (triggers on properties + properties_extension) + one-shot
backfill from property_details.listing_events for pre-trigger history.
Tax reassessment forecast NC · Resets to sale price
- Current annual tax
- $1,855 · $155/mo
- Projected year-2 tax
- $2,124 · $177/mo
- Expected delta
- +$268/yr (+$22/mo · 14.5%)
ⓘ Screening estimate from a state-policy table — verify with the county assessor before closing.
Climate risk First Street
- Flood 1/10 Low FEMA zone X (unshaded) · 0% chance over 30 yrs
- Wildfire 2/10 Low
- Heat 6/10 Major 7 d/yr ≥105°F today · 17 d/yr by 30 yrs out
- Wind 6/10 Major 61% chance of damaging wind over 30 yrs
- Air quality 3/10 Moderate 2 unhealthy d/yr today · 3 by 30 yrs out
Nearby sold comps map
Loading sold comps map…
Walkable amenities ~0.75 mi
Loading nearby amenities…
Taxation est. · year 1
- Rental income
- $24,180
- − Mortgage interest
- −$14,508
- − Property taxes
- −$1,855
- − Insurance
- −$1,295
- − Repairs & maintenance
- −$1,934
- − Management
- −$1,934
- − HOA
- −$168
- − Depreciation
- −$7,535
- Taxable loss
- −$5,049
- Est. tax savings @ 24.0%
- +$1,212
- After-tax cash flow
- $697/yr
For passive investors: Depreciation is non-cash, so a rental often shows a tax loss while cash-flowing — sheltering income. Rental losses are passive: they offset passive income freely, and up to $25,000/yr can offset ordinary (W-2) income if you actively participate and your MAGI is under $100k (phasing out to $0 by $150k); unused losses carry forward. On sale, claimed depreciation is recaptured at up to 25%, and gains may owe capital-gains tax (a 1031 exchange can defer both). Figures are a year-1 estimate at your 24.0% rate — not tax advice; consult a CPA.
Schools (NCES district)
- District
- Wake County Schools
- NCES district ID
- 3704720
- Math proficiency
- 52% ▲ 2.00%
- Reading proficiency
- 60% ▲ 4.00%
- Median HH income
- $67,509
- Composite
- 49.41/100
- National rank
- #2010
- State rank
- #35 of 178 in NC
Livability — Wendell
- Score
- 78/100
- State rank
- #25
- US rank
- #2391
Category grades
Schools grade is shown separately in the Schools card above.
Census & demographics
- County
- Wake County · 1,216,256 people
- City population
- 29,838
- Metro
- Raleigh-Cary, NC
- Population (ZIP)
- 34,163
- Household income
- $91,527
- Rent vs Own
- Severe rent burden
- 637.0
Population outlook (Wake County) Hauer SSP2
- Today (2025)
- 1,293,152 people
- By 2030
- 1,428,223 · +10.4%
- By 2040
- 1,698,188 · +31.3%
- By 2050
- 1,955,807 · +51.2%
- By 2075
- 2,520,273 · +94.9%
- By 2100
- 2,893,335 · +123.7%
Race, ethnicity, and origin ACS 2023
- Neighborhood character
- Highly diverse neighborhood (Simpson 0.70)
- Race & ethnicity
- Black 37% White 34% Hispanic / Latino 20% Two or more races 12% Asian 3%
- Hispanic origin (detail)
- Mexican 12% Dominican 2%
- Common ancestry
- Lithuanian 1% Romanian 1% Italian 1%
- Foreign-born
- 17% · Canada, Vietnam, Philippines
- Languages at home
- 77% English-only · Spanish 18% Other Indo-European 1% Other Asian/Pacific 1%
Political lean MEDSL · Wake
- 2024 margin
- Strong D (+25.5) · D 61.9% · R 36.4% · Other 1.7%
- 2008→2024 swing
- +11.1pp toward D · 2008: 14.4pp · 2024: 25.5pp
- All cycles
- 2024: D+25.5 2020: D+26.4 2016: D+20.5 2012: D+10.2 2008: D+14.4
Not yet ingested
- Civics
- —
Market trends
- HPI YoY
- ▼ -112.68%
- Current HPI
- 228.2131
- Rent YoY
- ▼ -1.44%
- Metro
- Raleigh-Cary, NC
- State GDP YoY
- ▲ 3.28%
- F500 in state
- 26
Industry mix (Fortune 500 HQ in NC)
| Industry | F500 HQs | Revenue |
|---|---|---|
| Financial Services | 2 | $213B |
|
||
| Retail | 2 | $95B |
|
||
| Industrial Conglomerate | 1 | $38B |
|
||
| Metals / Steel | 1 | $35B |
|
||
| Utilities | 1 | $30B |
|
||
| Industrial Machinery | 1 | $19B |
|
||
Price history
+134.2% since first listed10 events — show timeline
- 2026-04-25 Price Changed $267,000 TMLS
- 2026-03-13 Listed $277,000 TMLS
- 2019-08-20 Sold (Public Records) $170,000 Public Records
- 2019-08-20 Sold (MLS) $170,000 TMLS
- 2019-07-12 Pending — TMLS
- 2019-07-12 Listed $170,000 TMLS
- 2011-02-25 Sold (MLS) $70,000 TMLS
- 2011-01-25 Listing Removed — TMLS
- 2010-12-03 Listed $74,900 TMLS
- 2006-12-21 Sold (Public Records) $114,000 Public Records
Property tax history
+6.8%/yrLatest (2025): $1,855 · +3.0% YoY. Source: county tax records.
Cash-flow waterfall
monthlySold comps — $/sqft
last 12 mo · ≤1 miLoading sold comps…