 Multi-family
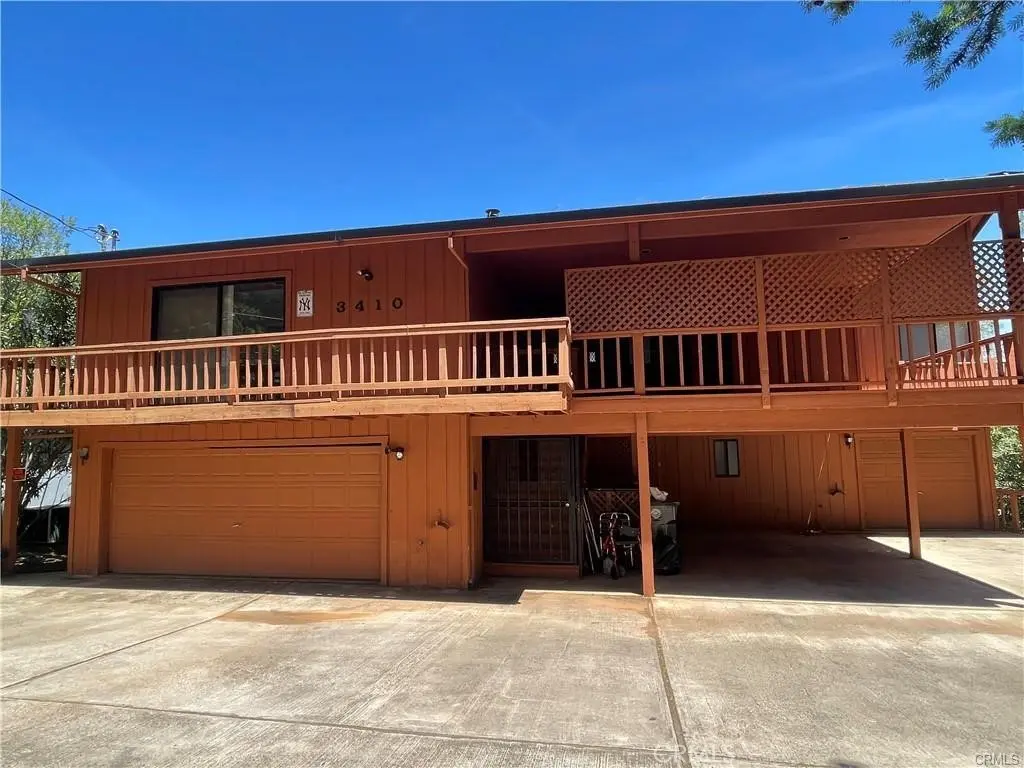
3410 Toyon Ct · Soda Bay, CA
Flood risk 1/10 · Minimal
- FEMA flood zone
- X (unshaded)
- Chance of flooding over 30 yrs
- 0.0%
- Est. flood insurance / yr
- $507 – $1,088
Fire risk 8/10 · Major
- Est. fire insurance / yr
- $659 – $1,223
Heat risk 6/10 · Moderate
- Hot days now (above 100°F)
- 8 days/yr
- Hot days in 30 yrs
- 17 days/yr
Wind risk 1/10 · Minimal
- Chance of severe wind over 30 yrs
- —
Air-quality risk 10/10 · Severe
- Unhealthy air days now
- 32 days/yr
- Unhealthy air days in 30 yrs
- 34 days/yr
Risk factors via First Street. Map © Google.
Why this score? — see what drove the C- grade
The composite is a weighted blend of 9 inputs, each scored 0–100. Each bar is that input's sub-score; the figure is the points it added to the 100-point composite (weight × sub-score).
- Cash flow +22.0/30.0
- ARV discount +7.5/15.0
- DSCR +7.0/10.0
- 1% rule +5.2/10.0
- Livability +3.0/5.0
- Rent growth +2.5/5.0
- Schools +2.5/10.0
- Condition / age +2.5/5.0
- Appreciation +0.0/10.0
$465,000
🖨 Deal sheet 📄 Offer letter ✓ Due diligence
Multi-family units
County records classify this as Multi-Family (2-4 Unit). Listing-text estimate: 1 unit. estimate disagrees with records
Listing remarks MLS
This tri-plex is an amazing investment opportunity! Located close to Konocti Resort and Spa this is prime real estate! First unit has 2 beds/2 full baths on the top floor with panoramic lake views. This unit has the most spacious open living area with large windows and multiple sliding doors that take you to an incredible deck!! Kitchen has some updates of new luxury vinyl flooring and a new stove. This unit also has an attached two car garage and a newer washing machine included! Unit #B has 2bed/2bath and 1 car attached garage. Plus there is a studio with full kitchen, bathroom and patio. Plenty of parking and a great location in a quiet cul-de-sac. Enjoy Riviera West's outstanding amenities including large, heated pool (pool for members only) recreation park, clubhouse overlooking the lake and a marina with boat ramp and lakeside picnic area.
Key facts
- Large windows
- Lake views
- Incredible deck
Tags
Property features AI
Finance
- Other: Community features: foothills, watersports, golf course, sidewalks, BLM/National Forest access, rural setting, preserve/public land, horse trails, hiking, fishing, riding/stables, storm drains, mountainous terrain, curbs, military land proximity, lake access, biking, gutters, park, ravine, hunting, dog park, street lighting; Zoning: R1; Directions: Riviera West to Toyon Ct.
- HOA & community: Part of the Riv West association; Association fee $323 annually; Association amenities include dock, pool, meeting room, barbecue and outdoor cooking area
Exterior
- Parking: Attached garage; Two garage spaces; Two parking spaces total
- Utilities: District/public water; Septic tank
- Home design: Triplex; Two-story; Entry level 1; Includes accessory dwelling units (2 ADUs)
- Construction: No common walls
- Exterior features: Front yard; Back yard; Association/community pool
Interior
- Kitchen: Kitchen included
- Bedrooms: Five bedrooms on the main level
- Bathrooms: Five full bathrooms
- Heating & cooling: Central furnace heating; Central cooling
- Interior features: Two levels; Street entry; Has view; Walk-in closet; Family room
- Laundry & utility: Washer hookup; Electric dryer hookup; Has laundry
Neighborhood map
What this means for you Summary
Snapshot
- This is a 2-bed/2.5-bath multifamily listed at $465k.
Deal economics
- At list price, monthly cash flow is $741 ($9k/yr) — positive.
- The deal already cash-flows at list — no discount required.
- Meets the 1% rule at list price ($5k rent vs $465k).
- Cap rate 8.2% vs local median 3.6% in Soda Bay — top-decile yield for the area; either an underpriced asset or a hidden risk that comps aren't pricing in. Stress-test before assuming the spread holds.
Location & tenants
- Location reads 60/100 on livability (#595 in CA) — a middle-class / working-renter tenant base. Strengths: employment A+, housing A+; Watch: health & safety C-, schools D-, crime F.
- Kelseyville Unified (town): math 18% / reading 33% proficiency, ranked #1,150 of 1,400 in CA (top 82%) — low school quality limits family demand, transient renter base, plan for 1-2y turnover; 68% free/reduced lunch — lower-income household profile, screen leases tightly.
- Market conditions: 268 active listings in the ZIP; 107 units permitted in Lake County in 2024 (40 in 5+ unit buildings).
- At $4,764/mo this rent would consume 91% of the median local household income ($63k/yr) (locally 194% of renters already pay >50% of income on rent) — very limited rent-growth headroom before tenants either downsize or default.
Forward outlook
- Local home prices are declining (-3.0%/yr); year-one equity from $3k of loan paydown is wiped out by about $14k of value loss. Plan a longer hold.
- Lake County population projected at -15% by 2050 — secular population decline; favor cash flow + early exit over multi-decade hold.
Negotiation context
- Only 14 days on market — expect competitive offers; lowballing is unlikely to land.
- 6 sale attempts since 20y ago with the ask held roughly flat each time — persistent listings suggest the price (not the market) is what's stuck; bring a comps-based counter.
Risks & watch-outs
- Climate carrying-cost: severe wildfire risk; extreme-heat days projected 8→17/yr by 2055 (HVAC capex compounding) — expect insurance premiums to compound above CPI over the hold.
Questions for the listing agent
- What does the HOA fee cover, when was the last increase, and are there any pending special assessments or reserve-fund shortfalls?
- Is there a deadline driving the sale (1031 exchange, divorce, estate, relocation)? That informs how much negotiation room exists.
- Schools are D-rated, which usually means shorter tenancies and higher turnover. Who's the typical renter profile here, and what's been the actual vacancy rate?
- Crime grade is F in this area — have there been break-ins, vandalism, or insurance claims at this property in the last 3 years? What carrier currently insures it and at what premium?
- What's the average days-on-market for RENTAL listings here right now (not sales)? A rising rental-DOM trend means longer vacancies and softer asking-rent achievability than the comps imply.
- What's the recent tenant-quality profile in this submarket — average credit score on applications, eviction rate, late-payment / NSF rate, and stable-employment percentage? A property-management company in the area should have these aggregated.
- How much new apartment / multifamily construction is in the pipeline within 1–3 miles? Heavy new supply (>2% of stock underway) typically softens rents 12–24 months out; light construction supports rent growth.
Investment metrics
- 1% rule
- 1.02% ✓
- Cap rate
- 8.21%
- Cash-on-cash
- 6.83%
- DSCR
- 1.30
- GRM
- 8.1
CMA / ARV
No comps found within radius.
Projected returns pro-forma
-3.0% appreciation · 3.0% rent growth · sell at horizon
- IRR
- -5.8%
- Equity multiple
- 0.78×
- Total profit
- $-28,170
- Equity at exit
- $69,333
- IRR
- 3.8%
- Equity multiple
- 1.28×
- Total profit
- $36,094
- Equity at exit
- $40,205
Cash invested: $130,200 (down + closing). Projections, not guarantees.
Landlord ↔ Tenant lean methodology
- Overall (STATE)
- 18 Strongly Tenant-Friendly
- State California
- 18 Strongly Tenant-Friendly · D+13
- County
- — inherits STATE
- City
- — inherits STATE
ZIP-level market 95451
- Active inventory
- 268
- Price-to-rent
- 23.3×
Monthly cashflow live
- Estimated rent
- $4,764 medium interval (Pro) →
- Mortgage (P&I)
- −$2,439
- Tax from tax record
- −$363 /mo · $4,354/yr
- Insurance
- −$194
- HOA
- −$27
- Vacancy / Maint / Mgmt
- −$1,000
- Net cashflow
- $741
Break-even live
3-unit breakdown (identical units grouped — click to expand)
| Units | Beds | Baths | Est. rent |
|---|---|---|---|
| 2× units | 2 | 1 | $3,330 |
| #1 | 2 | 1 | $1,665 |
| #2 | 2 | 1 | $1,665 |
| 1× unit | 1 | 1 | $1,433 |
| Total (3 units) | $4,764 | ||
UW: 25.0% down · 7.5% · 30yr · 1.5% tax · 5.0% vac · 8.0% maint · 8.0% mgmt
Financing live
Cash to close
- Down payment
- $116,250
- Closing costs
- $13,950
- Reserves months
- —
- Total cash needed
- —
Loan-product check · same deal, 3 products live
Conventional
25% down · 7.5% · 30yr
- Down + closing
- —
- Monthly P&I
- —
- Monthly cashflow
- —
- DSCR
- —
- Eligible?
- —
Personal DTI + credit; lowest rate.
DSCR
20% down · 8.5% · 30yr
- Down + closing
- —
- Monthly P&I
- —
- Monthly cashflow
- —
- DSCR
- —
- Eligible?
- —
No personal income docs; deal must DSCR.
Hard money
10% down · 12.0% · 12mo
- Down + closing
- —
- Monthly P&I
- —
- Monthly cashflow
- —
- DSCR
- —
- Eligible?
- —
Short-term bridge; refi at stabilization.
HOA detail
- Monthly dues
- $27 · $324/yr
- Likely covers
- pool
Listing history 12 events
-
2026-06-19days on market $465,000 Active 14 DOM
-
2026-06-18days on market $465,000 Active 13 DOM
-
2026-06-17days on market $465,000 Active 12 DOM
-
2026-06-16days on market $465,000 Active 11 DOM
-
2026-06-15days on market $465,000 Active 10 DOM
-
2026-06-14days on market $465,000 Active 8 DOM
-
2026-06-12days on market $465,000 Active 7 DOM
-
2026-06-09days on market $465,000 Active 4 DOM
-
2026-06-08days on market $465,000 Active 3 DOM
-
2026-06-07days on market $465,000 Active 2 DOM
-
2026-06-07remarks 699-char remark
-
2026-06-07$465,000 Active 1 DOM
ⓘ Source: listings_history table (triggers on properties + properties_extension) + one-shot
backfill from property_details.listing_events for pre-trigger history.
Tax reassessment forecast CA · Resets to sale price
- Current annual tax
- $4,354 · $363/mo
- Projected year-2 tax
- $4,354 · $363/mo
- Expected delta
- $0/yr ($0/mo · 0.0%)
ⓘ Screening estimate from a state-policy table — verify with the county assessor before closing.
Climate risk First Street
- Flood 1/10 Low FEMA zone X (unshaded) · 0% chance over 30 yrs
- Wildfire 8/10 Severe
- Heat 6/10 Major 8 d/yr ≥100°F today · 17 d/yr by 30 yrs out
- Wind 1/10 Low
- Air quality 10/10 Extreme 32 unhealthy d/yr today · 34 by 30 yrs out
Nearby sold comps map
Loading sold comps map…
Walkable amenities ~0.75 mi
Loading nearby amenities…
Taxation est. · year 1
- Rental income
- $57,168
- − Mortgage interest
- −$26,047
- − Property taxes
- −$4,354
- − Insurance
- −$2,325
- − Repairs & maintenance
- −$4,573
- − Management
- −$4,573
- − HOA
- −$324
- − Depreciation
- −$13,527
- Taxable income
- $1,444
- Est. tax owed @ 24.0%
- −$347
- After-tax cash flow
- $8,551/yr
For passive investors: Depreciation is non-cash, so a rental often shows a tax loss while cash-flowing — sheltering income. Rental losses are passive: they offset passive income freely, and up to $25,000/yr can offset ordinary (W-2) income if you actively participate and your MAGI is under $100k (phasing out to $0 by $150k); unused losses carry forward. On sale, claimed depreciation is recaptured at up to 25%, and gains may owe capital-gains tax (a 1031 exchange can defer both). Figures are a year-1 estimate at your 24.0% rate — not tax advice; consult a CPA.
Schools (NCES district)
- District
- Kelseyville Unified
- NCES district ID
- 0619320
- Math proficiency
- 18% ▼ -1.00%
- Reading proficiency
- 33% ▲ 4.00%
- Median HH income
- $47,210
- Composite
- 25.19/100
- National rank
- #12920
- State rank
- #1150 of 1400 in CA
Livability — Soda Bay
- Score
- 60/100
- State rank
- #595
- US rank
- #19239
Category grades
Schools grade is shown separately in the Schools card above.
Census & demographics
- County
- Lake County · 24,333 people
- Metro
- Clearlake, CA
- Population (ZIP)
- 12,592
- Household income
- $62,568
- Rent vs Own
- Severe rent burden
- 194.0
Population outlook (Lake County) Hauer SSP2
- Today (2025)
- 62,396 people
- By 2030
- 60,626 · -2.8%
- By 2040
- 56,453 · -9.5%
- By 2050
- 53,054 · -15.0%
- By 2075
- 47,663 · -23.6%
- By 2100
- 41,804 · -33.0%
Race, ethnicity, and origin ACS 2023
- Neighborhood character
- Majority White (57%)
- Race & ethnicity
- White 57% Hispanic / Latino 38% Two or more races 11% Black 1%
- Hispanic origin (detail)
- Mexican 35%
- Common ancestry
- Russian 3% Slovak 3% Italian 2%
- Foreign-born
- 14% · Canada
- Languages at home
- 71% English-only · Spanish 28% German/W. Germanic 1%
Political lean MEDSL · Lake
- 2024 margin
- Toss-up / Even · D 47.8% · R 49.2% · Other 3.0%
- 2008→2024 swing
- -20.6pp toward R · 2008: 19.3pp · 2024: -1.4pp
- All cycles
- 2024: R+1.4 2020: D+6.3 2016: D+3.7 2012: D+16.5 2008: D+19.3
Not yet ingested
- Civics
- —
Market trends
- HPI YoY
- ▼ -158.45%
- Current HPI
- 168.6995
- Rent YoY
- —
- Metro
- Clearlake, CA
- State GDP YoY
- ▲ 3.21%
- F500 in state
- 116
Industry mix (Fortune 500 HQ in CA)
| Industry | F500 HQs | Revenue |
|---|---|---|
| Technology | 27 | $1,492B |
|
||
| Financial Services | 3 | $174B |
|
||
| Retail | 3 | $44B |
|
||
| Insurance | 3 | $26B |
|
||
| Media / Entertainment | 2 | $115B |
|
||
| Pharmaceuticals / Biotech | 2 | $62B |
|
||
Price history
+57.6% since first listed22 events — show timeline
- 2026-06-05 Listed $465,000 CRMLS
- 2024-10-22 Sold (Public Records) $400,000 Public Records
- 2024-10-22 Sold (MLS) $415,000 CRMLS
- 2024-09-29 Pending — CRMLS
- 2024-09-27 Contingent — CRMLS
- 2024-07-10 Listed $475,000 CRMLS
- 2024-07-09 Listing Removed — CRMLS
- 2024-06-14 Price Changed $499,000 CRMLS
- 2024-05-29 Price Changed $499,900 BAREIS
- 2024-05-20 Price Changed $515,000 CRMLS
- 2024-05-17 Price Changed $514,900 BAREIS
- 2024-03-30 Price Changed $529,900 BAREIS
- 2024-03-30 Price Changed $529,000 CRMLS
- 2024-03-21 Listed $569,900 CRMLS
- 2024-02-22 Listed $569,900 BAREIS
- 2022-02-16 Sold (Public Records) $440,000 Public Records
- 2022-02-16 Sold (MLS) $440,000 CRMLS
- 2021-08-03 Contingent — CRMLS
- 2021-06-06 Listed $495,000 CRMLS
- 2006-10-01 Listing Removed — CRMLS
- 2006-05-04 Listed $635,000 CRMLS
- 2000-04-28 Sold (Public Records) $295,000 Public Records
Property tax history
+1.1%/yrLatest (2025): $4,354 · -12.7% YoY. Source: county tax records.
Cash-flow waterfall
monthlySold comps — $/sqft
last 12 mo · ≤1 miLoading sold comps…