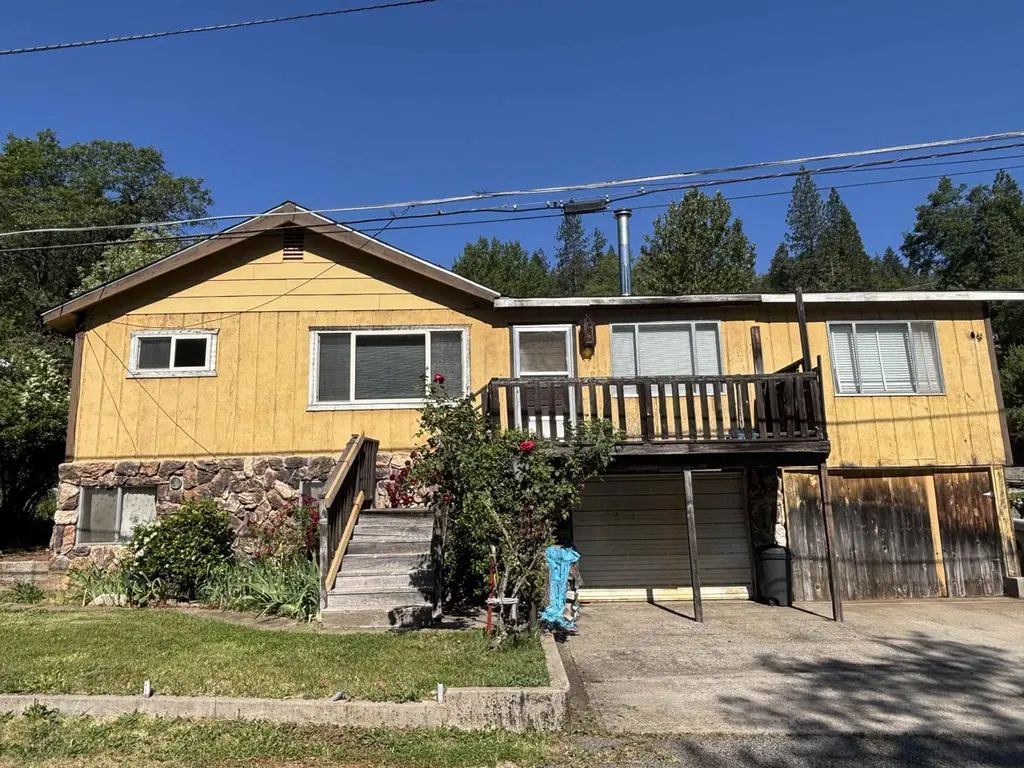
6435 S Francis St · Dunsmuir, CA
Flood risk 7/10 · Major
- FEMA flood zone
- X (unshaded)
- Chance of flooding over 30 yrs
- 0.78%
- Est. flood insurance / yr
- $507 – $1,088
Fire risk 7/10 · Major
- Est. fire insurance / yr
- $659 – $1,223
Heat risk 6/10 · Moderate
- Hot days now (above 95°F)
- 10 days/yr
- Hot days in 30 yrs
- 25 days/yr
Wind risk 1/10 · Minimal
- Chance of severe wind over 30 yrs
- —
Air-quality risk 10/10 · Severe
- Unhealthy air days now
- 51 days/yr
- Unhealthy air days in 30 yrs
- 52 days/yr
Risk factors via First Street. Map © Google.
Why this score? — see what drove the C grade
The composite is a weighted blend of 9 inputs, each scored 0–100. Each bar is that input's sub-score; the figure is the points it added to the 100-point composite (weight × sub-score).
- Cash flow +23.0/30.0
- ARV discount +11.0/15.0
- DSCR +7.4/10.0
- 1% rule +4.8/10.0
- Schools +4.1/10.0
- Livability +2.7/5.0
- Rent growth +2.5/5.0
- Condition / age +2.5/5.0
- Appreciation +0.0/10.0
$189,000
🖨 Deal sheet 📄 Offer letter ✓ Due diligence
Listing remarks
Fixer upper in Dunsmuir CA! Large home with 3 bedrooms 2 bathrooms and good bones. House is need of some repairs and updates but is a great opportunity to add value to this charming home in South Siskiyou County. With a large floorpan there is plenty of room to let the creative juices flow and bring this property back to life! Built in 1924, in a time when construction materials were made to last. Dunsmuir is home to the Sacramento River with multiple access points, Hedge Creek Falls, Mossbrae Falls, and some of the best fly fishing in the north state. Only 10-15 minutes to City of Mount Shasta, and 45 minutes to Redding the other direction, the location is tough to match! Live in a small r
Key facts
- Mossbrae falls
- Large floorpan
- Hedge creek falls
Tags
Property features AI
Exterior
- Parking: Attached garage (1 car); Concrete and paved parking
- Utilities: Public water; Propane
- Home design: Single-family residence; One story; Residential property
- Construction: Stone and wood siding exterior; Composition roof
- Exterior features: Garden; Deck; Sloped lot
Interior
- Kitchen: Cooktop; Electric oven
- Flooring: Carpet
- Heating & cooling: Baseboard heating; Wood stove
- Interior features: Living room fireplace
Neighborhood map
What this means for you Summary
Snapshot
- This is a 3-bed/2.0-bath single-family listed at $189k.
Deal economics
- At list price, monthly cash flow is $268 ($3k/yr) — positive.
- The deal already cash-flows at list — no discount required.
- To meet the 1% rule (rent ≥ 1% of price), the offer needs to be $186k (1.6% below list).
- Recommended offer: $183k (3.0% below list) — sets the bar for market timing.
- Cap rate 8.4% vs local median 3.8% in Dunsmuir — top-decile yield for the area; either an underpriced asset or a hidden risk that comps aren't pricing in. Stress-test before assuming the spread holds.
Location & tenants
- Location reads 53/100 on livability (#967 in CA) — a working-class tenant base; expect higher turnover. Strengths: housing A-; Watch: cost of living D+, schools D, crime F.
- Dunsmuir Joint Union High (rural): math 25% / reading 75% proficiency, ranked #163 of 517 in CA (top 32%) — acceptable for families but not a draw, mixed tenant base, ~2y average lease.
- Market conditions: 36 active listings in the ZIP; 50 units permitted in Siskiyou County in 2024 (0 in 5+ unit buildings).
Forward outlook
- Local home prices are declining (-3.0%/yr); year-one equity from $1k of loan paydown is wiped out by about $6k of value loss. Plan a longer hold.
- Siskiyou County population projected at -26% by 2050 — secular population decline; favor cash flow + early exit over multi-decade hold.
Negotiation context
- It's been on market 44 days — a 3% lower offer ($183k) is reasonable based on typical stale-listing flexibility.
Risks & watch-outs
- Watch-outs: flood insurance adds $66/mo; built in 1924 — expect roof / HVAC / electrical / plumbing capex.
- Climate carrying-cost: major flood risk; major wildfire risk; extreme-heat days projected 10→25/yr by 2055 (HVAC capex compounding) — expect insurance premiums to compound above CPI over the hold.
Questions for the listing agent
- It's been on market 44 days. Have you received any prior offers? Is the seller open to a 3% concession, seller financing, or rate buy-down credit?
- Built in 1924 — when were the roof, HVAC, electrical panel, plumbing, and water heater last replaced?
- What's the actual annual flood-insurance premium (NFIP or private), and is the property in a SFHA with mandatory coverage?
- Is there a deadline driving the sale (1031 exchange, divorce, estate, relocation)? That informs how much negotiation room exists.
- Schools are D-rated, which usually means shorter tenancies and higher turnover. Who's the typical renter profile here, and what's been the actual vacancy rate?
- Crime grade is F in this area — have there been break-ins, vandalism, or insurance claims at this property in the last 3 years? What carrier currently insures it and at what premium?
- What's the average days-on-market for RENTAL listings here right now (not sales)? A rising rental-DOM trend means longer vacancies and softer asking-rent achievability than the comps imply.
- What's the recent tenant-quality profile in this submarket — average credit score on applications, eviction rate, late-payment / NSF rate, and stable-employment percentage? A property-management company in the area should have these aggregated.
- How much new for-sale + rental construction is in the pipeline within 1–3 miles? Heavy new supply typically softens prices + rents 12–24 months out; constrained supply supports both.
Investment metrics
- 1% rule
- 0.98% ✗
- Cap rate
- 8.42%
- Cash-on-cash
- 7.59%
- DSCR
- 1.34
- GRM
- 8.5
CMA / ARV
- ARV (on-the-fly)
- $204,984
- Comps found
- 7
Show comp detail 7 sales within ~0.75 mi
| Address | Dist | Beds/Ba | Sqft | Sold | Price | $/sf | Match |
|---|---|---|---|---|---|---|---|
| 4408 Oak St | 0.53mi | 3/2.0 | 1,763 (+1%) | 7mo | $380,000 | $216 | 68 |
| 4201 Wood St | 0.42mi | 4/2.0 (+1) | 1,650 (-6%) | 0mo | $319,000 | $193 | 65 |
| 5985 Dunsmuir Ave | 0.56mi | 4/2.0 (+1) | 1,800 (+3%) | 9mo | $210,000 | $117 | 57 |
| 107 S 1st St | 0.21mi | 3/1.5 | 1,518 (-13%) | 15mo | $385,000 | $254 | 53 |
| 6290 Hilltop Dr | 0.42mi | 3/1.0 | 1,540 (-12%) | 12mo | $66,500 | $43 | 46 |
| 4212 Branstetter | 0.45mi | 3/2.0 | 1,540 (-12%) | 21mo | $110,000 | $71 | 41 |
| 4127 Edyth St | 0.35mi | 2/1.0 (-1) | 1,516 (-14%) | 17mo | $80,500 | $53 | 38 |
Match score weights: distance 35% · size 25% · config 20% · recency 20%. Top-matched comps best support the ARV.
Projected returns pro-forma
-3.0% appreciation · 3.0% rent growth · sell at horizon
- IRR
- -6.9%
- Equity multiple
- 0.74×
- Total profit
- $-13,565
- Equity at exit
- $28,181
- IRR
- 2.7%
- Equity multiple
- 1.19×
- Total profit
- $10,057
- Equity at exit
- $16,341
Cash invested: $52,920 (down + closing). Projections, not guarantees.
Landlord ↔ Tenant lean methodology
- Overall (STATE)
- 18 Strongly Tenant-Friendly
- State California
- 18 Strongly Tenant-Friendly · D+13
- County
- — inherits STATE
- City
- — inherits STATE
ZIP-level market 96025
- Active inventory
- 36
- Price-to-rent
- 8.5×
Monthly cashflow live
- Estimated rent
- $1,860 medium interval (Pro) →
- Mortgage (P&I)
- −$991
- Tax from tax record
- −$65 /mo · $777/yr
- Insurance
- −$79
- Flood insurance flood zone
- −$66 /mo · $798/yr
- HOA
- −$0
- Vacancy / Maint / Mgmt
- −$391
- Net cashflow
- $268
Break-even live
UW: 25.0% down · 7.5% · 30yr · 1.5% tax · 5.0% vac · 8.0% maint · 8.0% mgmt
Financing live
Cash to close
- Down payment
- $47,250
- Closing costs
- $5,670
- Reserves months
- —
- Total cash needed
- —
Loan-product check · same deal, 3 products live
Conventional
25% down · 7.5% · 30yr
- Down + closing
- —
- Monthly P&I
- —
- Monthly cashflow
- —
- DSCR
- —
- Eligible?
- —
Personal DTI + credit; lowest rate.
DSCR
20% down · 8.5% · 30yr
- Down + closing
- —
- Monthly P&I
- —
- Monthly cashflow
- —
- DSCR
- —
- Eligible?
- —
No personal income docs; deal must DSCR.
Hard money
10% down · 12.0% · 12mo
- Down + closing
- —
- Monthly P&I
- —
- Monthly cashflow
- —
- DSCR
- —
- Eligible?
- —
Short-term bridge; refi at stabilization.
Listing history 17 events
-
2026-06-19days on market $189,000 Active 44 DOM
-
2026-06-18days on market $189,000 Active 43 DOM
-
2026-06-17days on market $189,000 Active 42 DOM
-
2026-06-16days on market $189,000 Active 41 DOM
-
2026-06-15days on market $189,000 Active 40 DOM
-
2026-06-14days on market $189,000 Active 38 DOM
-
2026-06-12days on market $189,000 Active 37 DOM
-
2026-06-09days on market $189,000 Active 34 DOM
-
2026-06-08days on market $189,000 Active 33 DOM
-
2026-06-07days on market $189,000 Active 32 DOM
-
2026-06-07days on market $189,000 Active 31 DOM
-
2026-06-04days on market $189,000 Active 28 DOM
-
2026-06-02days on market $189,000 Active 27 DOM
-
2026-06-01days on market $189,000 Active 26 DOM
-
2026-05-31days on market $189,000 Active 25 DOM
-
2026-05-31pricedays on market $189,000 Active 24 DOM
-
2026-05-06$225,000 Active
ⓘ Source: listings_history table (triggers on properties + properties_extension) + one-shot
backfill from property_details.listing_events for pre-trigger history.
Tax reassessment forecast CA · Resets to sale price
- Current annual tax
- $777 · $65/mo
- Projected year-2 tax
- $1,436 · $120/mo
- Expected delta
- +$660/yr (+$55/mo · 84.9%)
ⓘ Screening estimate from a state-policy table — verify with the county assessor before closing.
Climate risk First Street
- Flood 7/10 Severe FEMA zone X (unshaded) · 78% chance over 30 yrs
- Wildfire 7/10 Severe
- Heat 6/10 Major 10 d/yr ≥95°F today · 25 d/yr by 30 yrs out
- Wind 1/10 Low
- Air quality 10/10 Extreme 51 unhealthy d/yr today · 52 by 30 yrs out
Nearby sold comps map
Loading sold comps map…
Walkable amenities ~0.75 mi
Loading nearby amenities…
Taxation est. · year 1
- Rental income
- $22,322
- − Mortgage interest
- −$10,587
- − Property taxes
- −$777
- − Insurance
- −$1,742
- − Repairs & maintenance
- −$1,786
- − Management
- −$1,786
- − Depreciation
- −$5,498
- Taxable income
- $146
- Est. tax owed @ 24.0%
- −$35
- After-tax cash flow
- $3,186/yr
For passive investors: Depreciation is non-cash, so a rental often shows a tax loss while cash-flowing — sheltering income. Rental losses are passive: they offset passive income freely, and up to $25,000/yr can offset ordinary (W-2) income if you actively participate and your MAGI is under $100k (phasing out to $0 by $150k); unused losses carry forward. On sale, claimed depreciation is recaptured at up to 25%, and gains may owe capital-gains tax (a 1031 exchange can defer both). Figures are a year-1 estimate at your 24.0% rate — not tax advice; consult a CPA.
Schools (NCES district)
- District
- Dunsmuir Joint Union High
- NCES district ID
- 0611700
- Math proficiency
- 25% ▲ 25.00%
- Reading proficiency
- 75% ▲ 75.00%
- Median HH income
- $32,255
- Composite
- 40.88/100
- National rank
- #3620
- State rank
- #163 of 517 in CA
Livability — Dunsmuir
- Score
- 53/100
- State rank
- #967
- US rank
- #24546
Category grades
Schools grade is shown separately in the Schools card above.
Census & demographics
- Population (ZIP)
- 2,150
Population outlook (Siskiyou County) Hauer SSP2
- Today (2025)
- 39,337 people
- By 2030
- 36,930 · -6.1%
- By 2040
- 32,367 · -17.7%
- By 2050
- 29,030 · -26.2%
- By 2075
- 23,534 · -40.2%
- By 2100
- 19,312 · -50.9%
Race, ethnicity, and origin ACS 2023
- Neighborhood character
- Predominantly White (76%)
- Race & ethnicity
- White 76% Two or more races 13% Hispanic / Latino 12% Asian 1% Black 1% Native American 1%
- Hispanic origin (detail)
- Mexican 9%
- Common ancestry
- Italian 4% Romanian 4% Lithuanian 3%
- Foreign-born
- 6% · Canada, China, South Korea
- Languages at home
- 94% English-only · Spanish 4% Other Indo-European 1%
Political lean MEDSL · Siskiyou
- 2024 margin
- R (+19.2) · D 38.8% · R 58.0% · Other 3.2%
- 2008→2024 swing
- -8.8pp toward R · 2008: -10.4pp · 2024: -19.2pp
- All cycles
- 2024: R+19.2 2020: R+15.8 2016: R+20.7 2012: R+15.6 2008: R+10.4
Not yet ingested
- Civics
- —
Market trends
- HPI YoY
- ▼ -140.66%
- Current HPI
- 144.676
- Rent YoY
- —
- Metro
- —
- State GDP YoY
- ▲ 3.21%
- F500 in state
- 116
Industry mix (Fortune 500 HQ in CA)
| Industry | F500 HQs | Revenue |
|---|---|---|
| Technology | 27 | $1,492B |
|
||
| Financial Services | 3 | $174B |
|
||
| Retail | 3 | $44B |
|
||
| Insurance | 3 | $26B |
|
||
| Media / Entertainment | 2 | $115B |
|
||
| Pharmaceuticals / Biotech | 2 | $62B |
|
||
Price history
1 event — show timeline
- 2026-05-06 Listed $225,000 SMLS
Property tax history
+2.1%/yrLatest (2025): $777 · +1.1% YoY. Source: county tax records.
Cash-flow waterfall
monthlySold comps — $/sqft
last 12 mo · ≤1 miLoading sold comps…