10701 Wilshire #1204 · Los Angeles, CA
Flood risk 6/10 · Moderate
- FEMA flood zone
- X (unshaded)
- Chance of flooding over 30 yrs
- 0.27%
- Est. flood insurance / yr
- $507 – $1,088
Fire risk 1/10 · Minimal
- Est. fire insurance / yr
- $659 – $1,223
Heat risk 6/10 · Moderate
- Hot days now (above 85°F)
- 6 days/yr
- Hot days in 30 yrs
- 19 days/yr
Wind risk 1/10 · Minimal
- Chance of severe wind over 30 yrs
- —
Air-quality risk 5/10 · Moderate
- Unhealthy air days now
- 7 days/yr
- Unhealthy air days in 30 yrs
- 7 days/yr
Risk factors via First Street. Map © Google.
Why this score? — see what drove the D grade
The composite is a weighted blend of 9 inputs, each scored 0–100. Each bar is that input's sub-score; the figure is the points it added to the 100-point composite (weight × sub-score).
- ARV discount +15.0/15.0
- Appreciation +6.0/10.0
- Cash flow +4.8/30.0
- Schools +3.6/10.0
- Livability +3.4/5.0
- 1% rule +2.8/10.0
- Rent growth +2.5/5.0
- Condition / age +2.5/5.0
- DSCR +0.0/10.0
$795,000
🖨 Deal sheet 📄 Offer letter ✓ Due diligence
Listing remarks
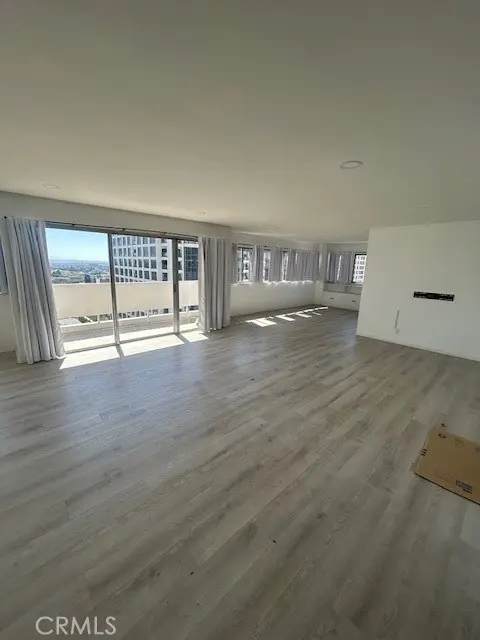
Welcome to Crown Towers, an iconic full-service luxury high-rise offering premier Westside living. This residence features 2 bedrooms and 2 bathrooms. Step inside to an open-concept floor plan filled with natural light from expansive walls of windows, showcasing sweeping panoramic views. The spacious living and dining areas flow seamlessly together, creating an effortless layout that is both elegant and functional. A large private terrace overlooking Wilshire Blvd extends the living space and offers a peaceful outdoor retreat. perfect for entertaining or enjoying spectacular sunset views. The primary suite is a true sanctuary, featuring both a walk-in closet and an additional standard close
Key facts
- 24-hour doorman
- Walk-in closet
- En-suite bathroom
Tags
Property features AI
Finance
- Other: Parcel number 4360011101
- Financial info: Assessments: Sewer Bonds
- HOA & community: Part of an association named hoa; HOA fee $1,900 monthly; Community has 118–119 units
Exterior
- Parking: 2 garage spaces; 2 parking spaces total
- Utilities: Public/district water; Sewer: other
- Home design: Condominium; Attached property; House structure type; 17 total stories; Entry on level 1
- Construction: Year built recorded by assessor
- Exterior features: Association pool; Association spa; Park in community
Interior
- Bedrooms: 1 bedroom on the main level; Walk-in closet
- Bathrooms: 2 full bathrooms; 1 bathroom on the main level
- Heating & cooling: Central cooling; Central furnace heating
- Interior features: Balcony; One level; Has view
- Laundry & utility: No laundry in unit
Neighborhood map
What this means for you Summary
Snapshot
- This is a 2-bed/2.0-bath condo listed at $795k.
Deal economics
- At list price, monthly cash flow is $-2k ($-24k/yr) — negative.
- To cash-flow at today's rent, offer at most $449k (43.5% below list).
- To meet the 1% rule (rent ≥ 1% of price), the offer needs to be $620k (22.0% below list).
- Recommended offer: $449k (43.5% below list) — sets the bar for cash-flow.
- Cap rate 3.3% vs local median 2.1% in Los Angeles — top-decile yield for the area; either an underpriced asset or a hidden risk that comps aren't pricing in. Stress-test before assuming the spread holds.
Location & tenants
- Location reads 68/100 on livability (#273 in CA) — a middle-class / working-renter tenant base. Strengths: amenities A+, commute A+, employment B; Watch: health & safety C-, schools D+, crime F.
- Los Angeles Unified (urban): math 29% / reading 54% proficiency, ranked #223 of 517 in CA (top 43%) — families likely to look elsewhere, expect single-tenant / working-renter base with shorter leases; 67% free/reduced lunch — lower-income household profile, screen leases tightly.
- Market conditions: Rents flat; 226 active listings in the ZIP; 40 comparable units currently listed for rent nearby; rentals at typical pace (median 24d on market — plan ~3-4 weeks tenant-placement turnaround); 48% of comp listings sitting > 30 days — soft ceiling on asking rent; solid renter incomes; 19,697 units permitted in Los Angeles County in 2024 (9,426 in 5+ unit buildings).
- At $6,200/mo this rent would consume 97% of the median local household income ($77k/yr) (locally 5508% of renters already pay >50% of income on rent) — very limited rent-growth headroom before tenants either downsize or default.
Forward outlook
- In year one you build about $22k of equity ($5k loan paydown + $16k appreciation (2.0% local appreciation)).
- Los Angeles County population projected at +9% by 2050 — modest demand growth; plan on rents tracking national, not racing it.
- By year 3, paydown + projected appreciation supports a ~$55k cash-out refi (75% LTV) — recoverable capital for the next deal without selling this one.
Negotiation context
- It's been on market 42 days — a 3% lower offer ($771k) is reasonable based on typical stale-listing flexibility.
- 2 sale attempts since 2y ago with the ask held roughly flat each time — persistent listings suggest the price (not the market) is what's stuck; bring a comps-based counter.
- Current owner paid $117k; list at $795k implies a 579% gain — meaningful room to come down on a strong offer.
Risks & watch-outs
- Watch-outs: HOA is 31% of rent.
- Climate carrying-cost: major flood risk; extreme-heat days projected 6→19/yr by 2055 (HVAC capex compounding) — expect insurance premiums to compound above CPI over the hold.
Questions for the listing agent
- What do current leases actually rent for vs. the listed asking? Can we see a recent rent roll and the last 12 months of T-12 income?
- It's been on market 42 days. Have you received any prior offers? Is the seller open to a 44% concession, seller financing, or rate buy-down credit?
- Built in 1964 — when were the roof, HVAC, electrical panel, plumbing, and water heater last replaced?
- What does the HOA fee cover, when was the last increase, and are there any pending special assessments or reserve-fund shortfalls?
- Any open or pending special assessments — roof, HVAC, plumbing, elevator, façade? What's the per-unit balance and payoff schedule, and is the seller paying it off at close or rolling it to the buyer?
- Is there a deadline driving the sale (1031 exchange, divorce, estate, relocation)? That informs how much negotiation room exists.
- Schools are D-rated, which usually means shorter tenancies and higher turnover. Who's the typical renter profile here, and what's been the actual vacancy rate?
- Crime grade is F in this area — have there been break-ins, vandalism, or insurance claims at this property in the last 3 years? What carrier currently insures it and at what premium?
- The area grade is low — what's the realistic commute time and amenity access for the typical tenant pool here? Any planned neighborhood developments (good or bad) we should know about?
- What's the average days-on-market for RENTAL listings here right now (not sales)? A rising rental-DOM trend means longer vacancies and softer asking-rent achievability than the comps imply.
- What's the recent tenant-quality profile in this submarket — average credit score on applications, eviction rate, late-payment / NSF rate, and stable-employment percentage? A property-management company in the area should have these aggregated.
- How much new apartment / multifamily construction is in the pipeline within 1–3 miles? Heavy new supply (>2% of stock underway) typically softens rents 12–24 months out; light construction supports rent growth.
Investment metrics
- 1% rule
- 0.78% ✗
- Cap rate
- 3.34%
- Cash-on-cash
- -10.56%
- DSCR
- 0.53
- GRM
- 10.7
CMA / ARV
- ARV (median comp)
- $1,073,785
- List price
- $795,000
- Delta
- -25.96%
- Verdict
- UNDERPRICED
- Comps
- 20 within 1.0 mi
Projected returns pro-forma
2.01% appreciation · 0.17% rent growth · sell at horizon
- IRR
- -7.2%
- Equity multiple
- 0.61×
- Total profit
- $-85,883
- Equity at exit
- $314,186
- IRR
- -3.3%
- Equity multiple
- 0.56×
- Total profit
- $-97,212
- Equity at exit
- $452,907
Cash invested: $222,600 (down + closing). Projections, not guarantees.
Landlord ↔ Tenant lean methodology
- Overall (CITY)
- 0 Strongly Tenant-Friendly
- State California
- 18 Strongly Tenant-Friendly · D+13
- County
- — inherits STATE
- City Los Angeles
- 0 Strongly Tenant-Friendly · D+22
ZIP-level market 90024
- Home prices YoY
- 0.7%
- Rents YoY
- 0.2%
- Active inventory
- 226
- Price-to-rent
- 10.7×
Monthly cashflow live
- Estimated rent
- $6,200 high interval (Pro) →
- Mortgage (P&I)
- −$4,169
- Tax from tax record
- −$456 /mo · $5,468/yr
- Insurance
- −$331
- HOA
- −$1,900
- Vacancy / Maint / Mgmt
- −$1,302
- Net cashflow
- $-1,958
Break-even live
UW: 25.0% down · 7.5% · 30yr · 1.5% tax · 5.0% vac · 8.0% maint · 8.0% mgmt
Financing live
Cash to close
- Down payment
- $198,750
- Closing costs
- $23,850
- Reserves months
- —
- Total cash needed
- —
Loan-product check · same deal, 3 products live
Conventional
25% down · 7.5% · 30yr
- Down + closing
- —
- Monthly P&I
- —
- Monthly cashflow
- —
- DSCR
- —
- Eligible?
- —
Personal DTI + credit; lowest rate.
DSCR
20% down · 8.5% · 30yr
- Down + closing
- —
- Monthly P&I
- —
- Monthly cashflow
- —
- DSCR
- —
- Eligible?
- —
No personal income docs; deal must DSCR.
Hard money
10% down · 12.0% · 12mo
- Down + closing
- —
- Monthly P&I
- —
- Monthly cashflow
- —
- DSCR
- —
- Eligible?
- —
Short-term bridge; refi at stabilization.
Rent comps 40 comps
| Address | Beds | Baths | Sqft | Rent | $/sqft | DOM | Units | Dist |
|---|---|---|---|---|---|---|---|---|
| 10701 Wilshire Blvd #1903 Los Angeles, CA | 2.0 | 2.0 | 1304 | $5,800 | $4.45 | 20d | 1 | 0.02mi |
| 10717 Wilshire Blvd Los Angeles, CA | 3.0 | 1.0–2.5 | 1438 | $4,917 | $3.42 | 18d | 15 | 0.04mi |
| 10655 Wilshire Blvd Unit 201 Los Angeles, CA | 2.0 | 2.0 | 1400 | $4,000 | $2.86 | 43d | 1 | 0.04mi |
| 10655 Wilshire Blvd Los Angeles, CA | 2.0 | 2.0 | 1100 | $3,650 | $3.32 | 43d | 1 | 0.04mi |
| 10655 Wilshire Blvd Unit 303 Los Angeles, CA | 2.0 | 2.0 | 1100 | $3,350 | $3.05 | 43d | 1 | 0.04mi |
| 10655 Wilshire Blvd Unit 301 Los Angeles, CA | 2.0 | 2.0 | 1400 | $4,200 | $3.00 | 20d | 1 | 0.04mi |
| 10655 Wilshire Blvd Ph 5 Los Angeles, CA | 2.0 | 2.0 | 1100 | $3,650 | $3.32 | 24d | 1 | 0.04mi |
| 10645 Wilshire Blvd #101 Los Angeles, CA | 2.0 | 2.0 | 1540 | $4,950 | $3.21 | 16d | 1 | 0.05mi |
| 10700 Wilshire Blvd Los Angeles, CA | 1.0–2.0 | 1.0–2.0 | 1457 | $7,425 | $5.10 | 1d | 3 | 0.05mi |
| 10660 Wilshire Blvd Los Angeles, CA | 3.0 | 1.0–4.5 | 1529 | $10,733 | $7.02 | 10d | 3 | 0.06mi |
| 10660 Wilshire Blvd Los Angeles, CA | 3.0 | 1.0–4.5 | 1529 | $10,733 | $7.02 | 43d | 2 | 0.06mi |
| 10727 Wilshire Blvd Los Angeles, CA | 2.0 | 3.0–3.5 | 2279 | $17,425 | $7.65 | 43d | 2 | 0.07mi |
| 10747 Wilshire Blvd #1103 Los Angeles, CA | 1.0 | 2.0 | 1076 | $3,799 | $3.53 | 18d | 1 | 0.11mi |
| 10600 Wilshire Blvd Los Angeles, CA | 2.0 | 2.0 | 1161 | $3,600 | $3.10 | 43d | 1 | 0.12mi |
| 10750 Wilshire Blvd #1602 Los Angeles, CA | 2.0 | 2.5 | 2162 | $8,750 | $4.05 | 43d | 1 | 0.14mi |
| 10777 Wilshire Blvd Los Angeles, CA | 2.0 | 2.0–3.0 | 1470 | $8,725 | $5.94 | 10d | 2 | 0.17mi |
| 10777 Wilshire Blvd Los Angeles, CA | 1.0–2.0 | 2.0–3.0 | 1325 | $8,950 | $6.75 | 43d | 2 | 0.17mi |
| 10777 Wilshire Blvd #205 Los Angeles, CA | 2.0 | 3.0 | 1720 | $8,950 | $5.20 | 24d | 1 | 0.17mi |
| 10762 Ashton Ave Los Angeles, CA | 3.0 | 2.0 | 1947 | $9,000 | $4.62 | 43d | 1 | 0.18mi |
| 10630 Wellworth Ave Los Angeles, CA | 3.0 | 2.0 | 2077 | $7,800 | $3.76 | 43d | 1 | 0.19mi |
| 10777 Ashton Ave Los Angeles, CA | 1.0–8.0 | 1.0–2.0 | 785 | $2,464 | $3.14 | 24d | 58 | 0.19mi |
| 10795 Wilshire Blvd #304 Los Angeles, CA | 2.0 | 2.5 | 2056 | $9,500 | $4.62 | 43d | 1 | 0.21mi |
| 10560 Wilshire Blvd #1706 Los Angeles, CA | 1.0 | 1.5 | 1828 | $10,500 | $5.74 | 43d | 1 | 0.22mi |
| 10535 Wilshire Blvd Los Angeles, CA | 2.0 | 2.0 | 1211 | $5,000 | $4.13 | 43d | 3 | 0.23mi |
| 10535 Wilshire Blvd Los Angeles, CA | 1.0–2.0 | 2.0 | 1341 | $11,000 | $8.20 | 2d | 4 | 0.23mi |
| 10550 Wilshire Blvd #1204 Los Angeles, CA | 2.0 | 2.0 | 1711 | $9,000 | $5.26 | 43d | 1 | 0.24mi |
| 10800 Lindbrook Dr Unit 10804 Los Angeles, CA | 2.0 | 1.0 | 1600 | $4,300 | $2.69 | 7d | 1 | 0.24mi |
| 10564 Ashton Ave Los Angeles, CA | 3.0 | 2.5 | 2009 | $8,950 | $4.45 | 24d | 1 | 0.26mi |
| 10520 Wilshire Blvd Los Angeles, CA | 2.0–3.0 | 2.0–3.0 | 1646 | $6,500 | $3.95 | 5d | 2 | 0.28mi |
| 10520 Wilshire Blvd #1207 Los Angeles, CA | 3.0 | 3.0 | 1889 | $10,500 | $5.56 | 43d | 1 | 0.28mi |
| 10833 Wilshire Blvd Los Angeles, CA | 2.0–3.0 | 2.0–3.0 | 1411 | $5,601 | $3.97 | 1d | 4 | 0.29mi |
| 10720 Ohio Ave #22 Los Angeles, CA | 3.0 | 2.5 | 1738 | $5,990 | $3.45 | 2d | 1 | 0.29mi |
| 10523 Ashton Ave #202 Los Angeles, CA | 2.0 | 2.5 | 1820 | $6,250 | $3.43 | 44d | 1 | 0.30mi |
| 10824 Lindbrook Dr Los Angeles, CA | 2.0 | 1.0–2.0 | 908 | $6,555 | $7.22 | 1d | 9 | 0.32mi |
| 888 Hilgard Ave Unit 205B Los Angeles, CA | 2.0 | 2.0 | 1124 | $6,440 | $5.73 | 15d | 1 | 0.35mi |
| 10630 Wilkins Ave Los Angeles, CA | 2.0–3.0 | 2.0–3.0 | 1750 | $6,800 | $3.89 | 3d | 5 | 0.37mi |
| 10490 Wilshire Blvd #1102 Los Angeles, CA | 2.0 | 3.0 | 1682 | $8,500 | $5.05 | 18d | 1 | 0.37mi |
| 1580 Manning Ave Apt 301 Los Angeles, CA | 2.0 | 2.0 | 1800 | $4,400 | $2.44 | 43d | 1 | 0.38mi |
| 1575 Manning Ave Los Angeles, CA | 2.0 | 2.0 | 1200 | $3,662 | $3.05 | 43d | 1 | 0.39mi |
| 10650 Kinnard Ave #206 Los Angeles, CA | 2.0 | 2.0 | 1370 | $4,200 | $3.07 | 43d | 1 | 0.42mi |
HOA detail condo
- Monthly dues
- $1,900 · $22,800/yr
- Assessments
- None detected in remarks — confirm with the listing agent.
Listing history 18 events
-
2026-06-18days on market $795,000 Active 42 DOM
-
2026-06-17days on market $795,000 Active 41 DOM
-
2026-06-16days on market $795,000 Active 40 DOM
-
2026-06-15days on market $795,000 Active 39 DOM
-
2026-06-13days on market $795,000 Active 37 DOM
-
2026-06-09days on market $795,000 Active 33 DOM
-
2026-06-08days on market $795,000 Active 32 DOM
-
2026-06-07days on market $795,000 Active 31 DOM
-
2026-06-04days on market $795,000 Active 28 DOM
-
2026-06-03days on market $795,000 Active 27 DOM
-
2026-06-02days on market $795,000 Active 26 DOM
-
2026-06-01days on market $795,000 Active 25 DOM
-
2026-05-31days on market $795,000 Active 24 DOM
-
2026-05-07$795,000 Active 1673-char remark
-
2024-07-30historical $5,500
-
2024-05-03price $5,500
-
2024-01-10$6,000
-
1979-05-07soldstatus $117,000
ⓘ Source: listings_history table (triggers on properties + properties_extension) + one-shot
backfill from property_details.listing_events for pre-trigger history.
Tax reassessment forecast CA · Resets to sale price
- Current annual tax
- $5,468 · $456/mo
- Projected year-2 tax
- $6,042 · $504/mo
- Expected delta
- +$574/yr (+$48/mo · 10.5%)
ⓘ Screening estimate from a state-policy table — verify with the county assessor before closing.
Climate risk First Street
- Flood 6/10 Major FEMA zone X (unshaded) · 27% chance over 30 yrs
- Wildfire 1/10 Low
- Heat 6/10 Major 6 d/yr ≥85°F today · 19 d/yr by 30 yrs out
- Wind 1/10 Low
- Air quality 5/10 Major 7 unhealthy d/yr today · 7 by 30 yrs out
Nearby sold comps map
Loading sold comps map…
Walkable amenities ~0.75 mi
Loading nearby amenities…
Taxation est. · year 1
- Rental income
- $74,394
- − Mortgage interest
- −$44,532
- − Property taxes
- −$5,468
- − Insurance
- −$3,975
- − Repairs & maintenance
- −$5,952
- − Management
- −$5,952
- − HOA
- −$22,800
- − Depreciation
- −$23,127
- Taxable loss
- −$37,412
- Est. tax savings @ 24.0%
- +$8,979
- After-tax cash flow
- $-14,522/yr
For passive investors: Depreciation is non-cash, so a rental often shows a tax loss while cash-flowing — sheltering income. Rental losses are passive: they offset passive income freely, and up to $25,000/yr can offset ordinary (W-2) income if you actively participate and your MAGI is under $100k (phasing out to $0 by $150k); unused losses carry forward. On sale, claimed depreciation is recaptured at up to 25%, and gains may owe capital-gains tax (a 1031 exchange can defer both). Figures are a year-1 estimate at your 24.0% rate — not tax advice; consult a CPA.
Schools (NCES district)
- District
- Los Angeles Unified
- NCES district ID
- 0622710
- Math proficiency
- 29% ▼ -4.00%
- Reading proficiency
- 54% ▲ 10.00%
- Median HH income
- $50,403
- Composite
- 35.67/100
- National rank
- #4875
- State rank
- #223 of 517 in CA
Livability — Los Angeles
- Score
- 68/100
- State rank
- #273
- US rank
- #9237
Category grades
Schools grade is shown separately in the Schools card above.
Census & demographics
- Census place
- Los Angeles, CA
- County
- Los Angeles County · 9,444,647 people
- City population
- 3,838,149
- Metro
- Los Angeles-Long Beach-Anaheim, CA
- Population (ZIP)
- 51,675
- Household income
- $76,583
- Rent vs Own
- Severe rent burden
- 5508.0
Population outlook (Los Angeles County) Hauer SSP2
- Today (2025)
- 10,940,515 people
- By 2030
- 11,256,481 · +2.9%
- By 2040
- 11,729,929 · +7.2%
- By 2050
- 11,948,407 · +9.2%
- By 2075
- 11,818,114 · +8.0%
- By 2100
- 10,842,928 · -0.9%
Race, ethnicity, and origin ACS 2023
- Neighborhood character
- Diverse neighborhood (Simpson 0.67)
- Race & ethnicity
- White 49% Asian 27% Hispanic / Latino 13% Two or more races 9% Black 4%
- Hispanic origin (detail)
- Mexican 9%
- Common ancestry
- Italian 3% Scotch-Irish 3% Romanian 3%
- Foreign-born
- 28% · China, Canada, South Korea
- Languages at home
- 53% English-only · Other Indo-European 13% Spanish 10% Chinese 9%
Political lean MEDSL · Los Angeles
- 2024 margin
- Solid D (+32.9) · D 64.8% · R 31.9% · Other 3.3%
- 2008→2024 swing
- -7.4pp toward R · 2008: 40.4pp · 2024: 32.9pp
- All cycles
- 2024: D+32.9 2020: D+44.2 2016: D+48.0 2012: D+40.0 2008: D+40.4
Not yet ingested
- Civics
- —
Market trends
- HPI YoY
- ▲ 2.01%
- Current HPI
- 302.6832
- Rent YoY
- ▲ 0.17%
- Metro
- Los Angeles-Long Beach-Anaheim, CA
- State GDP YoY
- ▲ 3.21%
- F500 in state
- 116
Industry mix (Fortune 500 HQ in CA)
| Industry | F500 HQs | Revenue |
|---|---|---|
| Technology | 27 | $1,492B |
|
||
| Financial Services | 3 | $174B |
|
||
| Retail | 3 | $44B |
|
||
| Insurance | 3 | $26B |
|
||
| Media / Entertainment | 2 | $115B |
|
||
| Pharmaceuticals / Biotech | 2 | $62B |
|
||
Price history
+579.5% since first listed5 events — show timeline
- 2026-05-07 Listed $795,000 CRMLS
- 2024-07-30 Rental Removed $5,500 CLAW
- 2024-05-03 Price Changed $5,500 CLAW
- 2024-01-10 Listed for Rent $6,000 CLAW
- 1979-05-07 Sold (Public Records) $117,000 Public Records
Property tax history
+1.6%/yrLatest (2025): $5,468 · +1.4% YoY. Source: county tax records.
Cash-flow waterfall
monthlySold comps — $/sqft
last 12 mo · ≤1 miLoading sold comps…