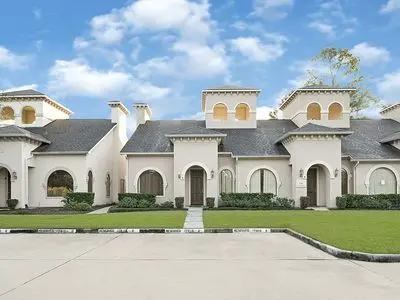
12816 Willow Centre Dr · Houston, TX
Flood risk No data
- FEMA flood zone
- —
- Chance of flooding over 30 yrs
- —
- Est. flood insurance / yr
- —
Fire risk No data
- Est. fire insurance / yr
- —
Heat risk No data
- Hot days now (above threshold)
- —
- Hot days in 30 yrs
- —
Wind risk No data
- Chance of severe wind over 30 yrs
- —
Air-quality risk No data
- Unhealthy air days now
- —
- Unhealthy air days in 30 yrs
- —
Risk factors via First Street. Map © Google.
Why this score? — see what drove the C- grade
The composite is a weighted blend of 9 inputs, each scored 0–100. Each bar is that input's sub-score; the figure is the points it added to the 100-point composite (weight × sub-score).
- Cash flow +16.5/30.0
- ARV discount +7.5/15.0
- DSCR +5.1/10.0
- 1% rule +4.5/10.0
- Appreciation +4.5/10.0
- Schools +4.4/10.0
- Condition / age +3.8/5.0
- Livability +3.7/5.0
- Rent growth +1.3/5.0
$120,000
🖨 Deal sheet (PDF) 📄 Offer letter ✓ Due diligence
Listing remarks
* Tenant occupied * Sophisticated and move in ready office condo in the sought after Willow Park Office Condos. This professionally maintained suite offers a flexible open layout with quality finishes, ideal for medical, legal, or professional use. Large windows bring in natural light, creating a bright and inviting workspace. Conveniently located near FM 1960, Beltway 8, and Highway 249, this property provides easy access to Houston & acirc; & euro; & trade; s major business corridors. The complex offers ample parking and beautifully maintained landscaping, with exterior upkeep covered by the HOA. Perfect for owner-users or investors seeking a clean, modern office in a prime N
Key facts
- Large windows
- Flexible open layout
- Ample parking
Tags
Property features AI
Exterior
- Home design: Built in 2005
- Construction: Living area of 675; Built in 2005 construction
- Exterior features: Located in the Willow Center subdivision
Neighborhood map
What this means for you Summary
Snapshot
- This is a 2-bed/1.0-bath condo listed at $120k. Condition is rated good.
Deal economics
- At list price, monthly cash flow is $70 ($841/yr) — positive.
- The deal already cash-flows at list — no discount required.
- To meet the 1% rule (rent ≥ 1% of price), the offer needs to be $114k (5.1% below list).
- Recommended offer: $114k (5.1% below list) — sets the bar for 1% rule.
- Cap rate 7.0% vs local median 3.2% in Houston — top-decile yield for the area; either an underpriced asset or a hidden risk that comps aren't pricing in. Stress-test before assuming the spread holds.
Location & tenants
- Location reads 74/100 on livability (#184 in TX, #4,771 nationally) — a middle-class / working-renter tenant base. Strengths: amenities A+, cost of living A+, housing A+; Watch: crime F.
- Cypress-Fairbanks ISD (suburban): math 45% / reading 52% proficiency, ranked #161 of 826 in TX (top 20%) — families likely to look elsewhere, expect single-tenant / working-renter base with shorter leases.
- Zoned schools: Yeager El (math 35% / reading 42%, grade F, #1,680 of 4,322 statewide, top 40%, 830 students, 72% FRL); Bleyl Middle (math 35% / reading 45%, grade F, #646 of 1,662 statewide, top 40%, 1,451 students, 72% FRL); Cypress Creek H S (math 60% / reading 59%, grade C+, #275 of 1,632 statewide, top 19%, 3,366 students, 59% FRL) — zoned schools average 68% FRL vs 43% district-wide (25 pts higher); higher-poverty schools than district average — tighter screening recommended.
- Market conditions: Rents falling (-4.7%/yr); 164 active listings in the ZIP; 40 comparable units currently listed for rent nearby; rentals at typical pace (median 14d on market — plan ~3-4 weeks tenant-placement turnaround); solid renter incomes; 29,883 units permitted in Harris County in 2024 (8,621 in 5+ unit buildings).
- This rent is only 16% of the median local income ($87k/yr) — well below the 30% rent-burden line; pricing power to push rent on renewal without tenant pushback.
Forward outlook
- Local home prices are declining (-1.0%/yr); year-one equity from $830 of loan paydown is wiped out by about $1k of value loss. Plan a longer hold.
- Harris County population projected at +47% by 2050 — long-run rental-demand tailwind backs the buy-and-hold thesis.
Negotiation context
- It's been on market 26 days — a 2% lower offer ($118k) is reasonable based on typical stale-listing flexibility.
- 3 sale attempts since 5y ago with the ask held roughly flat each time — persistent listings suggest the price (not the market) is what's stuck; bring a comps-based counter.
Questions for the listing agent
- Any open or pending special assessments — roof, HVAC, plumbing, elevator, façade? What's the per-unit balance and payoff schedule, and is the seller paying it off at close or rolling it to the buyer?
- Is there a deadline driving the sale (1031 exchange, divorce, estate, relocation)? That informs how much negotiation room exists.
- Schools are D-rated, which usually means shorter tenancies and higher turnover. Who's the typical renter profile here, and what's been the actual vacancy rate?
- Crime grade is F in this area — have there been break-ins, vandalism, or insurance claims at this property in the last 3 years? What carrier currently insures it and at what premium?
- What's the average days-on-market for RENTAL listings here right now (not sales)? A rising rental-DOM trend means longer vacancies and softer asking-rent achievability than the comps imply.
- What's the recent tenant-quality profile in this submarket — average credit score on applications, eviction rate, late-payment / NSF rate, and stable-employment percentage? A property-management company in the area should have these aggregated.
- How much new apartment / multifamily construction is in the pipeline within 1–3 miles? Heavy new supply (>2% of stock underway) typically softens rents 12–24 months out; light construction supports rent growth.
Investment metrics
- 1% rule
- 0.95% ✗
- Cap rate
- 6.99%
- Cash-on-cash
- 2.50%
- DSCR
- 1.11
- GRM
- 8.8
CMA / ARV
No comps found within radius.
Projected returns pro-forma
-1.02% appreciation · 0.0% rent growth · sell at horizon
- IRR
- -5.6%
- Equity multiple
- 0.76×
- Total profit
- $-8,008
- Equity at exit
- $28,844
- IRR
- -1.5%
- Equity multiple
- 0.87×
- Total profit
- $-4,396
- Equity at exit
- $30,185
Cash invested: $33,600 (down + closing). Projections, not guarantees.
Landlord ↔ Tenant lean methodology
- Overall (STATE)
- 87 Strongly Landlord-Friendly
- State Texas
- 87 Strongly Landlord-Friendly · R+5
- County
- — inherits STATE
- City
- — inherits STATE
ZIP-level market 77066
- Home prices YoY
- -0.4%
- Rents YoY
- -4.7%
- Active inventory
- 164
- Price-to-rent
- 8.8×
Monthly cashflow live
- Estimated rent
- $1,138 high interval (Pro) →
- Mortgage (P&I)
- −$629
- Tax est. 1.5%
- −$150 /mo · $1,800/yr
- Insurance
- −$50
- HOA
- −$0
- Vacancy / Maint / Mgmt
- −$239
- Net cashflow
- $70
Break-even live
Sensitivity live
| Price | -10% $153 | -5% $112 | +0% $70 | +5% $29 | +10% $-13 |
|---|---|---|---|---|---|
| Rent | -10% $-20 | -5% $25 | +0% $70 | +5% $115 | +10% $160 |
| Rate | -1.0pp $130 | -0.5pp $101 | base $70 | +0.5pp $39 | +1.0pp $7 |
UW: 25.0% down · 7.5% · 30yr · 1.5% tax · 5.0% vac · 8.0% maint · 8.0% mgmt
Financing live
Cash to close
- Down payment
- $30,000
- Closing costs
- $3,600
- Reserves months
- —
- Total cash needed
- —
Loan-product check · same deal, 3 products live
Conventional
25% down · 7.5% · 30yr
- Down + closing
- —
- Monthly P&I
- —
- Monthly cashflow
- —
- DSCR
- —
- Eligible?
- —
Personal DTI + credit; lowest rate.
DSCR
20% down · 8.5% · 30yr
- Down + closing
- —
- Monthly P&I
- —
- Monthly cashflow
- —
- DSCR
- —
- Eligible?
- —
No personal income docs; deal must DSCR.
Hard money
10% down · 12.0% · 12mo
- Down + closing
- —
- Monthly P&I
- —
- Monthly cashflow
- —
- DSCR
- —
- Eligible?
- —
Short-term bridge; refi at stabilization.
Rent comps 40 comps
| Address | Beds | Baths | Sqft | Rent | $/sqft | DOM | Units | Dist |
|---|---|---|---|---|---|---|---|---|
| 7250 W Greens Rd Houston, TX | 1.0–2.0 | 1.0–2.0 | 827 | $1,525 | $1.84 | 0d | 38 | 0.43mi |
| 13222 Champions Centre Dr Houston, TX | 1.0–2.0 | 1.0–2.0 | 875 | $1,454 | $1.66 | 0d | 18 | 0.46mi |
| 6830 Champions Plaza Dr Houston, TX | 1.0–2.0 | 1.0–2.0 | 956 | $1,501 | $1.57 | 0d | 30 | 0.55mi |
| 7256 W Greens Rd Houston, TX | 1.0 | 1.0 | 594 | $980 | $1.65 | 45d | 1 | 0.55mi |
| 6836 Champions Plaza Dr Houston, TX | 1.0 | 1.0 | 698 | $1,100 | $1.58 | 45d | 1 | 0.58mi |
| 13056 Champions Park Dr Houston, TX | 1.0 | 1.0 | 716 | $1,143 | $1.60 | 45d | 1 | 0.58mi |
| 7575 Willow Chase Blvd Houston, TX | 1.0–2.0 | 1.0–2.0 | 748 | $1,499 | $2.00 | 26d | 1 | 0.58mi |
| 7575 Willow Chase Blvd Houston, TX | 1.0–2.0 | 1.0–2.0 | 748 | $1,499 | $2.00 | 45d | 18 | 0.58mi |
| 13050 Champions Park Dr Houston, TX | 1.0–2.0 | 1.0–2.0 | 896 | $1,310 | $1.46 | 4d | 26 | 0.66mi |
| 6701 Farm to Market 1960 Rd W Unit 6775 Houston, TX | 1.0 | 1.0 | 697 | $1,167 | $1.67 | 14d | 1 | 0.68mi |
| 6701 Farm to Market 1960 Rd W Unit 6752 Houston, TX | 1.0 | 1.0 | 697 | $1,162 | $1.67 | 14d | 1 | 0.68mi |
| 6701 Farm to Market 1960 Rd W Unit 310 Houston, TX | 1.0 | 1.0 | 697 | $1,071 | $1.54 | 45d | 1 | 0.68mi |
| 6701 Farm to Market 1960 Rd W Houston, TX | 1.0 | 1.0 | 697 | $1,129 | $1.62 | 18d | 1 | 0.68mi |
| 13555 Breton Ridge St Houston, TX | 1.0 | 1.0 | 543 | $830 | $1.53 | 14d | 1 | 0.76mi |
| 13555 Breton Ridge St Unit 1047 Houston, TX | 1.0 | 1.0 | 543 | $740 | $1.36 | 12d | 1 | 0.76mi |
| 13555 Breton Ridge St Unit 1162 Houston, TX | 1.0 | 1.0 | 543 | $700 | $1.29 | 6d | 1 | 0.78mi |
| 13555 Breton Ridge St Unit 320 Houston, TX | 1.0 | 1.0 | 543 | $700 | $1.29 | 8d | 1 | 0.78mi |
| 13555 Breton Ridge St Unit 13576 Houston, TX | 1.0 | 1.0 | 543 | $835 | $1.54 | 14d | 1 | 0.78mi |
| 13555 Breton Ridge St Unit 13629 Houston, TX | 1.0 | 1.0 | 543 | $739 | $1.36 | 12d | 1 | 0.78mi |
| 13555 Breton Ridge St Unit 1228 Houston, TX | 1.0 | 1.0 | 543 | $689 | $1.27 | 0d | 1 | 0.78mi |
| 13555 Breton Ridge St Unit 13606 Houston, TX | 1.0 | 1.0 | 543 | $689 | $1.27 | 14d | 1 | 0.78mi |
| 7700 Willow Chase Blvd Houston, TX | 1.0–3.0 | 1.0–2.0 | 967 | $1,382 | $1.43 | 0d | 62 | 0.78mi |
| 12330 N Gessner Rd Houston, TX | 1.0–3.0 | 1.0–2.0 | 1030 | $1,720 | $1.67 | 4d | 27 | 1.07mi |
| 8719 Farm to Market 1960 Rd W Apt 210 Houston, TX | 1.0 | 1.0 | 350 | $914 | $2.61 | 45d | 1 | 1.33mi |
| 8719 Farm to Market 1960 Rd W Apt 310 Houston, TX | 1.0 | 1.0 | 525 | $1,014 | $1.93 | 45d | 1 | 1.33mi |
| 12917 Schroeder Rd Houston, TX | 1.0 | 1.0 | 684 | $1,158 | $1.69 | 26d | 1 | 1.34mi |
| 8330 Willow Place Dr S Unit 1165 Houston, TX | 1.0 | 1.0 | 689 | $869 | $1.26 | 0d | 1 | 1.36mi |
| 8330 Willow Place Dr S Unit 8351 Houston, TX | 1.0 | 1.0 | 689 | $919 | $1.33 | 12d | 1 | 1.36mi |
| 8330 Willow Place Dr S Unit 2165 Houston, TX | 2.0 | 2.0 | 735 | $1,149 | $1.56 | 0d | 1 | 1.36mi |
| 8330 Willow Place Dr S Unit 8387 Houston, TX | 2.0 | 2.0 | 735 | $1,189 | $1.62 | 12d | 1 | 1.36mi |
| 8330 Willow Place Dr S Unit 2187 Houston, TX | 2.0 | 2.0 | 735 | $1,190 | $1.62 | 0d | 1 | 1.36mi |
| 8330 Willow Place Dr S Unit 8351 Houston, TX | 1.0 | 1.0 | 668 | $870 | $1.30 | 14d | 1 | 1.36mi |
| 8330 Willow Place Dr S Unit 1162 Houston, TX | 1.0 | 1.0 | 689 | $880 | $1.28 | 6d | 1 | 1.36mi |
| 8330 Willow Place Dr S Unit 8381 Houston, TX | 1.0 | 1.0 | 600 | $845 | $1.41 | 45d | 1 | 1.36mi |
| 8330 Willow Place Dr S Unit 421 Houston, TX | 2.0 | 2.0 | 735 | $1,165 | $1.59 | 8d | 1 | 1.36mi |
| 8330 Willow Place Dr S Unit 323 Houston, TX | 1.0 | 1.0 | 689 | $880 | $1.28 | 8d | 1 | 1.36mi |
| 8330 Willow Place Dr S Houston, TX | 1.0 | 1.0 | 689 | $869 | $1.26 | 14d | 1 | 1.37mi |
| 13504 Schroeder Rd Houston, TX | 1.0–3.0 | 1.0–2.5 | 1043 | $1,224 | $1.17 | 18d | 18 | 1.46mi |
| 13504 Schroeder Rd Houston, TX | 1.0–3.0 | 1.0–2.5 | 1043 | $1,474 | $1.41 | 8d | 22 | 1.46mi |
| 14141 Champion Dr Unit 14162 Houston, TX | 1.0 | 1.0 | 640 | $1,078 | $1.68 | 14d | 1 | 1.50mi |
HOA detail condo
- Monthly dues
- $0 · $0/yr
- Likely covers
- landscaping
- Assessments
- None detected in remarks — confirm with the listing agent.
Listing history 20 events
-
2026-06-21days on market $120,000 Active 26 DOM
-
2026-06-18days on market $120,000 Active 23 DOM
-
2026-06-17days on market $120,000 Active 22 DOM
-
2026-06-16days on market $120,000 Active 21 DOM
-
2026-06-15days on market $120,000 Active 20 DOM
-
2026-06-13days on market $120,000 Active 18 DOM
-
2026-06-13days on market $120,000 Active 17 DOM
-
2026-06-09days on market $120,000 Active 14 DOM
-
2026-06-08days on market $120,000 Active 13 DOM
-
2026-06-07days on market $120,000 Active 12 DOM
-
2026-06-04days on market $120,000 Active 9 DOM
-
2026-06-03days on market $120,000 Active 8 DOM
-
2026-06-02days on market $120,000 Active 7 DOM
-
2026-06-02days on market $120,000 Active 6 DOM
-
2026-05-31days on market $120,000 Active 5 DOM
-
2026-05-26$120,000 Active
-
2022-05-22historical
-
2022-05-10$129,900 Active
-
2022-04-04historical
-
2021-12-09$129,990 Active
ⓘ Source: listings_history table (triggers on properties + properties_extension) + one-shot
backfill from property_details.listing_events for pre-trigger history.
Nearby sold comps map
Loading sold comps map…
Walkable amenities ~0.75 mi
Loading nearby amenities…
Taxation est. · year 1
- Rental income
- $13,661
- − Mortgage interest
- −$6,722
- − Property taxes
- −$1,800
- − Insurance
- −$600
- − Repairs & maintenance
- −$1,093
- − Management
- −$1,093
- − Depreciation
- −$3,491
- Taxable loss
- −$1,138
- Est. tax savings @ 24.0%
- +$273
- After-tax cash flow
- $1,114/yr
For passive investors: Depreciation is non-cash, so a rental often shows a tax loss while cash-flowing — sheltering income. Rental losses are passive: they offset passive income freely, and up to $25,000/yr can offset ordinary (W-2) income if you actively participate and your MAGI is under $100k (phasing out to $0 by $150k); unused losses carry forward. On sale, claimed depreciation is recaptured at up to 25%, and gains may owe capital-gains tax (a 1031 exchange can defer both). Figures are a year-1 estimate at your 24.0% rate — not tax advice; consult a CPA.
Condition & rehab AI · 1 photo
This multi-family property is in excellent condition with no visible repairs needed. It offers a good investment opportunity with potential for value increase through minor exterior updates.
Value-add opportunities
- Both Painting the exterior — Enhances curb appeal and can increase both resale and rental value
- Both Landscaping improvements — Enhances curb appeal and can increase both resale and rental value
Renovation cost estimate screening
Value-add ROI direction
- Both Painting the exterior — Enhances curb appeal and can increase both resale and rental value ↑
- Both Landscaping improvements — Enhances curb appeal and can increase both resale and rental value ↑
ⓘ Cost ranges are severity-bucket heuristics (US national rule-of-thumb). Get contractor quotes + a written scope before underwriting a rehab budget.
Schools (NCES district)
- District
- Cypress-Fairbanks ISD
- NCES district ID
- 4816110
- Math proficiency
- 45% ▼ -12.00%
- Reading proficiency
- 52% ▼ -2.00%
- Median HH income
- $72,025
- Composite
- 43.63/100
- National rank
- #2968
- State rank
- #161 of 826 in TX
Livability — Houston
- Score
- 74/100
- State rank
- #184
- US rank
- #4771
Category grades
Schools grade is shown separately in the Schools card above.
Census & demographics
- Census place
- Houston, TX
- County
- Harris County · 4,702,590 people
- City population
- 3,226,434
- Metro
- Houston-The Woodlands-Sugar Land, TX
- Population (ZIP)
- 39,311
- Household income
- $87,138
- Rent vs Own
- Severe rent burden
- 815.0
Population outlook (Harris County) Hauer SSP2
- Today (2025)
- 5,571,493 people
- By 2030
- 6,089,821 · +9.3%
- By 2040
- 7,142,806 · +28.2%
- By 2050
- 8,185,864 · +46.9%
- By 2075
- 10,574,329 · +89.8%
- By 2100
- 12,109,958 · +117.4%
Race, ethnicity, and origin ACS 2023
- Neighborhood character
- Diverse neighborhood (Simpson 0.69)
- Race & ethnicity
- Hispanic / Latino 47% Black 23% Two or more races 21% Asian 15% White 13%
- Hispanic origin (detail)
- Mexican 32%
- Common ancestry
- Romanian 1%
- Foreign-born
- 31% · Canada, Vietnam, Jamaica
- Languages at home
- 49% English-only · Spanish 36% Vietnamese 8% Other Asian/Pacific 2%
Political lean MEDSL · Harris
- 2024 margin
- Lean D (+5.5) · D 52.0% · R 46.4% · Other 1.6%
- 2008→2024 swing
- +3.9pp toward D · 2008: 1.6pp · 2024: 5.5pp
- All cycles
- 2024: D+5.5 2020: D+13.3 2016: D+12.4 2012: D+0.1 2008: D+1.6
Not yet ingested
- Civics
- —
Market trends
- HPI YoY
- ▼ -1.02%
- Current HPI
- 261.1086
- Rent YoY
- ▼ -4.69%
- Metro
- Houston-The Woodlands-Sugar Land, TX
- State GDP YoY
- ▲ 3.95%
- F500 in state
- 110
Industry mix (Fortune 500 HQ in TX)
| Industry | F500 HQs | Revenue |
|---|---|---|
| Energy | 16 | $1,198B |
|
||
| Technology | 5 | $198B |
|
||
| Engineering / Construction | 4 | $72B |
|
||
| Energy Services | 3 | $60B |
|
||
| Utilities | 3 | $41B |
|
||
| Healthcare | 2 | $330B |
|
||
Price history
-7.7% since first listed5 events — show timeline
- 2026-05-26 Listed $120,000 FSBO.com
- 2022-05-22 Listing Removed — HARMLS
- 2022-05-10 Listed $129,900 HARMLS
- 2022-04-04 Listing Removed — HARMLS
- 2021-12-09 Listed $129,990 HARMLS
Cash-flow waterfall
monthlySold comps — $/sqft
last 12 mo · ≤1 miLoading sold comps…