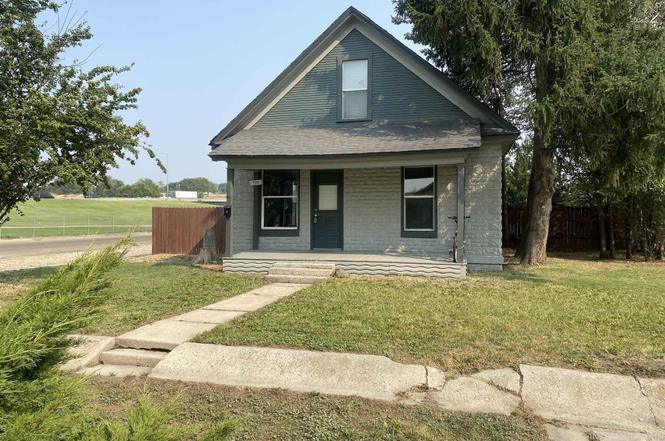
722 N Kimball · Caldwell, ID
Flood risk 3/10 · Minor
- FEMA flood zone
- X (unshaded)
- Chance of flooding over 30 yrs
- 0.18%
- Est. flood insurance / yr
- $507 – $1,088
Fire risk 4/10 · Minor
- Est. fire insurance / yr
- $584 – $1,086
Heat risk 5/10 · Moderate
- Hot days now (above 99°F)
- 7 days/yr
- Hot days in 30 yrs
- 18 days/yr
Wind risk 1/10 · Minimal
- Chance of severe wind over 30 yrs
- —
Air-quality risk 7/10 · Major
- Unhealthy air days now
- 11 days/yr
- Unhealthy air days in 30 yrs
- 18 days/yr
Risk factors via First Street. Map © Google.
Why this score? — see what drove the C- grade
The composite is a weighted blend of 9 inputs, each scored 0–100. Each bar is that input's sub-score; the figure is the points it added to the 100-point composite (weight × sub-score).
- Cash flow +23.1/30.0
- ARV discount +7.5/15.0
- DSCR +7.4/10.0
- 1% rule +4.7/10.0
- Livability +3.4/5.0
- Rent growth +3.2/5.0
- Condition / age +2.5/5.0
- Schools +2.0/10.0
- Appreciation +0.0/10.0
$246,500
🖨 Deal sheet (PDF) 📄 Offer letter ✓ Due diligence
Listing remarks MLS
Clean 4 bed 1 bath home on corner lot. 4th bedroom does not meet egress. Convenient layout with two beds on main level with full bath and laundry hookups. Large kitchen with eating space. Updated electrical, updated vinyl windows with tons of potential for your personal touch. Great rental property with rates at historic levels. Large backyard with RV gate and storage shed.
Key facts
- Updated electrical
- Large lot
- Storage shed
Tags
Property features AI
Exterior
- Utilities: City water service; Sewer connected
- Home design: Single family residence
- Construction: Brick construction; Crawl space foundation; Built in 1915
- Exterior features: Partial wood fencing; Covered patio/deck; Composition roof
Interior
- Kitchen: Oven/Range (freestanding); Refrigerator
- Bedrooms: 4 bedrooms — Master and one bedroom on main level; two bedrooms on upper level
- Bathrooms: 1 bathroom
- Heating & cooling: Baseboard heating; Electric heating; Forced air; Natural gas heating; No central cooling reported
- Interior features: Master bedroom on main level
- Laundry & utility: Electric water heater
Neighborhood map
What this means for you Summary
Snapshot
- This is a 4-bed/1.0-bath other listed at $246k.
Deal economics
- At list price, monthly cash flow is $441 ($5k/yr) — positive.
- The deal already cash-flows at list — no discount required.
- To meet the 1% rule (rent ≥ 1% of price), the offer needs to be $240k (2.6% below list).
- Recommended offer: $217k (12.0% below list) — sets the bar for market timing.
- Cap rate 8.4% vs local median 3.1% in Caldwell — top-decile yield for the area; either an underpriced asset or a hidden risk that comps aren't pricing in. Stress-test before assuming the spread holds.
Location & tenants
- Location reads 67/100 on livability (#88 in ID) — a middle-class / working-renter tenant base. Strengths: cost of living A+, housing A+; Watch: crime C-, employment D+, amenities F.
- Caldwell District (suburban): math 17% / reading 31% proficiency, ranked #90 of 92 in ID (top 98%) — low school quality limits family demand, transient renter base, plan for 1-2y turnover; 72% free/reduced lunch — lower-income household profile, screen leases tightly.
- Zoned schools: Van Buren Elementary School (math 23% / reading 28%, grade F, #330 of 357 statewide, top 92%, 561 students, 90% FRL); Caldwell Senior High School (math 16% / reading 38%, grade F, #131 of 169 statewide, top 77%, 1,474 students, 76% FRL).
- Market conditions: Rents rising (+2.7%/yr); 341 active listings in the ZIP; 5 comparable units currently listed for rent nearby; rentals at typical pace (median 15d on market — plan ~3-4 weeks tenant-placement turnaround); 3,620 units permitted in Canyon County in 2024 (196 in 5+ unit buildings).
- This rent runs 42% of the median local income ($68k/yr) — at the standard rent-burdened threshold; future hikes will face affordability resistance.
Forward outlook
- Local home prices are declining (-3.0%/yr); year-one equity from $2k of loan paydown is wiped out by about $7k of value loss. Plan a longer hold.
- Canyon County population projected at +41% by 2050 — long-run rental-demand tailwind backs the buy-and-hold thesis.
Negotiation context
- It's been on market 122 days — a 12% lower offer ($217k) is reasonable based on typical stale-listing flexibility.
- 4 sale attempts since 23y ago with the ask held roughly flat each time — persistent listings suggest the price (not the market) is what's stuck; bring a comps-based counter.
Risks & watch-outs
- Watch-outs: built in 1915 — expect roof / HVAC / electrical / plumbing capex.
- Climate carrying-cost: extreme-heat days projected 7→18/yr by 2055 (HVAC capex compounding) — expect insurance premiums to compound above CPI over the hold.
Questions for the listing agent
- It's been on market 122 days. Have you received any prior offers? Is the seller open to a 12% concession, seller financing, or rate buy-down credit?
- Built in 1915 — when were the roof, HVAC, electrical panel, plumbing, and water heater last replaced?
- Why hasn't it sold? Are there any deal-killer items the seller is aware of (foundation, flood, title, zoning, code violations)?
- Is there a deadline driving the sale (1031 exchange, divorce, estate, relocation)? That informs how much negotiation room exists.
- Schools are D-rated, which usually means shorter tenancies and higher turnover. Who's the typical renter profile here, and what's been the actual vacancy rate?
- What's the average days-on-market for RENTAL listings here right now (not sales)? A rising rental-DOM trend means longer vacancies and softer asking-rent achievability than the comps imply.
- What's the recent tenant-quality profile in this submarket — average credit score on applications, eviction rate, late-payment / NSF rate, and stable-employment percentage? A property-management company in the area should have these aggregated.
- How much new for-sale + rental construction is in the pipeline within 1–3 miles? Heavy new supply typically softens prices + rents 12–24 months out; constrained supply supports both.
Investment metrics
- 1% rule
- 0.97% ✗
- Cap rate
- 8.44%
- Cash-on-cash
- 7.67%
- DSCR
- 1.34
- GRM
- 8.6
CMA / ARV
No comps found within radius.
Projected returns pro-forma
-3.0% appreciation · 2.69% rent growth · sell at horizon
- IRR
- -5.0%
- Equity multiple
- 0.82×
- Total profit
- $-12,721
- Equity at exit
- $36,754
- IRR
- 4.3%
- Equity multiple
- 1.31×
- Total profit
- $21,571
- Equity at exit
- $21,313
Cash invested: $69,020 (down + closing). Projections, not guarantees.
Landlord ↔ Tenant lean methodology
- Overall (STATE)
- 91 Strongly Landlord-Friendly
- State Idaho
- 91 Strongly Landlord-Friendly · R+18
- County
- — inherits STATE
- City
- — inherits STATE
ZIP-level market 83605
- Home prices YoY
- -27.0%
- Rents YoY
- 2.7%
- Active inventory
- 341
- Price-to-rent
- 8.6×
Monthly cashflow live
- Estimated rent
- $2,401 high interval (Pro) →
- Mortgage (P&I)
- −$1,293
- Tax from tax record
- −$61 /mo · $729/yr
- Insurance
- −$103
- HOA
- −$0
- Vacancy / Maint / Mgmt
- −$504
- Net cashflow
- $441
Break-even live
Sensitivity live
| Price | -10% $580 | -5% $511 | +0% $441 | +5% $371 | +10% $301 |
|---|---|---|---|---|---|
| Rent | -10% $251 | -5% $346 | +0% $441 | +5% $536 | +10% $631 |
| Rate | -1.0pp $565 | -0.5pp $504 | base $441 | +0.5pp $377 | +1.0pp $312 |
UW: 25.0% down · 7.5% · 30yr · 1.5% tax · 5.0% vac · 8.0% maint · 8.0% mgmt
Financing live
Cash to close
- Down payment
- $61,625
- Closing costs
- $7,395
- Reserves months
- —
- Total cash needed
- —
Loan-product check · same deal, 3 products live
Conventional
25% down · 7.5% · 30yr
- Down + closing
- —
- Monthly P&I
- —
- Monthly cashflow
- —
- DSCR
- —
- Eligible?
- —
Personal DTI + credit; lowest rate.
DSCR
20% down · 8.5% · 30yr
- Down + closing
- —
- Monthly P&I
- —
- Monthly cashflow
- —
- DSCR
- —
- Eligible?
- —
No personal income docs; deal must DSCR.
Hard money
10% down · 12.0% · 12mo
- Down + closing
- —
- Monthly P&I
- —
- Monthly cashflow
- —
- DSCR
- —
- Eligible?
- —
Short-term bridge; refi at stabilization.
Rent comps 5 comps
| Address | Beds | Baths | Sqft | Rent | $/sqft | DOM | Units | Dist |
|---|---|---|---|---|---|---|---|---|
| 1704 Blaine St Unit B Caldwell, ID | 3.0 | 1.0 | 1274 | $1,900 | $1.49 | 3d | 1 | 0.88mi |
| 1704 Blaine St Unit A Caldwell, ID | 3.0 | 2.0 | 1469 | $2,125 | $1.45 | 15d | 1 | 0.88mi |
| 3804 Bobwhite St Unit 1460920P Caldwell, ID | 3.0 | 2.0 | 1140 | $3,847 | $3.37 | 19d | 1 | 1.42mi |
| 3809 Winged Dove St Unit 1532707P Caldwell, ID | 3.0 | 2.0 | 1571 | $3,522 | $2.24 | 15d | 1 | 1.43mi |
| 2609 Red Robin Way Caldwell, ID | 3.0 | 2.0 | 936 | $1,650 | $1.76 | 12d | 1 | 1.43mi |
Listing history 19 events
-
2026-06-10days on market $246,500 Active 122 DOM
-
2026-06-09days on market $246,500 Active 121 DOM
-
2026-06-08days on market $246,500 Active 120 DOM
-
2026-06-07days on market $246,500 Active 119 DOM
-
2026-06-03days on market $246,500 Active 115 DOM
-
2026-06-03days on market $246,500 Active 114 DOM
-
2026-06-01days on market $246,500 Active 113 DOM
-
2026-05-31days on market $246,500 Active 112 DOM
-
2026-03-05price $246,500
-
2026-02-07$249,900 Active
-
2021-09-22soldstatus
-
2021-09-02soldstatus Sold 376-char remark
Show marketing remark (376 chars)
Clean 4 bed 1 bath home on corner lot. 4th bedroom does not meet egress. Convenient layout with two beds on main level with full bath and laundry hookups. Large kitchen with eating space. Updated electrical, updated vinyl windows with tons of potential for your personal touch. Great rental property with rates at historic levels. Large backyard with RV gate and storage shed.
-
2021-08-31soldstatus
-
2021-08-02status Pending 376-char remark
Show marketing remark (376 chars)
Clean 4 bed 1 bath home on corner lot. 4th bedroom does not meet egress. Convenient layout with two beds on main level with full bath and laundry hookups. Large kitchen with eating space. Updated electrical, updated vinyl windows with tons of potential for your personal touch. Great rental property with rates at historic levels. Large backyard with RV gate and storage shed.
-
2021-07-29$249,900 Active 376-char remark
Show marketing remark (376 chars)
Clean 4 bed 1 bath home on corner lot. 4th bedroom does not meet egress. Convenient layout with two beds on main level with full bath and laundry hookups. Large kitchen with eating space. Updated electrical, updated vinyl windows with tons of potential for your personal touch. Great rental property with rates at historic levels. Large backyard with RV gate and storage shed.
-
2017-06-23$69,900
-
2013-12-19soldstatus
-
2004-03-26soldstatus
-
2003-12-17$34,900
ⓘ Source: listings_history table (triggers on properties + properties_extension) + one-shot
backfill from property_details.listing_events for pre-trigger history.
Tax reassessment forecast ID · Resets to sale price
- Current annual tax
- $729 · $61/mo
- Projected year-2 tax
- $1,701 · $142/mo
- Expected delta
- +$972/yr (+$81/mo · 133.3%)
ⓘ Screening estimate from a state-policy table — verify with the county assessor before closing.
Climate risk First Street
- Flood 3/10 Moderate FEMA zone X (unshaded) · 18% chance over 30 yrs
- Wildfire 4/10 Moderate
- Heat 5/10 Major 7 d/yr ≥99°F today · 18 d/yr by 30 yrs out
- Wind 1/10 Low
- Air quality 7/10 Severe 11 unhealthy d/yr today · 18 by 30 yrs out
Nearby sold comps map
Loading sold comps map…
Walkable amenities ~0.75 mi
Loading nearby amenities…
Taxation est. · year 1
- Rental income
- $28,817
- − Mortgage interest
- −$13,808
- − Property taxes
- −$729
- − Insurance
- −$1,232
- − Repairs & maintenance
- −$2,305
- − Management
- −$2,305
- − Depreciation
- −$7,171
- Taxable income
- $1,266
- Est. tax owed @ 24.0%
- −$304
- After-tax cash flow
- $4,988/yr
For passive investors: Depreciation is non-cash, so a rental often shows a tax loss while cash-flowing — sheltering income. Rental losses are passive: they offset passive income freely, and up to $25,000/yr can offset ordinary (W-2) income if you actively participate and your MAGI is under $100k (phasing out to $0 by $150k); unused losses carry forward. On sale, claimed depreciation is recaptured at up to 25%, and gains may owe capital-gains tax (a 1031 exchange can defer both). Figures are a year-1 estimate at your 24.0% rate — not tax advice; consult a CPA.
Schools (NCES district)
- District
- Caldwell District
- NCES district ID
- 1600510
- Math proficiency
- 17% ▼ -11.00%
- Reading proficiency
- 31% ▼ -4.00%
- Median HH income
- $36,116
- Composite
- 19.85/100
- National rank
- #8694
- State rank
- #90 of 92 in ID
Livability — Caldwell
- Score
- 67/100
- State rank
- #88
- US rank
- #10145
Category grades
Schools grade is shown separately in the Schools card above.
Census & demographics
- Census place
- Caldwell, ID
- County
- Canyon County · 235,358 people
- City population
- 76,816
- Metro
- Boise City, ID
- Population (ZIP)
- 41,325
- Household income
- $68,427
- Rent vs Own
- Severe rent burden
- 719.0
Population outlook (Canyon County) Hauer SSP2
- Today (2025)
- 248,853 people
- By 2030
- 269,596 · +8.3%
- By 2040
- 311,081 · +25.0%
- By 2050
- 350,809 · +41.0%
- By 2075
- 441,884 · +77.6%
- By 2100
- 505,641 · +103.2%
Race, ethnicity, and origin ACS 2023
- Neighborhood character
- Diverse neighborhood (Simpson 0.56)
- Race & ethnicity
- White 51% Hispanic / Latino 42% Two or more races 15% Native American 1%
- Hispanic origin (detail)
- Mexican 36%
- Common ancestry
- Lithuanian 3% Slovak 2% Italian 2%
- Foreign-born
- 13% · Canada
- Languages at home
- 71% English-only · Spanish 27% Russian/Polish/Slavic 1%
Political lean MEDSL · Canyon
- 2024 margin
- Solid R (+46.6) · D 25.4% · R 72.0% · Other 2.5%
- 2008→2024 swing
- -11.4pp toward R · 2008: -35.2pp · 2024: -46.6pp
- All cycles
- 2024: R+46.6 2020: R+39.7 2016: R+41.8 2012: R+37.1 2008: R+35.2
Not yet ingested
- Civics
- —
Market trends
- HPI YoY
- ▼ -135.47%
- Current HPI
- 366.7896
- Rent YoY
- ▲ 2.69%
- Metro
- Boise City, ID
- State GDP YoY
- ▲ 4.51%
- F500 in state
- 6
Industry mix (Fortune 500 HQ in ID)
| Industry | F500 HQs | Revenue |
|---|---|---|
| Retail | 1 | $79B |
|
||
| Technology | 1 | $25B |
|
||
| Food / Agriculture | 1 | $6B |
|
||
Price history
+606.3% since first listed11 events — show timeline
- 2026-03-05 Price Changed $246,500 IMLS
- 2026-02-07 Listed $249,900 IMLS
- 2021-09-22 Sold (Public Records) — Public Records
- 2021-09-02 Sold (MLS) — IMLS
- 2021-08-31 Sold (Public Records) — Public Records
- 2021-08-02 Pending — IMLS
- 2021-07-29 Listed $249,900 IMLS
- 2017-06-23 Listed $69,900 IMLS
- 2013-12-19 Sold (Public Records) — Public Records
- 2004-03-26 Sold (MLS) — IMLS
- 2003-12-17 Listed $34,900 IMLS
Property tax history
-5.0%/yrLatest (2025): $729 · +15.8% YoY. Source: county tax records.
Cash-flow waterfall
monthlySold comps — $/sqft
last 12 mo · ≤1 miLoading sold comps…