13 Teddyuscung Trl · Penn Forest, PA
Flood risk 1/10 · Minimal
- FEMA flood zone
- X (unshaded)
- Chance of flooding over 30 yrs
- 0.0%
- Est. flood insurance / yr
- $507 – $1,088
Fire risk 4/10 · Minor
- Est. fire insurance / yr
- $511 – $949
Heat risk 2/10 · Minimal
- Hot days now (above 90°F)
- 7 days/yr
- Hot days in 30 yrs
- 16 days/yr
Wind risk 4/10 · Minor
- Chance of severe wind over 30 yrs
- 8.0%
Air-quality risk 2/10 · Minimal
- Unhealthy air days now
- 1 days/yr
- Unhealthy air days in 30 yrs
- 2 days/yr
Risk factors via First Street. Map © Google.
Why this score? — see what drove the D+ grade
The composite is a weighted blend of 9 inputs, each scored 0–100. Each bar is that input's sub-score; the figure is the points it added to the 100-point composite (weight × sub-score).
- ARV discount +15.0/15.0
- Cash flow +12.3/30.0
- DSCR +3.6/10.0
- Appreciation +3.6/10.0
- 1% rule +3.2/10.0
- Schools +3.1/10.0
- Rent growth +2.5/5.0
- Livability +2.5/5.0
- Condition / age +2.5/5.0
$265,000
🖨 Deal sheet (PDF) 📄 Offer letter ✓ Due diligence
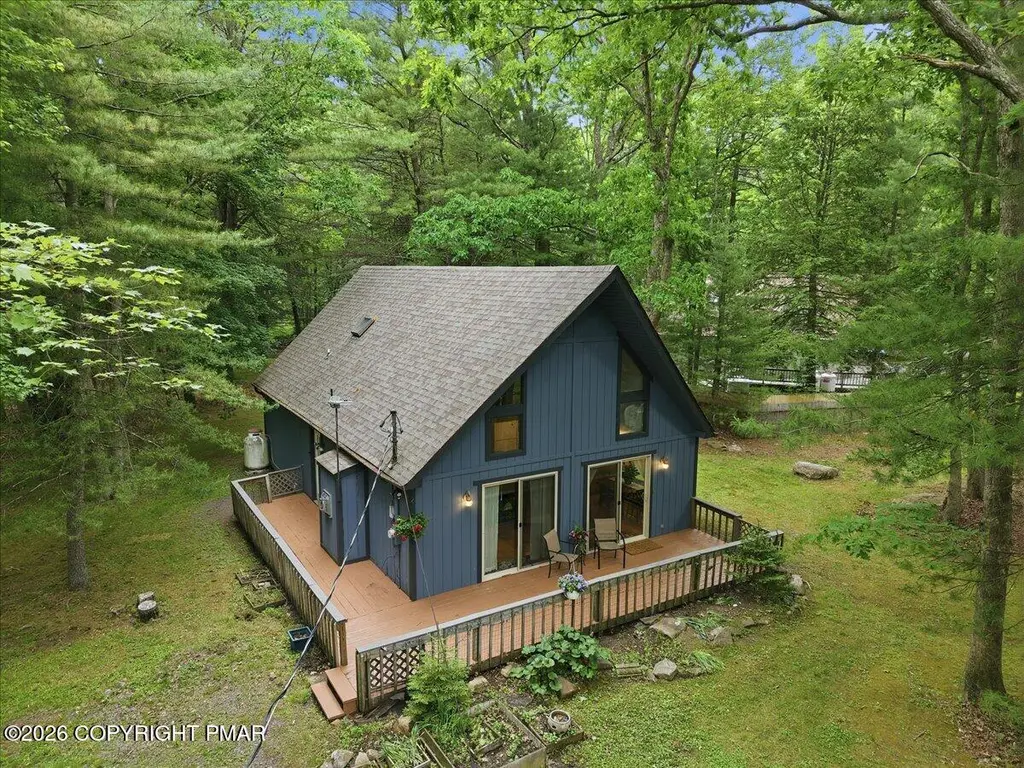
Listing remarks
This home won't last long and is priced to sell in Towamensing Trails! The first floor features an open-concept layout with two bedrooms, a full bathroom, a spacious living room with vaulted ceilings, a gas fireplace, and an abundance of windows that fill the home with natural light. The kitchen offers plenty of cabinet space and a comfortable dining area for everyday meals and entertaining. The second floor boasts a private primary bedroom suite with a full bathroom and an open loft overlooking the living area below. Situated on a beautiful, flat, partially wooded 0.51-acre lot, this property offers both privacy and outdoor enjoyment. Towamensing Trails is a short-term rental friendly comm
Key facts
- 190-acre lake
- Community amenities
- Gas fireplace
Tags
Property features AI
Finance
- Other: Located in the Towamensing Trails subdivision; Private maintained paved road access
- HOA & community: Homeowners association (annual fee $670; approx. $55.83/month); HOA covers trash and security; Community amenities include clubhouse, picnic area, playground, tennis courts, and pool
Exterior
- Parking: 3 total parking spaces; Open parking (3 spaces); Paved driveway
- Security: Community security (HOA amenity)
- Utilities: Well water; Mound septic system; Electric service with circuit breakers
- Home design: Single-family house; Residential property; No common walls
- Construction: Asphalt shingle roof
- Exterior features: Deck; Rain gutters; Shed(s); Back yard and front yard, cleared
Interior
- Kitchen: Electric range; Refrigerator; Dishwasher; Microwave
- Bedrooms: Unfurnished
- Flooring: Carpet; Ceramic tile; Laminate; Wood
- Bathrooms: 2 full bathrooms
- Heating & cooling: Baseboard heating (electric); Ceiling fans for cooling
- Interior features: Vaulted ceilings; Open floorplan; Ceiling fans; Living room fireplace with propane and stone surround; Crawl space basement with sump pump
- Laundry & utility: Washer; Dryer; Laundry closet on main level
Neighborhood map
What this means for you Summary
Snapshot
- This is a 3-bed/2.0-bath single-family listed at $265k.
Deal economics
- At list price, monthly cash flow is $-49 ($-592/yr) — negative.
- To cash-flow at today's rent, offer at most $256k (3.3% below list).
- To meet the 1% rule (rent ≥ 1% of price), the offer needs to be $216k (18.4% below list).
- Recommended offer: $216k (18.4% below list) — sets the bar for 1% rule.
Location & tenants
- Location reads: area grade D — affects rentability + tenant quality, not the cash-flow math above.
- Jim Thorpe Area SD (rural): math 25% / reading 47% proficiency, ranked #394 of 539 in PA (top 73%) — families likely to look elsewhere, expect single-tenant / working-renter base with shorter leases.
- Zoned schools: Penn-Kidder Campus (math 18% / reading 45%, grade F, #1,112 of 1,518 statewide, top 73%, 571 students, 62% FRL); Jim Thorpe Area Hs (math 62% / reading 75%, grade B, #53 of 437 statewide, top 13%, 565 students, 45% FRL) — zoned schools average 54% FRL vs 38% district-wide (16 pts higher); higher-poverty schools than district average — tighter screening recommended.
- Zoned-school proficiency averages 50% at this address vs 36% district-wide (+14 pts) — the actual schools serving this property are materially stronger than the Jim Thorpe Area SD average implies; a family-tenant draw the district grade alone would hide.
- Market conditions: 456 active listings in the ZIP; 180 units permitted in Carbon County in 2024 (10 in 5+ unit buildings).
Forward outlook
- Local home prices are declining (-2.9%/yr); year-one equity from $2k of loan paydown is wiped out by about $8k of value loss. Plan a longer hold.
- Carbon County population projected at -18% by 2050 — secular population decline; favor cash flow + early exit over multi-decade hold.
Negotiation context
- Only 8 days on market — expect competitive offers; lowballing is unlikely to land.
Questions for the listing agent
- What do current leases actually rent for vs. the listed asking? Can we see a recent rent roll and the last 12 months of T-12 income?
- What does the HOA fee cover, when was the last increase, and are there any pending special assessments or reserve-fund shortfalls?
- Is there a deadline driving the sale (1031 exchange, divorce, estate, relocation)? That informs how much negotiation room exists.
- The area grade is low — what's the realistic commute time and amenity access for the typical tenant pool here? Any planned neighborhood developments (good or bad) we should know about?
- What's the average days-on-market for RENTAL listings here right now (not sales)? A rising rental-DOM trend means longer vacancies and softer asking-rent achievability than the comps imply.
- What's the recent tenant-quality profile in this submarket — average credit score on applications, eviction rate, late-payment / NSF rate, and stable-employment percentage? A property-management company in the area should have these aggregated.
- How much new for-sale + rental construction is in the pipeline within 1–3 miles? Heavy new supply typically softens prices + rents 12–24 months out; constrained supply supports both.
Investment metrics
- 1% rule
- 0.82% ✗
- Cap rate
- 6.07%
- Cash-on-cash
- -0.80%
- DSCR
- 0.96
- GRM
- 10.2
CMA / ARV
- ARV (on-the-fly)
- $321,216
- Comps found
- 12
Show comp detail 12 sales within ~0.75 mi
| Address | Dist | Beds/Ba | Sqft | Sold | Price | $/sf | Match |
|---|---|---|---|---|---|---|---|
| 211 Keats Ln | 0.34mi | 3/2.0 | 1,376 (+2%) | 11mo | $350,000 | $254 | 71 |
| 96 Spencer Ln | 0.21mi | 3/2.0 | 1,470 (+9%) | 10mo | $329,000 | $224 | 66 |
| 147 Eliot Ln | 0.50mi | 3/2.0 | 1,317 (-2%) | 9mo | $315,000 | $239 | 66 |
| 944 Old Stage Rd | 0.14mi | 3/2.0 | 1,520 (+13%) | 7mo | $290,000 | $191 | 66 |
| 127 Eliot Ln | 0.51mi | 2/1.5 (-1) | 1,372 (+2%) | 3mo | $210,000 | $153 | 63 |
| 71 Pope Ln | 0.39mi | 2/3.0 (-1) | 1,365 (+2%) | 10mo | $329,000 | $241 | 62 |
| 65 Byron Ln | 0.60mi | 4/2.0 (+1) | 1,380 (+3%) | 2mo | $345,000 | $250 | 61 |
| 133 Kipling Ln | 0.27mi | 3/2.0 | 1,500 (+12%) | 11mo | $365,000 | $243 | 59 |
| 50 Poe Trl | 0.56mi | 3/1.0 | 1,432 (+6%) | 5mo | $369,900 | $258 | 55 |
| 139 Eliot Ln | 0.50mi | 3/1.0 | 1,248 (-7%) | 10mo | $266,000 | $213 | 53 |
| 60 Spencer Ln | 0.23mi | 4/3.0 (+1) | 1,518 (+13%) | 8mo | $290,000 | $191 | 52 |
| 25 Byron Ln | 0.59mi | 3/2.0 | 1,519 (+13%) | 8mo | $275,000 | $181 | 44 |
Match score weights: distance 35% · size 25% · config 20% · recency 20%. Top-matched comps best support the ARV.
Projected returns pro-forma
-2.89% appreciation · 3.0% rent growth · sell at horizon
- IRR
- -16.9%
- Equity multiple
- 0.40×
- Total profit
- $-44,842
- Equity at exit
- $40,848
- IRR
- -8.9%
- Equity multiple
- 0.43×
- Total profit
- $-42,079
- Equity at exit
- $25,213
Cash invested: $74,200 (down + closing). Projections, not guarantees.
Landlord ↔ Tenant lean methodology
- Overall (STATE)
- 62 Landlord-Friendly
- State Pennsylvania
- 62 Landlord-Friendly · EVEN
- County
- — inherits STATE
- City
- — inherits STATE
ZIP-level market 18210
- Home prices YoY
- -1.4%
- Active inventory
- 456
- Price-to-rent
- 10.2×
Monthly cashflow live
- Estimated rent
- $2,161 medium interval (Pro) →
- Mortgage (P&I)
- −$1,390
- Tax from tax record
- −$201 /mo · $2,409/yr
- Insurance
- −$110
- HOA
- −$56
- Vacancy / Maint / Mgmt
- −$454
- Net cashflow
- $-49
Break-even live
Sensitivity live
| Price | -10% $101 | -5% $26 | +0% $-49 | +5% $-124 | +10% $-199 |
|---|---|---|---|---|---|
| Rent | -10% $-220 | -5% $-135 | +0% $-49 | +5% $36 | +10% $121 |
| Rate | -1.0pp $84 | -0.5pp $18 | base $-49 | +0.5pp $-118 | +1.0pp $-188 |
UW: 25.0% down · 7.5% · 30yr · 1.5% tax · 5.0% vac · 8.0% maint · 8.0% mgmt
Financing live
Cash to close
- Down payment
- $66,250
- Closing costs
- $7,950
- Reserves months
- —
- Total cash needed
- —
Loan-product check · same deal, 3 products live
Conventional
25% down · 7.5% · 30yr
- Down + closing
- —
- Monthly P&I
- —
- Monthly cashflow
- —
- DSCR
- —
- Eligible?
- —
Personal DTI + credit; lowest rate.
DSCR
20% down · 8.5% · 30yr
- Down + closing
- —
- Monthly P&I
- —
- Monthly cashflow
- —
- DSCR
- —
- Eligible?
- —
No personal income docs; deal must DSCR.
Hard money
10% down · 12.0% · 12mo
- Down + closing
- —
- Monthly P&I
- —
- Monthly cashflow
- —
- DSCR
- —
- Eligible?
- —
Short-term bridge; refi at stabilization.
HOA detail
- Monthly dues
- $56 · $672/yr
- Likely covers
- gas
Listing history 7 events
-
2026-06-22statusdays on market $265,000 Pending 8 DOM
-
2026-06-18days on market $265,000 Active 6 DOM
-
2026-06-17days on market $265,000 Active 5 DOM
-
2026-06-16days on market $265,000 Active 4 DOM
-
2026-06-15days on market $265,000 Active 3 DOM
-
2026-06-14remarks 699-char remark
-
2026-06-14$265,000 Active 1 DOM
ⓘ Source: listings_history table (triggers on properties + properties_extension) + one-shot
backfill from property_details.listing_events for pre-trigger history.
Tax reassessment forecast PA · Partial reset (capped growth)
- Current annual tax
- $2,409 · $201/mo
- Projected year-2 tax
- $3,298 · $275/mo
- Expected delta
- +$889/yr (+$74/mo · 36.9%)
ⓘ Screening estimate from a state-policy table — verify with the county assessor before closing.
Climate risk First Street
- Flood 1/10 Low FEMA zone X (unshaded) · 0% chance over 30 yrs
- Wildfire 4/10 Moderate
- Heat 2/10 Low 7 d/yr ≥90°F today · 16 d/yr by 30 yrs out
- Wind 4/10 Moderate 8% chance of damaging wind over 30 yrs
- Air quality 2/10 Low 1 unhealthy d/yr today · 2 by 30 yrs out
Nearby sold comps map
Loading sold comps map…
Walkable amenities ~0.75 mi
Loading nearby amenities…
Taxation est. · year 1
- Rental income
- $25,937
- − Mortgage interest
- −$14,844
- − Property taxes
- −$2,409
- − Insurance
- −$1,325
- − Repairs & maintenance
- −$2,075
- − Management
- −$2,075
- − HOA
- −$672
- − Depreciation
- −$7,709
- Taxable loss
- −$5,172
- Est. tax savings @ 24.0%
- +$1,241
- After-tax cash flow
- $649/yr
For passive investors: Depreciation is non-cash, so a rental often shows a tax loss while cash-flowing — sheltering income. Rental losses are passive: they offset passive income freely, and up to $25,000/yr can offset ordinary (W-2) income if you actively participate and your MAGI is under $100k (phasing out to $0 by $150k); unused losses carry forward. On sale, claimed depreciation is recaptured at up to 25%, and gains may owe capital-gains tax (a 1031 exchange can defer both). Figures are a year-1 estimate at your 24.0% rate — not tax advice; consult a CPA.
Schools (NCES district)
- District
- Jim Thorpe Area SD
- NCES district ID
- 4212540
- Math proficiency
- 25% ▼ -12.00%
- Reading proficiency
- 47% ▼ -11.00%
- Median HH income
- $53,476
- Composite
- 31.42/100
- National rank
- #5988
- State rank
- #394 of 539 in PA
Livability — Penn Forest
No livability data for this city. (Only ~50 U.S. cities are tracked.)
Census & demographics
- Census place
- Towamensing Trails, PA
- Population (ZIP)
- 7,879
Population outlook (Carbon County) Hauer SSP2
- Today (2025)
- 61,643 people
- By 2030
- 59,840 · -2.9%
- By 2040
- 55,413 · -10.1%
- By 2050
- 50,843 · -17.5%
- By 2075
- 43,326 · -29.7%
- By 2100
- 37,126 · -39.8%
Race, ethnicity, and origin ACS 2023
- Neighborhood character
- Predominantly White (69%)
- Race & ethnicity
- White 69% Hispanic / Latino 22% Two or more races 11% Black 6% Native American 1% Asian 1%
- Hispanic origin (detail)
- Puerto Rican 12% Cuban 2% Dominican 1%
- Common ancestry
- Romanian 8% Russian 4% Iranian 2%
- Foreign-born
- 12% · Canada
- Languages at home
- 81% English-only · Spanish 10% Russian/Polish/Slavic 7% Other Indo-European 1%
Political lean MEDSL · Carbon
- 2024 margin
- Solid R (+34.8) · D 32.2% · R 67.0%
- 2008→2024 swing
- -36.7pp toward R · 2008: 1.9pp · 2024: -34.8pp
- All cycles
- 2024: R+34.8 2020: R+32.0 2016: R+34.1 2012: R+6.9 2008: D+1.9
Not yet ingested
- Civics
- —
Market trends
- HPI YoY
- ▼ -2.89%
- Current HPI
- 203.8099
- Rent YoY
- —
- Metro
- —
- State GDP YoY
- ▲ 1.68%
- F500 in state
- 34
Industry mix (Fortune 500 HQ in PA)
| Industry | F500 HQs | Revenue |
|---|---|---|
| Healthcare | 2 | $309B |
|
||
| Insurance | 2 | $27B |
|
||
| Telecommunications / Media | 1 | $124B |
|
||
| Industrial Distribution | 1 | $22B |
|
||
| Financial Services | 1 | $20B |
|
||
| Chemicals / Materials | 1 | $18B |
|
||
Price history
1 event — show timeline
- 2026-06-12 Listed $265,000 PMAR
Property tax history
+1.7%/yrLatest (2026): $2,409 · +5.4% YoY. Source: county tax records.
Cash-flow waterfall
monthlySold comps — $/sqft
last 12 mo · ≤1 miLoading sold comps…