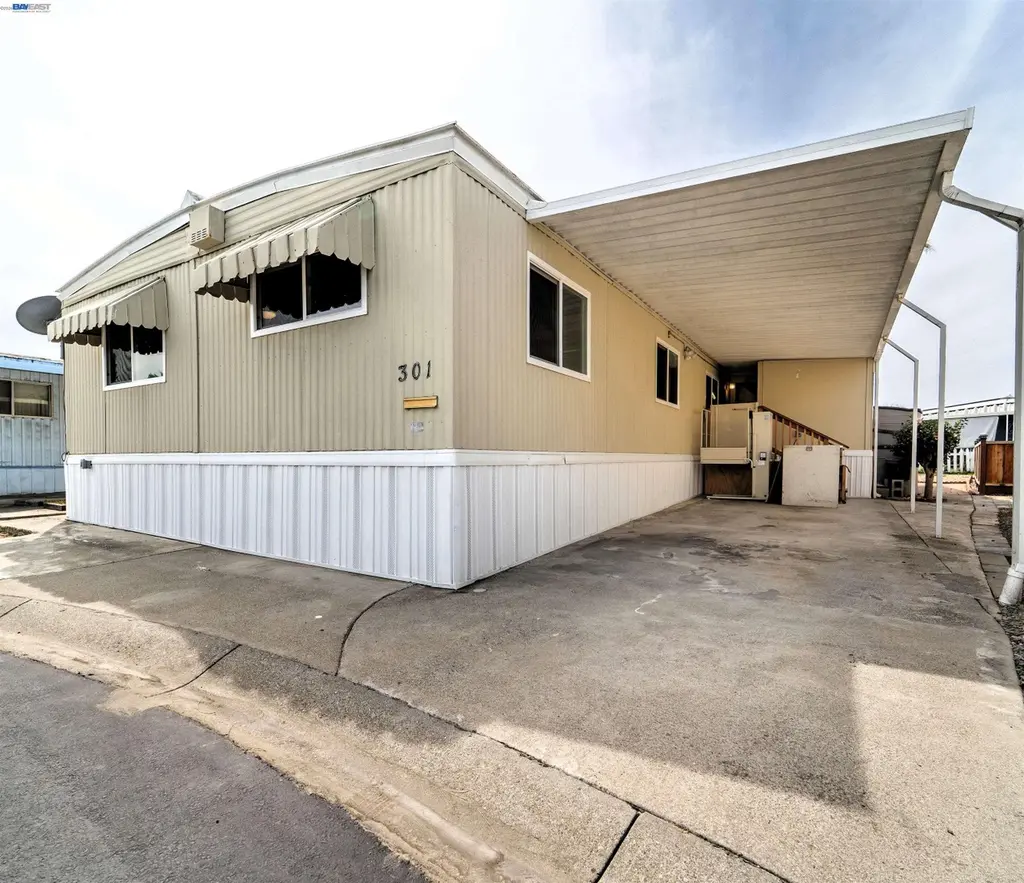
301 Maui Cir · Union City, CA
Flood risk 3/10 · Minor
- FEMA flood zone
- X (unshaded)
- Chance of flooding over 30 yrs
- 0.18%
- Est. flood insurance / yr
- $507 – $1,088
Fire risk 1/10 · Minimal
- Est. fire insurance / yr
- $659 – $1,223
Heat risk 4/10 · Minor
- Hot days now (above 90°F)
- 7 days/yr
- Hot days in 30 yrs
- 14 days/yr
Wind risk 1/10 · Minimal
- Chance of severe wind over 30 yrs
- —
Air-quality risk 7/10 · Major
- Unhealthy air days now
- 12 days/yr
- Unhealthy air days in 30 yrs
- 12 days/yr
Risk factors via First Street. Map © Google.
Why this score? — see what drove the B- grade
The composite is a weighted blend of 9 inputs, each scored 0–100. Each bar is that input's sub-score; the figure is the points it added to the 100-point composite (weight × sub-score).
- Cash flow +30.0/30.0
- DSCR +10.0/10.0
- 1% rule +9.3/10.0
- Schools +5.1/10.0
- Condition / age +3.8/5.0
- Livability +3.7/5.0
- Rent growth +3.4/5.0
- ARV discount +0.0/15.0
- Appreciation +0.0/10.0
$270,000
🖨 Deal sheet (PDF) 📄 Offer letter ✓ Due diligence
Listing remarks MLS
Wow! 1680 sq ft 3 bedroom/2 bath home in the Tropics Senior Park on a cul-de-sac! New flooring, updated electrical and plumbing. Comes fully equipped with appliances including newer oven and stove! Large fully covered patio room provides more space for an office or crafts! High-end chair lift system installed! Updated hall shower! Extra storage room and shed! Extra parking pad! Garden area! Community pool and spa! This is a rare opportunity!
Key facts
- Updated electrical
- New flooring
- Updated plumbing
Tags
Neighborhood map
What this means for you Summary
Snapshot
- This is a 3-bed/2.0-bath manufactured listed at $270k. Condition is rated good.
Deal economics
- At list price, monthly cash flow is $1k ($14k/yr) — positive.
- The deal already cash-flows at list — no discount required.
- Meets the 1% rule at list price ($4k rent vs $270k).
- Recommended offer: $254k (6.0% below list) — sets the bar for market timing.
- Cap rate 11.6% vs local median 1.7% in Union City — top-decile yield for the area; either an underpriced asset or a hidden risk that comps aren't pricing in. Stress-test before assuming the spread holds.
Location & tenants
- Location reads 73/100 on livability (#150 in CA) — a middle-class / working-renter tenant base. Strengths: commute A+, employment A+, health & safety A+; Watch: crime D, amenities D, cost of living F.
- New Haven Unified (suburban): math 43% / reading 69% proficiency, ranked #85 of 517 in CA (top 16%) — acceptable for families but not a draw, mixed tenant base, ~2y average lease.
- Zoned schools: Tom Kitayama Elementary (615 students, 34% FRL); Cesar Chavez Middle (1,012 students, 49% FRL); James Logan High (math 46% / reading 71%, grade C, #223 of 1,170 statewide, top 19%, 3,315 students, 38% FRL) — zoned schools at 40% FRL track the district average.
- Market conditions: Rents rising (+3.5%/yr); 150 active listings in the ZIP; 19 comparable units currently listed for rent nearby; rentals at typical pace (median 15d on market — plan ~3-4 weeks tenant-placement turnaround); high-income renter base; 1,742 units permitted in Alameda County in 2024 (856 in 5+ unit buildings).
- This rent runs 35% of the median local income ($134k/yr) — at the standard rent-burdened threshold; future hikes will face affordability resistance.
Forward outlook
- Local home prices are declining (-3.0%/yr); year-one equity from $2k of loan paydown is wiped out by about $8k of value loss. Plan a longer hold.
- Alameda County population projected at +34% by 2050 — long-run rental-demand tailwind backs the buy-and-hold thesis.
- At projected returns (-3.0% appreciation + 3.5% rent growth), your $76k cash investment doubles in ~7 years — after that, you're playing with house money.
Negotiation context
- It's been on market 78 days — a 6% lower offer ($254k) is reasonable based on typical stale-listing flexibility.
Questions for the listing agent
- It's been on market 78 days. Have you received any prior offers? Is the seller open to a 6% concession, seller financing, or rate buy-down credit?
- Why hasn't it sold? Are there any deal-killer items the seller is aware of (foundation, flood, title, zoning, code violations)?
- Is there a deadline driving the sale (1031 exchange, divorce, estate, relocation)? That informs how much negotiation room exists.
- Schools are B-rated — typically a magnet for longer-tenancy family renters. What's the average tenant stay here, and is there a school-zone premium baked into asking?
- Crime grade is D in this area — have there been break-ins, vandalism, or insurance claims at this property in the last 3 years? What carrier currently insures it and at what premium?
- What's the average days-on-market for RENTAL listings here right now (not sales)? A rising rental-DOM trend means longer vacancies and softer asking-rent achievability than the comps imply.
- What's the recent tenant-quality profile in this submarket — average credit score on applications, eviction rate, late-payment / NSF rate, and stable-employment percentage? A property-management company in the area should have these aggregated.
- How much new for-sale + rental construction is in the pipeline within 1–3 miles? Heavy new supply typically softens prices + rents 12–24 months out; constrained supply supports both.
Investment metrics
- 1% rule
- 1.43% ✓
- Cap rate
- 11.60%
- Cash-on-cash
- 18.95%
- DSCR
- 1.84
- GRM
- 5.8
CMA / ARV
- ARV (median comp)
- $218,491
- List price
- $270,000
- Delta
- 23.58%
- Verdict
- OVERPRICED
- Comps
- 18 within 1.0 mi
Show comp detail 12 sales within ~0.75 mi
| Address | Dist | Beds/Ba | Sqft | Sold | Price | $/sf | Match |
|---|---|---|---|---|---|---|---|
| 222 Hula Cir #222 | 0.19mi | 3/2.0 | 1,620 (-4%) | 12mo | $390,000 | $241 | 75 |
| 289 Maui Cir | 0.04mi | 3/2.0 | 1,541 (-8%) | 12mo | $432,500 | $281 | 75 |
| 174 Kona Cir | 0.16mi | 3/2.0 | 1,532 (-9%) | 12mo | $428,000 | $279 | 68 |
| 269 Oahu | 0.07mi | 2/2.0 (-1) | 1,440 (-14%) | 1mo | $285,000 | $198 | 67 |
| 324 Waikiki Cir | 0.07mi | 2/2.0 (-1) | 1,440 (-14%) | 3mo | $165,000 | $115 | 65 |
| 51 Palm Dr | 0.12mi | 2/2.0 (-1) | 1,440 (-14%) | 9mo | $225,000 | $156 | 58 |
| 198 Hawaii Cir | 0.16mi | 2/2.0 (-1) | 1,464 (-13%) | 10mo | $185,000 | $126 | 58 |
| 167 Kona Cir | 0.19mi | 2/2.0 (-1) | 1,440 (-14%) | 7mo | $247,000 | $172 | 57 |
| 537 Cumana Cir | 0.26mi | 2/2.0 (-1) | 1,440 (-14%) | 11mo | $200,000 | $139 | 50 |
| 123 Madrone Way | 0.45mi | 2/2.0 (-1) | 1,440 (-14%) | 13mo | $196,000 | $136 | 39 |
| 4141 Deepcreek #106 | 0.53mi | 2/2.0 (-1) | 1,440 (-14%) | 9mo | $130,000 | $90 | 38 |
| 4141 Deep Creed Rd #129 | 0.51mi | 2/2.0 (-1) | 1,440 (-14%) | 12mo | $235,000 | $163 | 38 |
Match score weights: distance 35% · size 25% · config 20% · recency 20%. Top-matched comps best support the ARV.
Projected returns pro-forma
-3.0% appreciation · 3.49% rent growth · sell at horizon
- IRR
- 11.4%
- Equity multiple
- 1.45×
- Total profit
- $34,264
- Equity at exit
- $40,258
- IRR
- 20.8%
- Equity multiple
- 2.80×
- Total profit
- $135,938
- Equity at exit
- $23,345
Cash invested: $75,600 (down + closing). Projections, not guarantees.
Landlord ↔ Tenant lean methodology
- Overall (STATE)
- 18 Strongly Tenant-Friendly
- State California
- 18 Strongly Tenant-Friendly · D+13
- County
- — inherits STATE
- City
- — inherits STATE
ZIP-level market 94587
- Rents YoY
- 3.5%
- Active inventory
- 150
- Price-to-rent
- 5.8×
Monthly cashflow live
- Estimated rent
- $3,873 high interval (Pro) →
- Mortgage (P&I)
- −$1,416
- Tax est. 1.5%
- −$338 /mo · $4,050/yr
- Insurance
- −$112
- HOA
- −$0
- Vacancy / Maint / Mgmt
- −$813
- Net cashflow
- $1,194
Break-even live
Sensitivity live
| Price | -10% $1,380 | -5% $1,287 | +0% $1,194 | +5% $1,101 | +10% $1,007 |
|---|---|---|---|---|---|
| Rent | -10% $888 | -5% $1,041 | +0% $1,194 | +5% $1,347 | +10% $1,500 |
| Rate | -1.0pp $1,330 | -0.5pp $1,263 | base $1,194 | +0.5pp $1,124 | +1.0pp $1,053 |
UW: 25.0% down · 7.5% · 30yr · 1.5% tax · 5.0% vac · 8.0% maint · 8.0% mgmt
Financing live
Cash to close
- Down payment
- $67,500
- Closing costs
- $8,100
- Reserves months
- —
- Total cash needed
- —
Loan-product check · same deal, 3 products live
Conventional
25% down · 7.5% · 30yr
- Down + closing
- —
- Monthly P&I
- —
- Monthly cashflow
- —
- DSCR
- —
- Eligible?
- —
Personal DTI + credit; lowest rate.
DSCR
20% down · 8.5% · 30yr
- Down + closing
- —
- Monthly P&I
- —
- Monthly cashflow
- —
- DSCR
- —
- Eligible?
- —
No personal income docs; deal must DSCR.
Hard money
10% down · 12.0% · 12mo
- Down + closing
- —
- Monthly P&I
- —
- Monthly cashflow
- —
- DSCR
- —
- Eligible?
- —
Short-term bridge; refi at stabilization.
Rent comps 19 comps
| Address | Beds | Baths | Sqft | Rent | $/sqft | DOM | Units | Dist |
|---|---|---|---|---|---|---|---|---|
| 3842 Cardinal Ter Fremont, CA | 3.0 | 2.5 | 1607 | $4,100 | $2.55 | 19d | 1 | 0.45mi |
| 33877 Raven Ter Fremont, CA | 2.0 | 1.5 | 1315 | $3,700 | $2.81 | 16d | 1 | 0.51mi |
| 3716 Harlequin Ter Fremont, CA | 4.0 | 2.5 | 1855 | $4,500 | $2.43 | 45d | 1 | 0.52mi |
| 32725 Hilmar St Union City, CA | 4.0 | 3.0 | 2080 | $4,440 | $2.13 | 3d | 1 | 0.77mi |
| 33411 Madelyn Ter Union City, CA | 2.0 | 2.5 | 1441 | $3,798 | $2.64 | 19d | 1 | 0.80mi |
| 4123 Asimuth Cir Union City, CA | 3.0 | 1.5 | 1280 | $3,350 | $2.62 | 45d | 1 | 0.86mi |
| 32805 Palmdale Ct Union City, CA | 4.0 | 3.0 | 1962 | $4,900 | $2.50 | 0d | 1 | 0.88mi |
| 4292 Comet Cir Union City, CA | 3.0 | 1.5 | 1250 | $2,950 | $2.36 | 26d | 1 | 0.96mi |
| 34426 Bentley Pl Fremont, CA | 3.0 | 2.0 | 1290 | $3,500 | $2.71 | 22d | 1 | 0.96mi |
| 2449 Almaden Blvd Union City, CA | 3.0 | 2.0 | 1565 | $4,495 | $2.87 | 3d | 1 | 0.98mi |
| 4163 Rainbow Ter Fremont, CA | 4.0 | 2.5 | 1474 | $3,695 | $2.51 | 0d | 1 | 1.15mi |
| 4132 Jamaica Ter Fremont, CA | 3.0 | 1.5 | 1166 | $2,890 | $2.48 | 0d | 1 | 1.16mi |
| 3307 San Marco Ct Union City, CA | 3.0 | 2.0 | 1349 | $3,900 | $2.89 | 4d | 1 | 1.24mi |
| 2506 Balmoral St Union City, CA | 4.0 | 2.5 | 2008 | $3,500 | $1.74 | 14d | 1 | 1.25mi |
| 34897 Busby Way Fremont, CA | 3.0 | 2.5 | 1950 | $5,000 | $2.56 | 19d | 1 | 1.27mi |
| 4806 Balthazar Ter Fremont, CA | 3.0 | 3.0 | 1755 | $4,250 | $2.42 | 0d | 1 | 1.27mi |
| 3221 San Carlos Way Union City, CA | 3.0 | 2.0 | 1396 | $3,795 | $2.72 | 5d | 1 | 1.30mi |
| 32468 Deborah Dr Union City, CA | 3.0 | 2.0 | 1340 | $3,949 | $2.95 | 26d | 1 | 1.35mi |
| 4402 Queen Anne Dr Union City, CA | 3.0 | 2.0 | 1357 | $4,200 | $3.10 | 3d | 1 | 1.50mi |
Listing history 11 events
-
2026-06-13statusdays on market $270,000 Pending 78 DOM
-
2026-06-09days on market $270,000 Active 77 DOM
-
2026-06-08days on market $270,000 Active 76 DOM
-
2026-06-07days on market $270,000 Active 75 DOM
-
2026-06-04days on market $270,000 Active 72 DOM
-
2026-06-03days on market $270,000 Active 71 DOM
-
2026-06-02days on market $270,000 Active 70 DOM
-
2026-06-01days on market $270,000 Active 69 DOM
-
2026-05-31days on market $270,000 Active 68 DOM
-
2026-04-22price $298,800 445-char remark
Show marketing remark (445 chars)
Wow! 1680 sq ft 3 bedroom/2 bath home in the Tropics Senior Park on a cul-de-sac! New flooring, updated electrical and plumbing. Comes fully equipped with appliances including newer oven and stove! Large fully covered patio room provides more space for an office or crafts! High-end chair lift system installed! Updated hall shower! Extra storage room and shed! Extra parking pad! Garden area! Community pool and spa! This is a rare opportunity!
-
2026-03-24$310,000 Active 445-char remark
Show marketing remark (445 chars)
Wow! 1680 sq ft 3 bedroom/2 bath home in the Tropics Senior Park on a cul-de-sac! New flooring, updated electrical and plumbing. Comes fully equipped with appliances including newer oven and stove! Large fully covered patio room provides more space for an office or crafts! High-end chair lift system installed! Updated hall shower! Extra storage room and shed! Extra parking pad! Garden area! Community pool and spa! This is a rare opportunity!
ⓘ Source: listings_history table (triggers on properties + properties_extension) + one-shot
backfill from property_details.listing_events for pre-trigger history.
Climate risk First Street
- Flood 3/10 Moderate FEMA zone X (unshaded) · 18% chance over 30 yrs
- Wildfire 1/10 Low
- Heat 4/10 Moderate 7 d/yr ≥90°F today · 14 d/yr by 30 yrs out
- Wind 1/10 Low
- Air quality 7/10 Severe 12 unhealthy d/yr today · 12 by 30 yrs out
Nearby sold comps map
Loading sold comps map…
Walkable amenities ~0.75 mi
Loading nearby amenities…
Taxation est. · year 1
- Rental income
- $46,478
- − Mortgage interest
- −$15,124
- − Property taxes
- −$4,050
- − Insurance
- −$1,350
- − Repairs & maintenance
- −$3,718
- − Management
- −$3,718
- − Depreciation
- −$7,855
- Taxable income
- $10,663
- Est. tax owed @ 24.0%
- −$2,559
- After-tax cash flow
- $11,767/yr
For passive investors: Depreciation is non-cash, so a rental often shows a tax loss while cash-flowing — sheltering income. Rental losses are passive: they offset passive income freely, and up to $25,000/yr can offset ordinary (W-2) income if you actively participate and your MAGI is under $100k (phasing out to $0 by $150k); unused losses carry forward. On sale, claimed depreciation is recaptured at up to 25%, and gains may owe capital-gains tax (a 1031 exchange can defer both). Figures are a year-1 estimate at your 24.0% rate — not tax advice; consult a CPA.
Condition & rehab AI · 12 photos
This 3-bedroom/2-bath manufactured home in the Tropics Senior Park is in good condition with cosmetic updates needed. It offers a spacious living area, a fully covered patio, and a high-end chair lift system. The property is move-in ready with a few minor repairs and maintenance items to address.
Repairs flagged
- Minor Awning — Worn fabric
- Minor Kitchen Countertops — Tiled, could be replaced
Value-add opportunities
- Resale Paint interior walls — Enhances curb appeal and interior aesthetics
- Resale Replace awning fabric — Improves curb appeal and functionality
- Resale Replace kitchen countertops — Modernizes the kitchen and adds value
- Both Landscaping — Enhances curb appeal and adds value to the property
Renovation cost estimate screening
| Repair item | Severity | Est. cost |
|---|---|---|
| Awning · Worn fabric | Minor | $500–3,000 |
| Kitchen Countertops · Tiled, could be replaced | Minor | $500–3,000 |
| Total estimated repair cost · 2 items | $1,000–6,000 |
Value-add ROI direction
- Resale Paint interior walls — Enhances curb appeal and interior aesthetics ↑
- Resale Replace awning fabric — Improves curb appeal and functionality ↑
- Resale Replace kitchen countertops — Modernizes the kitchen and adds value ↑
- Both Landscaping — Enhances curb appeal and adds value to the property ↑
ⓘ Cost ranges are severity-bucket heuristics (US national rule-of-thumb). Get contractor quotes + a written scope before underwriting a rehab budget.
Schools (NCES district)
- District
- New Haven Unified
- NCES district ID
- 0626910
- Math proficiency
- 43% ▲ 1.00%
- Reading proficiency
- 69% ▲ 18.00%
- Median HH income
- $87,202
- Composite
- 51.21/100
- National rank
- #1754
- State rank
- #85 of 517 in CA
Livability — Union City
- Score
- 73/100
- State rank
- #150
- US rank
- #5027
Category grades
Schools grade is shown separately in the Schools card above.
Census & demographics
- Census place
- Union City, CA
- County
- Alameda County · 1,614,355 people
- City population
- 67,464
- Metro
- San Francisco-Oakland-Berkeley, CA
- Population (ZIP)
- 67,464
- Household income
- $133,715
- Rent vs Own
- Severe rent burden
- 1565.0
Population outlook (Alameda County) Hauer SSP2
- Today (2025)
- 1,928,884 people
- By 2030
- 2,069,146 · +7.3%
- By 2040
- 2,338,405 · +21.2%
- By 2050
- 2,586,608 · +34.1%
- By 2075
- 3,061,911 · +58.7%
- By 2100
- 3,234,133 · +67.7%
Race, ethnicity, and origin ACS 2023
- Neighborhood character
- Diverse neighborhood (Simpson 0.63)
- Race & ethnicity
- Asian 55% Hispanic / Latino 19% White 15% Two or more races 10% Black 5%
- Hispanic origin (detail)
- Mexican 16%
- Common ancestry
- Russian 1% Slovak 1%
- Foreign-born
- 47% · China, Canada, Vietnam
- Languages at home
- 39% English-only · Spanish 13% Other Indo-European 13% Tagalog/Filipino 12%
Political lean MEDSL · Alameda
- 2024 margin
- Solid D (+53.6) · D 74.6% · R 21.0% · Other 4.4%
- 2008→2024 swing
- -5.9pp toward R · 2008: 59.5pp · 2024: 53.6pp
- All cycles
- 2024: D+53.6 2020: D+62.5 2016: D+64.4 2012: D+59.8 2008: D+59.5
Not yet ingested
- Civics
- —
Market trends
- HPI YoY
- ▼ -1280.49%
- Current HPI
- 343.0333
- Rent YoY
- ▲ 3.49%
- Metro
- San Francisco-Oakland-Berkeley, CA
- State GDP YoY
- ▲ 3.21%
- F500 in state
- 116
Industry mix (Fortune 500 HQ in CA)
| Industry | F500 HQs | Revenue |
|---|---|---|
| Technology | 27 | $1,492B |
|
||
| Financial Services | 3 | $174B |
|
||
| Retail | 3 | $44B |
|
||
| Insurance | 3 | $26B |
|
||
| Media / Entertainment | 2 | $115B |
|
||
| Pharmaceuticals / Biotech | 2 | $62B |
|
||
Price history
-3.6% since first listed2 events — show timeline
- 2026-04-22 Price Changed $298,800 bridgeMLS, Bay East AOR, or Contra Costa AOR
- 2026-03-24 Listed $310,000 bridgeMLS, Bay East AOR, or Contra Costa AOR
Cash-flow waterfall
monthlySold comps — $/sqft
last 12 mo · ≤1 miLoading sold comps…