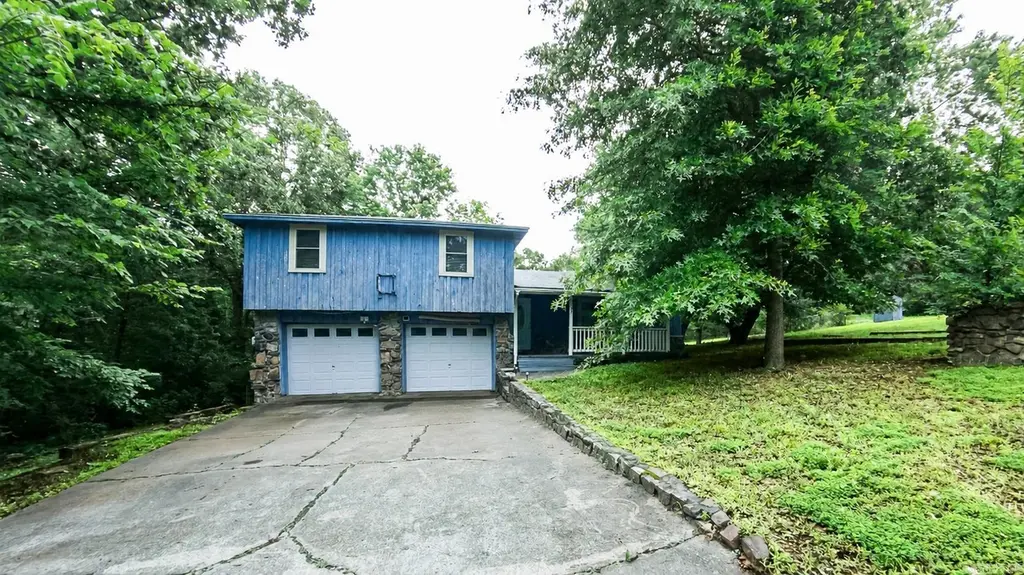
103 Dyson Rd · Austin, AR
Flood risk 1/10 · Minimal
- FEMA flood zone
- X (unshaded)
- Chance of flooding over 30 yrs
- 0.0%
- Est. flood insurance / yr
- $507 – $1,088
Fire risk 5/10 · Moderate
- Est. fire insurance / yr
- $1,499 – $2,785
Heat risk 6/10 · Moderate
- Hot days now (above 110°F)
- 7 days/yr
- Hot days in 30 yrs
- 19 days/yr
Wind risk 3/10 · Minor
- Chance of severe wind over 30 yrs
- 6.0%
Air-quality risk 2/10 · Minimal
- Unhealthy air days now
- 1 days/yr
- Unhealthy air days in 30 yrs
- 1 days/yr
Risk factors via First Street. Map © Google.
Why this score? — see what drove the C grade
The composite is a weighted blend of 9 inputs, each scored 0–100. Each bar is that input's sub-score; the figure is the points it added to the 100-point composite (weight × sub-score).
- Cash flow +23.2/30.0
- ARV discount +7.5/15.0
- DSCR +7.4/10.0
- 1% rule +5.2/10.0
- Schools +4.0/10.0
- Livability +3.7/5.0
- Rent growth +2.5/5.0
- Condition / age +2.5/5.0
- Appreciation +0.0/10.0
$171,500
🖨 Deal sheet 📄 Offer letter ✓ Due diligence
Listing remarks MLS
Beautiful country setting with acreage. Large full fenced yard. House is split level with 4 bedrooms/1 Bath upstairs; Living Rm, Kitchen and Dining on main level and Bonus Rm and 1/2 BA with Laundry on Lower level. Spacious 2 car garage. Back Deck overlooks a large backyard. If space is what you want, this is it. Priced to sell. See agent remarks.
Key facts
- Updated electrical
- Fresh paint
- New ceiling fans
Tags
Property features AI
Finance
- Financial info: Financing options may include conventional loan or cash
Exterior
- Parking: 2-car parking
- Utilities: Private well; Septic system; Electric service (municipal with Entergy)
- Home design: Rock and frame exterior
- Construction: Crawl space foundation; Architectural shingle roof
- Exterior features: Deck; Porch; Fully fenced yard; Outside storage area; Chain link fencing; Paved road access; Sloped, rural lot; not in a subdivision
Interior
- Kitchen: Surface range; Wall oven; Dishwasher; Garbage disposal
- Flooring: Carpet; Wood; Vinyl; Concrete
- Bathrooms: 1 full bath; 1 half bath
- Heating & cooling: Central heat (electric); Central cooling (electric)
- Interior features: Ceiling fan(s); Breakfast bar; Washer connection; Electric water heater; Wood-burning fireplace (site-built); Sheetrock and paneling walls/ceilings
- Laundry & utility: Washer connection
Neighborhood map
What this means for you Summary
Snapshot
- This is a 4-bed/1.5-bath single-family listed at $172k.
Deal economics
- At list price, monthly cash flow is $309 ($4k/yr) — positive.
- The deal already cash-flows at list — no discount required.
- Meets the 1% rule at list price ($2k rent vs $172k).
- Recommended offer: $169k (1.5% below list) — sets the bar for market timing.
- Cap rate 8.5% vs local median 3.6% in Austin — top-decile yield for the area; either an underpriced asset or a hidden risk that comps aren't pricing in. Stress-test before assuming the spread holds.
Location & tenants
- Location reads 73/100 on livability (#21 in AR) — a middle-class / working-renter tenant base. Strengths: employment A+, cost of living A+, housing A+; Watch: schools D+, amenities F, commute F.
- Cabot School District (suburban): math 48% / reading 43% proficiency, ranked #29 of 238 in AR (top 12%) — families likely to look elsewhere, expect single-tenant / working-renter base with shorter leases.
- Market conditions: 59 active listings in the ZIP; 1 comparable units currently listed for rent nearby; 185 units permitted in Lonoke County in 2024 (0 in 5+ unit buildings).
Forward outlook
- Local home prices are declining (-3.0%/yr); year-one equity from $1k of loan paydown is wiped out by about $5k of value loss. Plan a longer hold.
- Lonoke County population projected at +12% by 2050 — modest demand growth; plan on rents tracking national, not racing it.
Negotiation context
- It's been on market 19 days — a 2% lower offer ($169k) is reasonable based on typical stale-listing flexibility.
- 9 sale attempts since 10y ago with the ask held roughly flat each time — persistent listings suggest the price (not the market) is what's stuck; bring a comps-based counter.
- Current owner paid $130k; 32% above their basis — modest negotiation headroom, anchor on the comps not their cost.
Risks & watch-outs
- Climate carrying-cost: moderate wildfire risk; extreme-heat days projected 7→19/yr by 2055 (HVAC capex compounding) — expect insurance premiums to compound above CPI over the hold.
Questions for the listing agent
- Built in 1976 — when were the roof, HVAC, electrical panel, plumbing, and water heater last replaced?
- Is there a deadline driving the sale (1031 exchange, divorce, estate, relocation)? That informs how much negotiation room exists.
- Schools are D-rated, which usually means shorter tenancies and higher turnover. Who's the typical renter profile here, and what's been the actual vacancy rate?
- What's the average days-on-market for RENTAL listings here right now (not sales)? A rising rental-DOM trend means longer vacancies and softer asking-rent achievability than the comps imply.
- What's the recent tenant-quality profile in this submarket — average credit score on applications, eviction rate, late-payment / NSF rate, and stable-employment percentage? A property-management company in the area should have these aggregated.
- How much new for-sale + rental construction is in the pipeline within 1–3 miles? Heavy new supply typically softens prices + rents 12–24 months out; constrained supply supports both.
Investment metrics
- 1% rule
- 1.02% ✓
- Cap rate
- 8.46%
- Cash-on-cash
- 7.73%
- DSCR
- 1.34
- GRM
- 8.2
CMA / ARV
No comps found within radius.
Projected returns pro-forma
-3.0% appreciation · 3.0% rent growth · sell at horizon
- IRR
- -4.5%
- Equity multiple
- 0.83×
- Total profit
- $-8,130
- Equity at exit
- $25,571
- IRR
- 5.1%
- Equity multiple
- 1.38×
- Total profit
- $18,119
- Equity at exit
- $14,828
Cash invested: $48,020 (down + closing). Projections, not guarantees.
Landlord ↔ Tenant lean methodology
- Overall (STATE)
- 92 Strongly Landlord-Friendly
- State Arkansas
- 92 Strongly Landlord-Friendly · R+14
- County
- — inherits STATE
- City
- — inherits STATE
ZIP-level market 72007
- Home prices YoY
- -7.9%
- Active inventory
- 59
- Price-to-rent
- 8.2×
Monthly cashflow live
- Estimated rent
- $1,750 medium interval (Pro) →
- Mortgage (P&I)
- −$899
- Tax from tax record
- −$102 /mo · $1,228/yr
- Insurance
- −$71
- HOA
- −$0
- Vacancy / Maint / Mgmt
- −$368
- Net cashflow
- $309
Break-even live
UW: 25.0% down · 7.5% · 30yr · 1.5% tax · 5.0% vac · 8.0% maint · 8.0% mgmt
Financing live
Cash to close
- Down payment
- $42,875
- Closing costs
- $5,145
- Reserves months
- —
- Total cash needed
- —
Loan-product check · same deal, 3 products live
Conventional
25% down · 7.5% · 30yr
- Down + closing
- —
- Monthly P&I
- —
- Monthly cashflow
- —
- DSCR
- —
- Eligible?
- —
Personal DTI + credit; lowest rate.
DSCR
20% down · 8.5% · 30yr
- Down + closing
- —
- Monthly P&I
- —
- Monthly cashflow
- —
- DSCR
- —
- Eligible?
- —
No personal income docs; deal must DSCR.
Hard money
10% down · 12.0% · 12mo
- Down + closing
- —
- Monthly P&I
- —
- Monthly cashflow
- —
- DSCR
- —
- Eligible?
- —
Short-term bridge; refi at stabilization.
Rent comps 1 comps
| Address | Beds | Baths | Sqft | Rent | $/sqft | DOM | Units | Dist |
|---|---|---|---|---|---|---|---|---|
| 2912 Highway 319 W Austin, AR | 3.0 | 2.0 | 1992 | $1,750 | $0.88 | 14d | 1 | 0.29mi |
Listing history 15 events
-
2026-06-18days on market $171,500 Active 19 DOM
-
2026-06-17days on market $171,500 Active 18 DOM
-
2026-06-16days on market $171,500 Active 17 DOM
-
2026-06-15days on market $171,500 Active 16 DOM
-
2026-06-14days on market $171,500 Active 14 DOM
-
2026-06-10days on market $171,500 Active 11 DOM
-
2026-06-09days on market $171,500 Active 10 DOM
-
2026-06-08days on market $171,500 Active 9 DOM
-
2026-06-07statusdays on market $171,500 Active 8 DOM
-
2026-06-05days on market $171,500 New Listing 5 DOM
-
2026-06-03days on market $171,500 New Listing 4 DOM
-
2026-06-02days on market $171,500 New Listing 3 DOM
-
2026-06-01days on market $171,500 New Listing 2 DOM
-
2026-05-31remarks 531-char remark
-
2026-05-31$171,500 New Listing 1 DOM
ⓘ Source: listings_history table (triggers on properties + properties_extension) + one-shot
backfill from property_details.listing_events for pre-trigger history.
Tax reassessment forecast AR · Resets to sale price
- Current annual tax
- $1,228 · $102/mo
- Projected year-2 tax
- $1,228 · $102/mo
- Expected delta
- $0/yr ($0/mo · 0.0%)
ⓘ Screening estimate from a state-policy table — verify with the county assessor before closing.
Climate risk First Street
- Flood 1/10 Low FEMA zone X (unshaded) · 0% chance over 30 yrs
- Wildfire 5/10 Major
- Heat 6/10 Major 7 d/yr ≥110°F today · 19 d/yr by 30 yrs out
- Wind 3/10 Moderate 6% chance of damaging wind over 30 yrs
- Air quality 2/10 Low 1 unhealthy d/yr today · 1 by 30 yrs out
Nearby sold comps map
Loading sold comps map…
Walkable amenities ~0.75 mi
Loading nearby amenities…
Taxation est. · year 1
- Rental income
- $21,000
- − Mortgage interest
- −$9,607
- − Property taxes
- −$1,228
- − Insurance
- −$858
- − Repairs & maintenance
- −$1,680
- − Management
- −$1,680
- − Depreciation
- −$4,989
- Taxable income
- $959
- Est. tax owed @ 24.0%
- −$230
- After-tax cash flow
- $3,482/yr
For passive investors: Depreciation is non-cash, so a rental often shows a tax loss while cash-flowing — sheltering income. Rental losses are passive: they offset passive income freely, and up to $25,000/yr can offset ordinary (W-2) income if you actively participate and your MAGI is under $100k (phasing out to $0 by $150k); unused losses carry forward. On sale, claimed depreciation is recaptured at up to 25%, and gains may owe capital-gains tax (a 1031 exchange can defer both). Figures are a year-1 estimate at your 24.0% rate — not tax advice; consult a CPA.
Schools (NCES district)
- District
- Cabot School District
- NCES district ID
- 0503750
- Math proficiency
- 48% ▼ -14.00%
- Reading proficiency
- 43% ▼ -10.00%
- Median HH income
- $55,993
- Composite
- 39.66/100
- National rank
- #3912
- State rank
- #29 of 238 in AR
Livability — Austin
- Score
- 73/100
- State rank
- #21
- US rank
- #5280
Category grades
Schools grade is shown separately in the Schools card above.
Census & demographics
- City population
- 9,945
- Population (ZIP)
- 9,945
Population outlook (Lonoke County) Hauer SSP2
- Today (2025)
- 78,072 people
- By 2030
- 80,673 · +3.3%
- By 2040
- 84,977 · +8.8%
- By 2050
- 87,778 · +12.4%
- By 2075
- 91,398 · +17.1%
- By 2100
- 87,858 · +12.5%
Race, ethnicity, and origin ACS 2023
- Neighborhood character
- Predominantly White (90%)
- Race & ethnicity
- White 90% Hispanic / Latino 5% Two or more races 3% Asian 2% Black 1%
- Hispanic origin (detail)
- Mexican 4%
- Common ancestry
- Romanian 3% Italian 1% Portuguese 1%
- Foreign-born
- 1% · Vietnam
- Languages at home
- 96% English-only · Spanish 1% Vietnamese 1%
Political lean MEDSL · Lonoke
- 2024 margin
- Solid R (+53.7) · D 22.2% · R 75.8% · Other 2.0%
- 2008→2024 swing
- -6.2pp toward R · 2008: -47.5pp · 2024: -53.7pp
- All cycles
- 2024: R+53.7 2020: R+52.8 2016: R+53.3 2012: R+50.9 2008: R+47.5
Not yet ingested
- Civics
- —
Market trends
- HPI YoY
- ▼ -16.87%
- Current HPI
- 196.9424
- Rent YoY
- —
- Metro
- —
- State GDP YoY
- ▲ 3.80%
- F500 in state
- 10
Industry mix (Fortune 500 HQ in AR)
| Industry | F500 HQs | Revenue |
|---|---|---|
| Retail | 1 | $681B |
|
||
| Food / Agriculture | 1 | $53B |
|
||
| Retail / Energy | 1 | $22B |
|
||
| Transportation / Logistics | 1 | $12B |
|
||
| Energy | 1 | $4B |
|
||
Price history
+168.0% since first listed30 events — show timeline
- 2026-05-30 Listed $171,500 CARMLS
- 2024-04-26 Sold (MLS) $130,000 CARMLS
- 2024-03-23 Pending — CARMLS
- 2024-03-22 Pending — CARMLS
- 2024-03-13 Listed $124,900 CARMLS
- 2023-04-12 Listing Removed — CARMLS
- 2023-03-13 Price Changed $180,000 CARMLS
- 2023-03-13 Relisted — CARMLS
- 2023-02-22 Contingent — CARMLS
- 2023-01-31 Price Changed $169,500 CARMLS
- 2023-01-04 Relisted — CARMLS
- 2023-01-02 Contingent — CARMLS
- 2022-08-03 Price Changed $179,103 CARMLS
- 2022-07-23 Price Changed $210,000 CARMLS
- 2022-07-13 Listed $240,000 CARMLS
- 2017-03-07 Sold (Public Records) $127,000 Public Records
- 2017-03-06 Pending — CARMLS
- 2017-03-03 Sold (MLS) $127,000 CARMLS
- 2017-01-17 Contingent — CARMLS
- 2017-01-10 Relisted — CARMLS
- 2016-12-29 Contingent — CARMLS
- 2016-12-20 Listed $129,000 CARMLS
- 2016-12-14 Listing Removed — CARMLS
- 2016-11-01 Price Changed $129,000 CARMLS
- 2016-09-13 Listed $139,900 CARMLS
- 2016-09-11 Listing Removed — CARMLS
- 2016-07-16 Price Changed $139,900 CARMLS
- 2016-06-22 Price Changed $149,900 CARMLS
- 2016-06-10 Listed $165,000 CARMLS
- 1981-07-28 Sold (Public Records) $64,000 Public Records
Property tax history
+4.0%/yrLatest (2025): $1,228 · +0.0% YoY. Source: county tax records.
Cash-flow waterfall
monthlySold comps — $/sqft
last 12 mo · ≤1 miLoading sold comps…