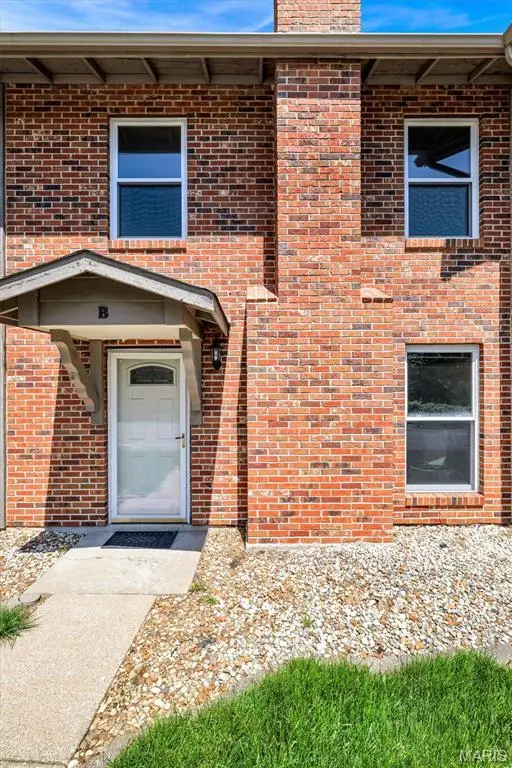
21 Park Charles Blvd S Unit B · St. Peters, MO
Flood risk 1/10 · Minimal
- FEMA flood zone
- X (unshaded)
- Chance of flooding over 30 yrs
- 0.0%
- Est. flood insurance / yr
- $507 – $1,088
Fire risk 1/10 · Minimal
- Est. fire insurance / yr
- $1,054 – $1,958
Heat risk 5/10 · Moderate
- Hot days now (above 107°F)
- 7 days/yr
- Hot days in 30 yrs
- 20 days/yr
Wind risk 2/10 · Minimal
- Chance of severe wind over 30 yrs
- 1.0%
Air-quality risk 2/10 · Minimal
- Unhealthy air days now
- 2 days/yr
- Unhealthy air days in 30 yrs
- 2 days/yr
Risk factors via First Street. Map © Google.
Why this score? — see what drove the B- grade
The composite is a weighted blend of 9 inputs, each scored 0–100. Each bar is that input's sub-score; the figure is the points it added to the 100-point composite (weight × sub-score).
- Cash flow +24.5/30.0
- ARV discount +15.0/15.0
- 1% rule +8.7/10.0
- DSCR +7.9/10.0
- Schools +5.2/10.0
- Rent growth +3.2/5.0
- Livability +2.5/5.0
- Condition / age +2.5/5.0
- Appreciation +0.0/10.0
$135,000
🖨 Deal sheet (PDF) 📄 Offer letter ✓ Due diligence
Listing remarks
Spacious townhouse opportunity ready for your vision! This fixer upper offers a solid layout with generously sized bedrooms and multiple large storage closets throughout. Main floor features include convenient laundry, an eat-in kitchen, and a comfortable living space with fireplace. Upstairs, you’ll find two oversized bedrooms with great natural light. Recent updates include newer insulated windows, helping improve efficiency and comfort. Enjoy a private fenced patio—perfect for relaxing or entertaining. Property includes 2 assigned parking spaces plus ample visitor parking. Located in a well-maintained community with exterior maintenance and common areas covered by the HOA. No
Key facts
- $260 HOA
- Built 1982
- Listed 44 days
Property features AI
Finance
- Other: Living area reported as 1,200 (source: Assessor)
- HOA & community: Community managed by Sentry Management; Monthly HOA fee of $260; HOA covers grounds maintenance, parking/road maintenance, common area maintenance and trash; Outside management; 40 units in the community
Exterior
- Parking: Assigned parking and guest parking in a parking lot; No driveway and no garage
- Utilities: Public water; Public sewer; Electric service with 220 volts; Cable available; Natural gas available; Phone available; Sewer connected; Water available
- Home design: Attached townhouse; Two levels; Private ownership; Fixer condition
- Construction: Brick, concrete and vinyl siding construction; Architectural shingle roof; Slab foundation; Built (year source: Assessor)
- Exterior features: Patio; Fenced yard (wood privacy fence); Shed on property; Adjoins wooded area; Level lot; Concrete road frontage (city street)
Interior
- Kitchen: Free-standing electric range; Eat-in layout with kitchen island
- Bedrooms: Two bedrooms on the upper level
- Flooring: Carpet; Vinyl
- Bathrooms: One full bathroom; One half bathroom (main level)
- Heating & cooling: Forced air heating (natural gas); Central air conditioning; Ceiling fans; Electric cooling
- Interior features: Ceiling fans; Eat-in kitchen; Kitchen island; Insulated windows; Storm windows; Wood-burning fireplace
- Laundry & utility: Main-level laundry
Neighborhood map
What this means for you Summary
Snapshot
- This is a 2-bed/1.5-bath condo listed at $135k.
Deal economics
- At list price, monthly cash flow is $277 ($3k/yr) — positive.
- The deal already cash-flows at list — no discount required.
- Meets the 1% rule at list price ($2k rent vs $135k).
- Recommended offer: $131k (3.0% below list) — sets the bar for market timing.
- Cap rate 8.8% vs local median 4.2% in St. Peters — top-decile yield for the area; either an underpriced asset or a hidden risk that comps aren't pricing in. Stress-test before assuming the spread holds.
Location & tenants
- Location reads: area grade B — affects rentability + tenant quality, not the cash-flow math above.
- Francis Howell R-III (suburban): math 53% / reading 63% proficiency, ranked #11 of 324 in MO (top 3%) — acceptable for families but not a draw, mixed tenant base, ~2y average lease; only 15% free/reduced lunch — higher-income household profile.
- Zoned schools: Fairmount Elem. (math 43% / reading 56%, grade D, #284 of 1,115 statewide, top 30%, 1,013 students, 18% FRL); Saeger Middle (math 56% / reading 61%, grade B, #24 of 391 statewide, top 6%, 701 students, 12% FRL); Francis Howell Central High (math 36% / reading 74%, grade C, #65 of 521 statewide, top 13%, 1,805 students, 18% FRL) — zoned schools at 16% FRL track the district average.
- Market conditions: Rents rising (+2.7%/yr); 297 active listings in the ZIP; 11 comparable units currently listed for rent nearby; rentals leasing fast (median 5d on market — plan ~1-2 weeks tenant-placement turnaround); solid renter incomes; 2,021 units permitted in St. Charles County in 2024 (568 in 5+ unit buildings).
Forward outlook
- Local home prices are declining (-3.0%/yr); year-one equity from $933 of loan paydown is wiped out by about $4k of value loss. Plan a longer hold.
- St. Charles County population projected at +22% by 2050 — long-run rental-demand tailwind backs the buy-and-hold thesis.
Negotiation context
- It's been on market 45 days — a 3% lower offer ($131k) is reasonable based on typical stale-listing flexibility.
- Current owner paid $20k; list at $135k implies a 589% gain — meaningful room to come down on a strong offer.
Risks & watch-outs
- Climate carrying-cost: extreme-heat days projected 7→20/yr by 2055 (HVAC capex compounding) — expect insurance premiums to compound above CPI over the hold.
Questions for the listing agent
- It's been on market 45 days. Have you received any prior offers? Is the seller open to a 3% concession, seller financing, or rate buy-down credit?
- What does the HOA fee cover, when was the last increase, and are there any pending special assessments or reserve-fund shortfalls?
- Any open or pending special assessments — roof, HVAC, plumbing, elevator, façade? What's the per-unit balance and payoff schedule, and is the seller paying it off at close or rolling it to the buyer?
- Is there a deadline driving the sale (1031 exchange, divorce, estate, relocation)? That informs how much negotiation room exists.
- What's the average days-on-market for RENTAL listings here right now (not sales)? A rising rental-DOM trend means longer vacancies and softer asking-rent achievability than the comps imply.
- What's the recent tenant-quality profile in this submarket — average credit score on applications, eviction rate, late-payment / NSF rate, and stable-employment percentage? A property-management company in the area should have these aggregated.
- How much new apartment / multifamily construction is in the pipeline within 1–3 miles? Heavy new supply (>2% of stock underway) typically softens rents 12–24 months out; light construction supports rent growth.
Investment metrics
- 1% rule
- 1.37% ✓
- Cap rate
- 8.76%
- Cash-on-cash
- 8.79%
- DSCR
- 1.39
- GRM
- 6.1
CMA / ARV
- ARV (median comp)
- $171,861
- List price
- $135,000
- Delta
- -21.45%
- Verdict
- UNDERPRICED
- Comps
- 20 within 1.0 mi
Projected returns pro-forma
-3.0% appreciation · 2.69% rent growth · sell at horizon
- IRR
- -3.3%
- Equity multiple
- 0.88×
- Total profit
- $-4,625
- Equity at exit
- $20,129
- IRR
- 6.1%
- Equity multiple
- 1.45×
- Total profit
- $17,084
- Equity at exit
- $11,672
Cash invested: $37,800 (down + closing). Projections, not guarantees.
Landlord ↔ Tenant lean methodology
- Overall (STATE)
- 81 Strongly Landlord-Friendly
- State Missouri
- 81 Strongly Landlord-Friendly · R+10
- County
- — inherits STATE
- City
- — inherits STATE
ZIP-level market 63376
- Rents YoY
- 2.7%
- Active inventory
- 297
- Price-to-rent
- 6.1×
Monthly cashflow live
- Estimated rent
- $1,845 high interval (Pro) →
- Mortgage (P&I)
- −$708
- Tax from tax record
- −$156 /mo · $1,874/yr
- Insurance
- −$56
- HOA
- −$260
- Vacancy / Maint / Mgmt
- −$387
- Net cashflow
- $277
Break-even live
Sensitivity live
| Price | -10% $353 | -5% $315 | +0% $277 | +5% $239 | +10% $201 |
|---|---|---|---|---|---|
| Rent | -10% $131 | -5% $204 | +0% $277 | +5% $350 | +10% $423 |
| Rate | -1.0pp $345 | -0.5pp $311 | base $277 | +0.5pp $242 | +1.0pp $206 |
UW: 25.0% down · 7.5% · 30yr · 1.5% tax · 5.0% vac · 8.0% maint · 8.0% mgmt
Financing live
Cash to close
- Down payment
- $33,750
- Closing costs
- $4,050
- Reserves months
- —
- Total cash needed
- —
Loan-product check · same deal, 3 products live
Conventional
25% down · 7.5% · 30yr
- Down + closing
- —
- Monthly P&I
- —
- Monthly cashflow
- —
- DSCR
- —
- Eligible?
- —
Personal DTI + credit; lowest rate.
DSCR
20% down · 8.5% · 30yr
- Down + closing
- —
- Monthly P&I
- —
- Monthly cashflow
- —
- DSCR
- —
- Eligible?
- —
No personal income docs; deal must DSCR.
Hard money
10% down · 12.0% · 12mo
- Down + closing
- —
- Monthly P&I
- —
- Monthly cashflow
- —
- DSCR
- —
- Eligible?
- —
Short-term bridge; refi at stabilization.
Rent comps 11 comps
| Address | Beds | Baths | Sqft | Rent | $/sqft | DOM | Units | Dist |
|---|---|---|---|---|---|---|---|---|
| 31 Park Charles Blvd N Saint Peters, MO | 2.0 | 1.5 | 1280 | $1,650 | $1.29 | 18d | 1 | 0.32mi |
| 4153 McClay Rd Saint Charles, MO | 3.0 | 2.0 | 1096 | $2,100 | $1.92 | 45d | 1 | 0.65mi |
| 634 Watkins Glen Dr Saint Charles, MO | 3.0 | 2.0 | 1498 | $2,621 | $1.75 | 0d | 1 | 0.75mi |
| 18 Brooker Ct Saint Peters, MO | 3.0 | 2.0 | 1104 | $1,895 | $1.72 | 5d | 1 | 0.92mi |
| 1360 Park Ashwood Dr St Charles, MO | 2.0 | 2.0 | 936 | $1,515 | $1.62 | 0d | 3 | 1.11mi |
| 1400 Britain Way St Charles, MO | 1.0–2.0 | 1.0 | 762 | $1,484 | $1.95 | 0d | 7 | 1.19mi |
| 4507 Cambrook Dr Saint Charles, MO | 3.0 | 2.0 | 1279 | $2,300 | $1.80 | 13d | 1 | 1.26mi |
| 100 Grenache Blanc Dr St Peters, MO | 1.0–3.0 | 1.0–2.0 | 1203 | $1,806 | $1.50 | 0d | 29 | 1.27mi |
| 1248 Mendoza Dr Saint Peters, MO | 3.0 | 2.0 | 1300 | $2,031 | $1.56 | 16d | 1 | 1.44mi |
| 121 Shirley Ridge Dr St Charles, MO | 2.0 | 1.0 | 1020 | $1,475 | $1.45 | 45d | 1 | 1.46mi |
| 1601 Cottleville Pkwy Saint Peters, MO | 1.0–2.0 | 1.0–2.0 | 1062 | $1,880 | $1.77 | 0d | 22 | 1.50mi |
HOA detail condo
- Monthly dues
- $260 · $3,120/yr
- Likely covers
- exterior maint.parking
- Assessments
- None detected in remarks — confirm with the listing agent.
Listing history 22 events
-
2026-06-21days on market $135,000 Active 45 DOM
-
2026-06-18days on market $135,000 Active 42 DOM
-
2026-06-17days on market $135,000 Active 41 DOM
-
2026-06-16days on market $135,000 Active 40 DOM
-
2026-06-15days on market $135,000 Active 39 DOM
-
2026-06-13days on market $135,000 Active 37 DOM
-
2026-06-13days on market $135,000 Active 36 DOM
-
2026-06-09days on market $135,000 Active 33 DOM
-
2026-06-08days on market $135,000 Active 32 DOM
-
2026-06-07days on market $135,000 Active 31 DOM
-
2026-06-05days on market $135,000 Active 28 DOM
-
2026-06-03days on market $135,000 Active 27 DOM
-
2026-06-02days on market $135,000 Active 26 DOM
-
2026-06-01days on market $135,000 Active 25 DOM
-
2026-05-31days on market $135,000 Active 24 DOM
-
2026-05-16price $135,000 1046-char remark
-
2026-05-08$140,000 Active 1046-char remark
-
2026-05-04historical $140,000 1046-char remark
-
1994-04-01soldstatus
-
1992-07-01soldstatus $19,600
-
1991-10-01soldstatus
-
1982-06-01soldstatus
ⓘ Source: listings_history table (triggers on properties + properties_extension) + one-shot
backfill from property_details.listing_events for pre-trigger history.
Tax reassessment forecast MO · Resets to sale price
- Current annual tax
- $1,874 · $156/mo
- Projected year-2 tax
- $1,874 · $156/mo
- Expected delta
- $0/yr ($0/mo · 0.0%)
ⓘ Screening estimate from a state-policy table — verify with the county assessor before closing.
Climate risk First Street
- Flood 1/10 Low FEMA zone X (unshaded) · 0% chance over 30 yrs
- Wildfire 1/10 Low
- Heat 5/10 Major 7 d/yr ≥107°F today · 20 d/yr by 30 yrs out
- Wind 2/10 Low 100% chance of damaging wind over 30 yrs
- Air quality 2/10 Low 2 unhealthy d/yr today · 2 by 30 yrs out
Nearby sold comps map
Loading sold comps map…
Walkable amenities ~0.75 mi
Loading nearby amenities…
Taxation est. · year 1
- Rental income
- $22,138
- − Mortgage interest
- −$7,562
- − Property taxes
- −$1,874
- − Insurance
- −$675
- − Repairs & maintenance
- −$1,771
- − Management
- −$1,771
- − HOA
- −$3,120
- − Depreciation
- −$3,927
- Taxable income
- $1,437
- Est. tax owed @ 24.0%
- −$345
- After-tax cash flow
- $2,979/yr
For passive investors: Depreciation is non-cash, so a rental often shows a tax loss while cash-flowing — sheltering income. Rental losses are passive: they offset passive income freely, and up to $25,000/yr can offset ordinary (W-2) income if you actively participate and your MAGI is under $100k (phasing out to $0 by $150k); unused losses carry forward. On sale, claimed depreciation is recaptured at up to 25%, and gains may owe capital-gains tax (a 1031 exchange can defer both). Figures are a year-1 estimate at your 24.0% rate — not tax advice; consult a CPA.
Schools (NCES district)
- District
- Francis Howell R-III
- NCES district ID
- 2928950
- Math proficiency
- 53% ▼ -12.00%
- Reading proficiency
- 63% ▼ -5.00%
- Median HH income
- $79,768
- Composite
- 52.23/100
- National rank
- #1602
- State rank
- #11 of 324 in MO
Livability — St. Peters
No livability data for this city. (Only ~50 U.S. cities are tracked.)
Census & demographics
- County
- Saint Charles County · 399,703 people
- City population
- 74,876
- Metro
- St. Louis, MO-IL
- Population (ZIP)
- 74,962
- Household income
- $96,393
- Rent vs Own
- Severe rent burden
- 964.0
Population outlook (St. Charles County) Hauer SSP2
- Today (2025)
- 437,857 people
- By 2030
- 461,707 · +5.4%
- By 2040
- 503,222 · +14.9%
- By 2050
- 534,684 · +22.1%
- By 2075
- 597,047 · +36.4%
- By 2100
- 609,682 · +39.2%
Race, ethnicity, and origin ACS 2023
- Neighborhood character
- Predominantly White (86%)
- Race & ethnicity
- White 86% Two or more races 6% Black 5% Hispanic / Latino 2% Asian 2%
- Common ancestry
- Lithuanian 3% Romanian 3% Italian 2%
- Foreign-born
- 3% · China, Canada
- Languages at home
- 96% English-only · Spanish 1% Chinese 1% Other Asian/Pacific 1%
Political lean MEDSL · St. Charles
- 2024 margin
- R (+17.0) · D 40.8% · R 57.8% · Other 1.4%
- 2008→2024 swing
- -7.2pp toward R · 2008: -9.7pp · 2024: -17.0pp
- All cycles
- 2024: R+17.0 2020: R+17.5 2016: R+26.4 2012: R+21.0 2008: R+9.7
Not yet ingested
- Civics
- —
Market trends
- HPI YoY
- ▼ -315.50%
- Current HPI
- 230.3362
- Rent YoY
- ▲ 2.69%
- Metro
- St. Louis, MO-IL
- State GDP YoY
- ▲ 1.84%
- F500 in state
- 20
Industry mix (Fortune 500 HQ in MO)
| Industry | F500 HQs | Revenue |
|---|---|---|
| Healthcare | 1 | $163B |
|
||
| Insurance | 1 | $21B |
|
||
| Industrial Technology | 1 | $17B |
|
||
| Retail | 1 | $16B |
|
||
| Industrial Distribution | 1 | $10B |
|
||
| Utilities | 1 | $9B |
|
||
Price history
+588.8% since first listed7 events — show timeline
- 2026-05-16 Price Changed $135,000 MARIS as Distributed by MLS Grid
- 2026-05-08 Listed $140,000 MARIS as Distributed by MLS Grid
- 2026-05-04 Coming Soon $140,000 MARIS as Distributed by MLS Grid
- 1994-04-01 Sold (Public Records) — Public Records
- 1992-07-01 Sold (Public Records) $19,600 Public Records
- 1991-10-01 Sold (Public Records) — Public Records
- 1982-06-01 Sold (Public Records) — Public Records
Property tax history
+4.4%/yrLatest (2025): $1,874 · +5.7% YoY. Source: county tax records.
Cash-flow waterfall
monthlySold comps — $/sqft
last 12 mo · ≤1 miLoading sold comps…