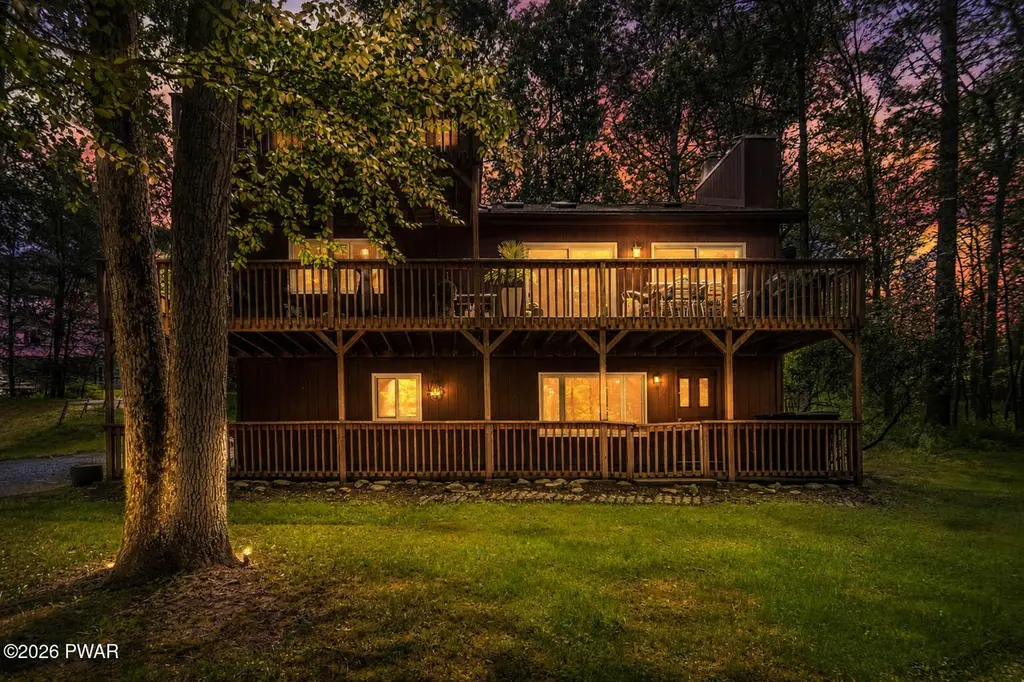
163 N Lake Shore Dr · Birchwood Lakes, PA
Flood risk 1/10 · Minimal
- FEMA flood zone
- X (unshaded)
- Chance of flooding over 30 yrs
- 0.0%
- Est. flood insurance / yr
- $473 – $860
Fire risk 3/10 · Minor
- Est. fire insurance / yr
- $511 – $949
Heat risk 3/10 · Minor
- Hot days now (above 94°F)
- 7 days/yr
- Hot days in 30 yrs
- 15 days/yr
Wind risk 3/10 · Minor
- Chance of severe wind over 30 yrs
- 7.0%
Air-quality risk 2/10 · Minimal
- Unhealthy air days now
- 1 days/yr
- Unhealthy air days in 30 yrs
- 2 days/yr
Risk factors via First Street. Map © Google.
Why this score? — see what drove the D grade
The composite is a weighted blend of 9 inputs, each scored 0–100. Each bar is that input's sub-score; the figure is the points it added to the 100-point composite (weight × sub-score).
- Appreciation +10.0/10.0
- ARV discount +8.4/15.0
- Cash flow +8.2/30.0
- Schools +4.7/10.0
- Livability +3.1/5.0
- 1% rule +2.6/10.0
- Rent growth +2.5/5.0
- Condition / age +2.5/5.0
- DSCR +2.2/10.0
$319,900
🖨 Deal sheet (PDF) 📄 Offer letter ✓ Due diligence
Listing remarks
IMMACULATE 4BED/2BA CONTEMPORARY HOME WITH AN OPEN FLOOR PLAN AND SEASONAL LAKE VIEWS. The main living area of the home features a modern eat-in kitchen with breakfast bar and living room with vaulted ceilings and a stone fireplace. The abundance of windows, 2 sets of sliders and skylights afford extra natural light in the living room & kitchen. On the main living floor there are additionally 2 spacious bedrooms and a full bath The private master located on the upper level of home has an ensuite bath & private balcony looking out to the lake. The walkout lower level offers a huge family room with pool table and 1 additional BR. The lower level is piped out to add a half bath. Th
Key facts
- Private balcony
- Huge family room
- Seasonal lake views
Tags
Property features AI
Finance
- HOA & community: Homeowners association with an annual fee of $390 (about $32.50/month); Community lake
Exterior
- Parking: Driveway; Unpaved parking; Parking pad
- Security: Smoke detector(s)
- Utilities: Private well water; Septic tank sewer
- Home design: Residential single-family home
- Construction: Wood siding; Asphalt and fiberglass roof; Has basement
- Exterior features: Covered patio; Patio; Deck; Sloped, wooded lot with views; Outbuilding, workshop, storage shed(s)
Interior
- Kitchen: Dishwasher; Refrigerator; Gas oven; Electric range; Electric oven
- Flooring: Hardwood; Ceramic tile; Tile; Concrete
- Bathrooms: 2 full bathrooms
- Heating & cooling: Baseboard heating; Zoned heating; Propane and natural gas options; Hot water heating; Fireplace insert; Electric heating; Ceiling fans; Wall unit cooling
- Interior features: Open floor plan; Cathedral ceilings; Bar; Living room stone fireplace
- Laundry & utility: Washer hookup; Electric dryer hookup; Gas dryer hookup; Partially finished full basement with walk-up/walk-out access
Neighborhood map
What this means for you Summary
Snapshot
- This is a 4-bed/1.5-bath single-family listed at $320k.
Deal economics
- At list price, monthly cash flow is $-302 ($-4k/yr) — negative.
- To cash-flow at today's rent, offer at most $267k (16.7% below list).
- To meet the 1% rule (rent ≥ 1% of price), the offer needs to be $242k (24.3% below list).
- Recommended offer: $242k (24.3% below list) — sets the bar for 1% rule.
Location & tenants
- Location reads 61/100 on livability (#1,407 in PA) — a middle-class / working-renter tenant base. Strengths: crime A+, cost of living A+, housing B+; Watch: employment D+, health & safety D, amenities F.
- Delaware Valley SD (rural): math 41% / reading 66% proficiency, ranked #121 of 539 in PA (top 22%) — acceptable for families but not a draw, mixed tenant base, ~2y average lease.
- Zoned schools: Delaware Valley Hs (math 77% / reading 75%, grade A-, #25 of 437 statewide, top 6%, 1,418 students, 37% FRL).
- Zoned-school proficiency averages 76% at this address vs 54% district-wide (+22 pts) — the actual schools serving this property are materially stronger than the Delaware Valley SD average implies; a family-tenant draw the district grade alone would hide.
- Market conditions: 213 active listings in the ZIP; 213 units permitted in Pike County in 2024 (0 in 5+ unit buildings).
Forward outlook
- In year one you build about $34k of equity ($2k loan paydown + $32k appreciation (10.0% local appreciation)).
- Pike County population projected at -25% by 2050 — secular population decline; favor cash flow + early exit over multi-decade hold.
- By year 2, paydown + projected appreciation supports a ~$55k cash-out refi (75% LTV) — recoverable capital for the next deal without selling this one.
Negotiation context
- Only 10 days on market — expect competitive offers; lowballing is unlikely to land.
- Current owner paid $180k; list at $320k implies a 78% gain — meaningful room to come down on a strong offer.
Questions for the listing agent
- What do current leases actually rent for vs. the listed asking? Can we see a recent rent roll and the last 12 months of T-12 income?
- What does the HOA fee cover, when was the last increase, and are there any pending special assessments or reserve-fund shortfalls?
- Is there a deadline driving the sale (1031 exchange, divorce, estate, relocation)? That informs how much negotiation room exists.
- Schools are F-rated, which usually means shorter tenancies and higher turnover. Who's the typical renter profile here, and what's been the actual vacancy rate?
- The area grade is low — what's the realistic commute time and amenity access for the typical tenant pool here? Any planned neighborhood developments (good or bad) we should know about?
- What's the average days-on-market for RENTAL listings here right now (not sales)? A rising rental-DOM trend means longer vacancies and softer asking-rent achievability than the comps imply.
- What's the recent tenant-quality profile in this submarket — average credit score on applications, eviction rate, late-payment / NSF rate, and stable-employment percentage? A property-management company in the area should have these aggregated.
- How much new for-sale + rental construction is in the pipeline within 1–3 miles? Heavy new supply typically softens prices + rents 12–24 months out; constrained supply supports both.
Investment metrics
- 1% rule
- 0.76% ✗
- Cap rate
- 5.16%
- Cash-on-cash
- -4.04%
- DSCR
- 0.82
- GRM
- 11.0
CMA / ARV
- ARV (on-the-fly)
- $326,585
- Comps found
- 9
Show comp detail 9 sales within ~0.75 mi
| Address | Dist | Beds/Ba | Sqft | Sold | Price | $/sf | Match |
|---|---|---|---|---|---|---|---|
| 154 N Lake Shore Dr | 0.07mi | 4/3.0 | 2,210 (+5%) | 0mo | $545,000 | $247 | 82 |
| 103 Yvonne Ct | 0.30mi | 3/2.0 (-1) | 2,114 (+0%) | 12mo | $285,000 | $135 | 69 |
| 111 Babette Ct | 0.35mi | 3/2.0 (-1) | 2,140 (+2%) | 8mo | $292,000 | $136 | 67 |
| 109 Lake Dr | 0.47mi | 4/3.0 | 2,048 (-3%) | 7mo | $497,000 | $243 | 62 |
| 317 Marcel Dr | 0.73mi | 3/2.0 (-1) | 2,093 (-1%) | 1mo | $242,000 | $116 | 57 |
| 565 Silver Lake Rd | 0.40mi | 3/3.0 (-1) | 2,257 (+7%) | 16mo | $390,000 | $173 | 45 |
| 215 Lake Dr | 0.44mi | 4/2.5 | 1,840 (-13%) | 16mo | $300,000 | $163 | 41 |
| 108 Saint Dr | 0.62mi | 3/3.0 (-1) | 1,932 (-8%) | 20mo | $197,000 | $102 | 30 |
| 107 Adrienne Ct | 0.70mi | 3/2.5 (-1) | 1,932 (-8%) | 21mo | $300,000 | $155 | 27 |
Match score weights: distance 35% · size 25% · config 20% · recency 20%. Top-matched comps best support the ARV.
Projected returns pro-forma
10.0% appreciation · 3.0% rent growth · sell at horizon
- IRR
- 21.4%
- Equity multiple
- 2.73×
- Total profit
- $155,037
- Equity at exit
- $288,191
- IRR
- 19.3%
- Equity multiple
- 6.27×
- Total profit
- $471,759
- Equity at exit
- $621,495
Cash invested: $89,572 (down + closing). Projections, not guarantees.
Landlord ↔ Tenant lean methodology
- Overall (STATE)
- 62 Landlord-Friendly
- State Pennsylvania
- 62 Landlord-Friendly · EVEN
- County
- — inherits STATE
- City
- — inherits STATE
ZIP-level market 18328
- Home prices YoY
- 18.1%
- Active inventory
- 213
- Price-to-rent
- 11.0×
Monthly cashflow live
- Estimated rent
- $2,423 medium interval (Pro) →
- Mortgage (P&I)
- −$1,678
- Tax from tax record
- −$344 /mo · $4,131/yr
- Insurance
- −$133
- HOA
- −$61
- Vacancy / Maint / Mgmt
- −$509
- Net cashflow
- $-302
Break-even live
Sensitivity live
| Price | -10% $-121 | -5% $-211 | +0% $-302 | +5% $-392 | +10% $-483 |
|---|---|---|---|---|---|
| Rent | -10% $-493 | -5% $-398 | +0% $-302 | +5% $-206 | +10% $-110 |
| Rate | -1.0pp $-141 | -0.5pp $-221 | base $-302 | +0.5pp $-385 | +1.0pp $-469 |
UW: 25.0% down · 7.5% · 30yr · 1.5% tax · 5.0% vac · 8.0% maint · 8.0% mgmt
Financing live
Cash to close
- Down payment
- $79,975
- Closing costs
- $9,597
- Reserves months
- —
- Total cash needed
- —
Loan-product check · same deal, 3 products live
Conventional
25% down · 7.5% · 30yr
- Down + closing
- —
- Monthly P&I
- —
- Monthly cashflow
- —
- DSCR
- —
- Eligible?
- —
Personal DTI + credit; lowest rate.
DSCR
20% down · 8.5% · 30yr
- Down + closing
- —
- Monthly P&I
- —
- Monthly cashflow
- —
- DSCR
- —
- Eligible?
- —
No personal income docs; deal must DSCR.
Hard money
10% down · 12.0% · 12mo
- Down + closing
- —
- Monthly P&I
- —
- Monthly cashflow
- —
- DSCR
- —
- Eligible?
- —
Short-term bridge; refi at stabilization.
HOA detail
- Monthly dues
- $61 · $732/yr
- Likely covers
- pool
Listing history 9 events
-
2026-06-21statusdays on market $319,900 Pending 10 DOM
-
2026-06-18days on market $319,900 Active 9 DOM
-
2026-06-17days on market $319,900 Active 8 DOM
-
2026-06-16days on market $319,900 Active 7 DOM
-
2026-06-15days on market $319,900 Active 6 DOM
-
2026-06-13days on market $319,900 Active 4 DOM
-
2026-06-13days on market $319,900 Active 3 DOM
-
2026-06-10remarks 691-char remark
-
2026-06-10$319,900 Active 1 DOM
ⓘ Source: listings_history table (triggers on properties + properties_extension) + one-shot
backfill from property_details.listing_events for pre-trigger history.
Tax reassessment forecast PA · Partial reset (capped growth)
- Current annual tax
- $4,131 · $344/mo
- Projected year-2 tax
- $4,593 · $383/mo
- Expected delta
- +$462/yr (+$38/mo · 11.2%)
ⓘ Screening estimate from a state-policy table — verify with the county assessor before closing.
Climate risk First Street
- Flood 1/10 Low FEMA zone X (unshaded) · 0% chance over 30 yrs
- Wildfire 3/10 Moderate
- Heat 3/10 Moderate 7 d/yr ≥94°F today · 15 d/yr by 30 yrs out
- Wind 3/10 Moderate 7% chance of damaging wind over 30 yrs
- Air quality 2/10 Low 1 unhealthy d/yr today · 2 by 30 yrs out
Nearby sold comps map
Loading sold comps map…
Walkable amenities ~0.75 mi
Loading nearby amenities…
Taxation est. · year 1
- Rental income
- $29,077
- − Mortgage interest
- −$17,919
- − Property taxes
- −$4,131
- − Insurance
- −$1,600
- − Repairs & maintenance
- −$2,326
- − Management
- −$2,326
- − HOA
- −$732
- − Depreciation
- −$9,306
- Taxable loss
- −$9,264
- Est. tax savings @ 24.0%
- +$2,223
- After-tax cash flow
- $-1,400/yr
For passive investors: Depreciation is non-cash, so a rental often shows a tax loss while cash-flowing — sheltering income. Rental losses are passive: they offset passive income freely, and up to $25,000/yr can offset ordinary (W-2) income if you actively participate and your MAGI is under $100k (phasing out to $0 by $150k); unused losses carry forward. On sale, claimed depreciation is recaptured at up to 25%, and gains may owe capital-gains tax (a 1031 exchange can defer both). Figures are a year-1 estimate at your 24.0% rate — not tax advice; consult a CPA.
Schools (NCES district)
- District
- Delaware Valley SD
- NCES district ID
- 4207530
- Math proficiency
- 41% ▼ -12.00%
- Reading proficiency
- 66% ▼ -9.00%
- Median HH income
- $64,202
- Composite
- 46.95/100
- National rank
- #2359
- State rank
- #121 of 539 in PA
Livability — Birchwood Lakes
- Score
- 61/100
- State rank
- #1407
- US rank
- #17785
Category grades
Schools grade is shown separately in the Schools card above.
Census & demographics
- Population (ZIP)
- 8,061
Population outlook (Pike County) Hauer SSP2
- Today (2025)
- 53,548 people
- By 2030
- 51,622 · -3.6%
- By 2040
- 46,490 · -13.2%
- By 2050
- 40,372 · -24.6%
- By 2075
- 31,951 · -40.3%
- By 2100
- 26,821 · -49.9%
Race, ethnicity, and origin ACS 2023
- Neighborhood character
- Predominantly White (85%)
- Race & ethnicity
- White 85% Hispanic / Latino 10% Two or more races 8%
- Hispanic origin (detail)
- Puerto Rican 5%
- Common ancestry
- Scotch-Irish 6% Romanian 6% Iranian 4%
- Foreign-born
- 9% · Canada, Jamaica
- Languages at home
- 86% English-only · Spanish 6% Russian/Polish/Slavic 5% Other Indo-European 2%
Political lean MEDSL · Pike
- 2024 margin
- Strong R (+24.1) · D 37.6% · R 61.6%
- 2008→2024 swing
- -19.8pp toward R · 2008: -4.2pp · 2024: -24.1pp
- All cycles
- 2024: R+24.1 2020: R+19.0 2016: R+26.0 2012: R+11.0 2008: R+4.2
Not yet ingested
- Civics
- —
Market trends
- HPI YoY
- ▲ 38.13%
- Current HPI
- 248.4494
- Rent YoY
- —
- Metro
- —
- State GDP YoY
- ▲ 1.68%
- F500 in state
- 34
Industry mix (Fortune 500 HQ in PA)
| Industry | F500 HQs | Revenue |
|---|---|---|
| Healthcare | 2 | $309B |
|
||
| Insurance | 2 | $27B |
|
||
| Telecommunications / Media | 1 | $124B |
|
||
| Industrial Distribution | 1 | $22B |
|
||
| Financial Services | 1 | $20B |
|
||
| Chemicals / Materials | 1 | $18B |
|
||
Price history
+77.7% since first listed2 events — show timeline
- 2026-06-09 Listed $319,900 PWMLS
- 2005-03-22 Sold (Public Records) $180,000 Public Records
Property tax history
+1.7%/yrLatest (2026): $4,131 · +1.5% YoY. Source: county tax records.
Cash-flow waterfall
monthlySold comps — $/sqft
last 12 mo · ≤1 miLoading sold comps…