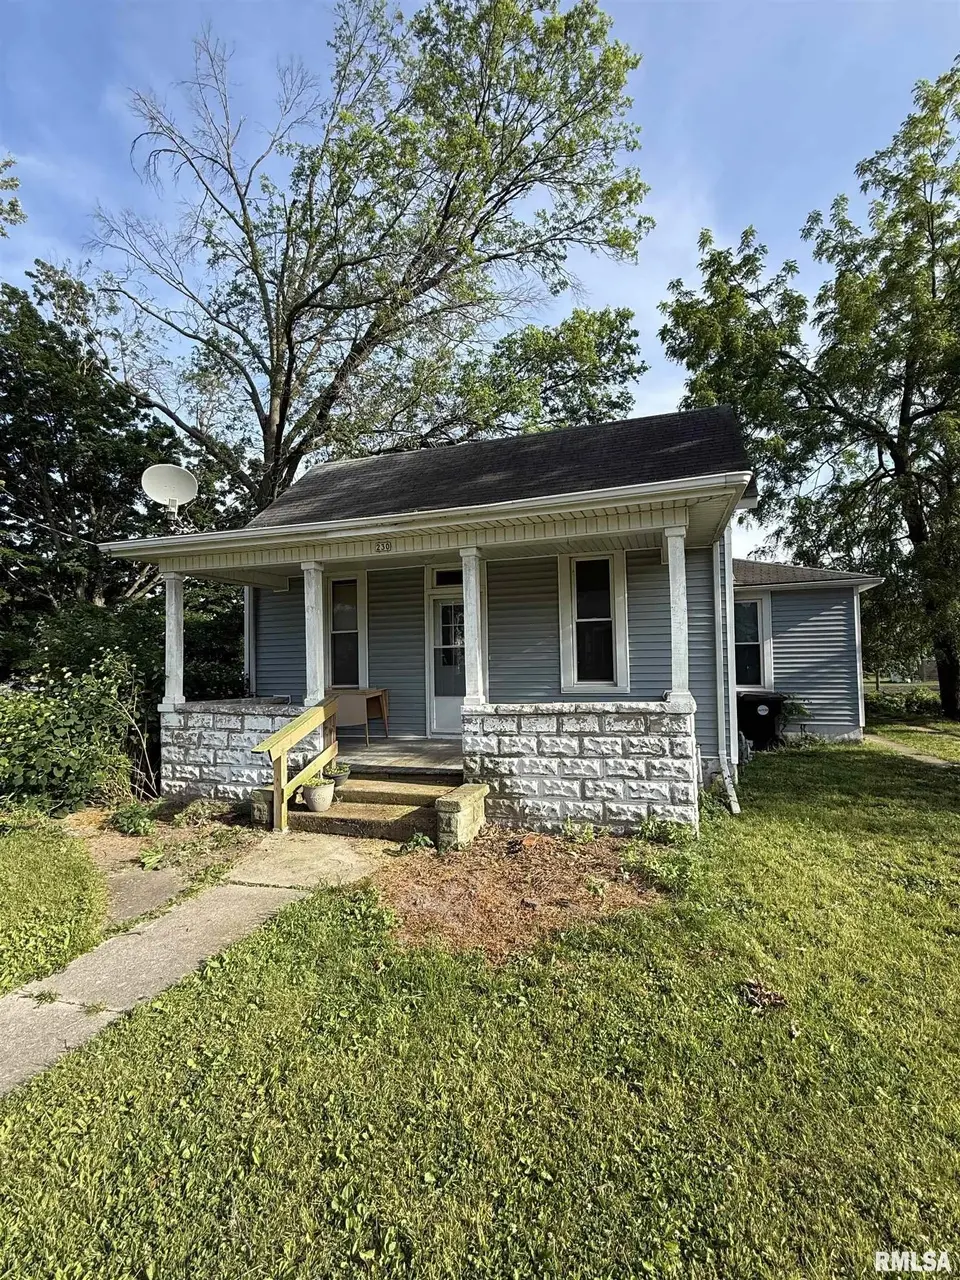
230 E South St · Astoria, IL
Flood risk 1/10 · Minimal
- FEMA flood zone
- X (unshaded)
- Chance of flooding over 30 yrs
- 0.0%
- Est. flood insurance / yr
- $507 – $1,088
Fire risk 1/10 · Minimal
- Est. fire insurance / yr
- $804 – $1,492
Heat risk 3/10 · Minor
- Hot days now (above 105°F)
- 7 days/yr
- Hot days in 30 yrs
- 18 days/yr
Wind risk 2/10 · Minimal
- Chance of severe wind over 30 yrs
- 0.0%
Air-quality risk 2/10 · Minimal
- Unhealthy air days now
- 1 days/yr
- Unhealthy air days in 30 yrs
- 1 days/yr
Risk factors via First Street. Map © Google.
Why this score? — see what drove the A- grade
The composite is a weighted blend of 9 inputs, each scored 0–100. Each bar is that input's sub-score; the figure is the points it added to the 100-point composite (weight × sub-score).
- Cash flow +30.0/30.0
- ARV discount +15.0/15.0
- 1% rule +10.0/10.0
- DSCR +10.0/10.0
- Appreciation +6.4/10.0
- Livability +3.1/5.0
- Rent growth +2.5/5.0
- Condition / age +2.2/5.0
- Schools +1.9/10.0
$29,900
🖨 Deal sheet (PDF) 📄 Offer letter ✓ Due diligence
Listing remarks
Updated siding and windows on this 2 bedroom (possible 3 bedroom), 1 bath ranch. Good sized yard to the East. Great project house. 100 Amp electrical service and newer gas water heater. Home is part of an estate and is being sold "as-is".
Key facts
- Updated siding
- Updated windows
- Good sized yard
Tags
Property features AI
Finance
- Other: Lot dimensions approximately 133' x 132'; Building area reported as 1320
- HOA & community: No association fee
Exterior
- Parking: On-street parking (no garage)
- Utilities: Public water; Public sewer
- Home design: Single-family residence; Residential zoning; Shingle roof
- Construction: Year built: not provided
- Exterior features: Replacement windows; Level lot; Paved road access
Interior
- Kitchen: No appliances included
- Bedrooms: 2 bedrooms (Bedroom 1 on main level, Bedroom 2 on main level)
- Flooring: Hardwood flooring in living, dining, main bedrooms and additional room; Vinyl flooring in kitchen and south room
- Bathrooms: 1 full bathroom
- Heating & cooling: Forced-air heating; Gas water heater; No central air
- Interior features: Ceiling fan(s); Has basement (crawl space, partial)
Neighborhood map
What this means for you Summary
Snapshot
- This is a 2-bed/1.0-bath single-family listed at $30k. Condition is rated fair.
Deal economics
- At list price, monthly cash flow is $635 ($8k/yr) — positive.
- The deal already cash-flows at list — no discount required.
- Meets the 1% rule at list price ($1k rent vs $30k).
- Recommended offer: $29k (1.5% below list) — sets the bar for market timing.
Location & tenants
- Location reads 61/100 on livability (#904 in IL) — a middle-class / working-renter tenant base. Strengths: cost of living A+, crime A, housing A; Watch: amenities F, commute F, employment F.
- Astoria CUSD 1 (rural): math 6% / reading 30% proficiency, ranked #739 of 919 in IL (top 80%) — low school quality limits family demand, transient renter base, plan for 1-2y turnover.
- Zoned schools: Astoria Elem School (math 15% / reading 24%, grade F, #1,043 of 2,056 statewide, top 51%, 130 students, 0% FRL); Astoria Junior High School (math 2% / reading 22%, grade F, #550 of 665 statewide, top 84%, 67 students, 0% FRL); Astoria High School (math 10% / reading 30%, grade F, #357 of 693 statewide, top 54%, 73 students, 0% FRL) — zoned schools average 0% FRL vs 45% district-wide (45 pts lower); this property's tenant base skews higher-income than the district average.
- Market conditions: 11 active listings in the ZIP; 14 units permitted in Fulton County in 2024 (0 in 5+ unit buildings).
Forward outlook
- In year one you build about $1k of equity ($207 loan paydown + $816 appreciation (2.7% local appreciation)).
- Fulton County population projected at -20% by 2050 — secular population decline; favor cash flow + early exit over multi-decade hold.
- At projected returns (2.7% appreciation + 3.0% rent growth), your $8k cash investment doubles in ~1 year — after that, you're playing with house money.
Negotiation context
- It's been on market 23 days — a 2% lower offer ($29k) is reasonable based on typical stale-listing flexibility.
Questions for the listing agent
- Have any recent inspections been done? Can we get a copy of the seller's disclosures and any deferred-maintenance estimates?
- Is there a deadline driving the sale (1031 exchange, divorce, estate, relocation)? That informs how much negotiation room exists.
- Schools are F-rated, which usually means shorter tenancies and higher turnover. Who's the typical renter profile here, and what's been the actual vacancy rate?
- What's the average days-on-market for RENTAL listings here right now (not sales)? A rising rental-DOM trend means longer vacancies and softer asking-rent achievability than the comps imply.
- What's the recent tenant-quality profile in this submarket — average credit score on applications, eviction rate, late-payment / NSF rate, and stable-employment percentage? A property-management company in the area should have these aggregated.
- How much new for-sale + rental construction is in the pipeline within 1–3 miles? Heavy new supply typically softens prices + rents 12–24 months out; constrained supply supports both.
Investment metrics
- 1% rule
- 3.56% ✓
- Cap rate
- 31.78%
- Cash-on-cash
- 91.01%
- DSCR
- 5.05
- GRM
- 2.3
CMA / ARV
- ARV (on-the-fly)
- $46,200
- Comps found
- 2
Show comp detail 2 sales within ~0.75 mi
| Address | Dist | Beds/Ba | Sqft | Sold | Price | $/sf | Match |
|---|---|---|---|---|---|---|---|
| 208 E Church St | 0.20mi | 2/1.0 | 1,432 (+8%) | 17mo | $48,000 | $34 | 63 |
| 906 E Broadway St | 0.41mi | 2/1.0 | 1,428 (+8%) | 10mo | $50,000 | $35 | 58 |
Match score weights: distance 35% · size 25% · config 20% · recency 20%. Top-matched comps best support the ARV.
Projected returns pro-forma
2.73% appreciation · 3.0% rent growth · sell at horizon
- IRR
- 95.1%
- Equity multiple
- 6.21×
- Total profit
- $43,631
- Equity at exit
- $12,990
- IRR
- 94.8%
- Equity multiple
- 12.85×
- Total profit
- $99,211
- Equity at exit
- $19,673
Cash invested: $8,372 (down + closing). Projections, not guarantees.
Landlord ↔ Tenant lean methodology
- Overall (STATE)
- 43 Moderately Tenant-Leaning
- State Illinois
- 43 Moderately Tenant-Leaning · D+7
- County
- — inherits STATE
- City
- — inherits STATE
ZIP-level market 61501
- Home prices YoY
- 2.2%
- Active inventory
- 11
- Price-to-rent
- 2.3×
Monthly cashflow live
- Estimated rent
- $1,065 medium interval (Pro) →
- Mortgage (P&I)
- −$157
- Tax est. 1.5%
- −$37 /mo · $448/yr
- Insurance
- −$12
- HOA
- −$0
- Vacancy / Maint / Mgmt
- −$224
- Net cashflow
- $635
Break-even live
Sensitivity live
| Price | -10% $656 | -5% $645 | +0% $635 | +5% $625 | +10% $614 |
|---|---|---|---|---|---|
| Rent | -10% $551 | -5% $593 | +0% $635 | +5% $677 | +10% $719 |
| Rate | -1.0pp $650 | -0.5pp $643 | base $635 | +0.5pp $627 | +1.0pp $619 |
UW: 25.0% down · 7.5% · 30yr · 1.5% tax · 5.0% vac · 8.0% maint · 8.0% mgmt
Financing live
Cash to close
- Down payment
- $7,475
- Closing costs
- $897
- Reserves months
- —
- Total cash needed
- —
Loan-product check · same deal, 3 products live
Conventional
25% down · 7.5% · 30yr
- Down + closing
- —
- Monthly P&I
- —
- Monthly cashflow
- —
- DSCR
- —
- Eligible?
- —
Personal DTI + credit; lowest rate.
DSCR
20% down · 8.5% · 30yr
- Down + closing
- —
- Monthly P&I
- —
- Monthly cashflow
- —
- DSCR
- —
- Eligible?
- —
No personal income docs; deal must DSCR.
Hard money
10% down · 12.0% · 12mo
- Down + closing
- —
- Monthly P&I
- —
- Monthly cashflow
- —
- DSCR
- —
- Eligible?
- —
Short-term bridge; refi at stabilization.
Listing history 16 events
-
2026-06-21days on market $29,900 Active 23 DOM
-
2026-06-21days on market $29,900 Active 22 DOM
-
2026-06-18days on market $29,900 Active 20 DOM
-
2026-06-17days on market $29,900 Active 19 DOM
-
2026-06-16days on market $29,900 Active 18 DOM
-
2026-06-15days on market $29,900 Active 17 DOM
-
2026-06-13days on market $29,900 Active 15 DOM
-
2026-06-12days on market $29,900 Active 14 DOM
-
2026-06-09days on market $29,900 Active 11 DOM
-
2026-06-08days on market $29,900 Active 10 DOM
-
2026-06-07days on market $29,900 Active 9 DOM
-
2026-06-04days on market $29,900 Active 5 DOM
-
2026-06-02days on market $29,900 Active 4 DOM
-
2026-06-01days on market $29,900 Active 3 DOM
-
2026-05-31days on market $29,900 Active 2 DOM
-
2026-05-27$29,900 Active
ⓘ Source: listings_history table (triggers on properties + properties_extension) + one-shot
backfill from property_details.listing_events for pre-trigger history.
Climate risk First Street
- Flood 1/10 Low FEMA zone X (unshaded) · 0% chance over 30 yrs
- Wildfire 1/10 Low
- Heat 3/10 Moderate 7 d/yr ≥105°F today · 18 d/yr by 30 yrs out
- Wind 2/10 Low 0% chance of damaging wind over 30 yrs
- Air quality 2/10 Low 1 unhealthy d/yr today · 1 by 30 yrs out
Nearby sold comps map
Loading sold comps map…
Walkable amenities ~0.75 mi
Loading nearby amenities…
Taxation est. · year 1
- Rental income
- $12,783
- − Mortgage interest
- −$1,675
- − Property taxes
- −$448
- − Insurance
- −$150
- − Repairs & maintenance
- −$1,023
- − Management
- −$1,023
- − Depreciation
- −$870
- Taxable income
- $7,595
- Est. tax owed @ 24.0%
- −$1,823
- After-tax cash flow
- $5,796/yr
For passive investors: Depreciation is non-cash, so a rental often shows a tax loss while cash-flowing — sheltering income. Rental losses are passive: they offset passive income freely, and up to $25,000/yr can offset ordinary (W-2) income if you actively participate and your MAGI is under $100k (phasing out to $0 by $150k); unused losses carry forward. On sale, claimed depreciation is recaptured at up to 25%, and gains may owe capital-gains tax (a 1031 exchange can defer both). Figures are a year-1 estimate at your 24.0% rate — not tax advice; consult a CPA.
Condition & rehab AI · 13 photos
This property presents a good project for a moderate renovation, with visible wear and tear that could be addressed to improve its condition and value.
Repairs flagged
- Moderate Siding — Weathered and discolored
- Minor Roof — Aged but appears structurally sound
- Minor Landscaping — Overgrown and needs trimming
- Minor Electrical panel — Old and may need upgrading
- Moderate Flooring — Worn and could benefit from refinishing or replacement
- Minor Bathroom fixtures — Could use updates in terms of finishes
- Minor Kitchen appliances — Could use updates in terms of finishes
- Moderate Exterior paint — Faded and could benefit from repainting
Value-add opportunities
- Both Painting and updating exterior — Fresh paint and updated exterior would improve curb appeal and value
- Both Upgrading electrical panel — Modernizing electrical system would improve safety and value
- Both Refrishing flooring — Refinished hardwood flooring would improve aesthetics and value
- Both Updating kitchen appliances — Modern appliances would improve functionality and value
- Both Updating bathroom fixtures — Modern fixtures would improve functionality and value
- Both Landscaping and trimming — Well-maintained landscaping would improve curb appeal and value
Renovation cost estimate screening
| Repair item | Severity | Est. cost |
|---|---|---|
| Siding · Weathered and discolored | Moderate | $3,000–15,000 |
| Roof · Aged but appears structurally sound | Minor | $500–3,000 |
| Landscaping · Overgrown and needs trimming | Minor | $500–3,000 |
| Electrical panel · Old and may need upgrading | Minor | $500–3,000 |
| Flooring · Worn and could benefit from refinishing or replacement | Moderate | $3,000–15,000 |
| Bathroom fixtures · Could use updates in terms of finishes | Minor | $500–3,000 |
| Kitchen appliances · Could use updates in terms of finishes | Minor | $500–3,000 |
| Exterior paint · Faded and could benefit from repainting | Moderate | $3,000–15,000 |
| Total estimated repair cost · 8 items | $11,500–60,000 |
Value-add ROI direction
- Both Painting and updating exterior — Fresh paint and updated exterior would improve curb appeal and value ↑
- Both Upgrading electrical panel — Modernizing electrical system would improve safety and value ↑
- Both Refrishing flooring — Refinished hardwood flooring would improve aesthetics and value ↑
- Both Updating kitchen appliances — Modern appliances would improve functionality and value ↑
- Both Updating bathroom fixtures — Modern fixtures would improve functionality and value ↑
- Both Landscaping and trimming — Well-maintained landscaping would improve curb appeal and value ↑
ⓘ Cost ranges are severity-bucket heuristics (US national rule-of-thumb). Get contractor quotes + a written scope before underwriting a rehab budget.
Schools (NCES district)
- District
- Astoria CUSD 1
- NCES district ID
- 1704440
- Math proficiency
- 6% ▬ 0.00%
- Reading proficiency
- 30% ▲ 10.00%
- Median HH income
- $41,718
- Composite
- 18.74/100
- National rank
- #14004
- State rank
- #739 of 919 in IL
Livability — Astoria
- Score
- 61/100
- State rank
- #904
- US rank
- #17575
Category grades
Schools grade is shown separately in the Schools card above.
Census & demographics
- Census place
- Astoria, IL
- Population (ZIP)
- 1,612
Population outlook (Fulton County) Hauer SSP2
- Today (2025)
- 33,356 people
- By 2030
- 32,144 · -3.6%
- By 2040
- 29,518 · -11.5%
- By 2050
- 26,775 · -19.7%
- By 2075
- 19,972 · -40.1%
- By 2100
- 13,580 · -59.3%
Race, ethnicity, and origin ACS 2023
- Neighborhood character
- Predominantly White (94%)
- Race & ethnicity
- White 94% Hispanic / Latino 3% Two or more races 2%
- Common ancestry
- Iranian 3% Lithuanian 1% Slovak 1%
- Foreign-born
- 0%
Political lean MEDSL · Fulton
- 2024 margin
- Strong R (+23.8) · D 37.1% · R 60.9% · Other 2.0%
- 2008→2024 swing
- -45.2pp toward R · 2008: 21.3pp · 2024: -23.8pp
- All cycles
- 2024: R+23.8 2020: R+20.1 2016: R+15.1 2012: D+11.1 2008: D+21.3
Not yet ingested
- Civics
- —
Market trends
- HPI YoY
- ▲ 2.73%
- Current HPI
- 128.8523
- Rent YoY
- —
- Metro
- —
- State GDP YoY
- ▲ 1.59%
- F500 in state
- 60
Industry mix (Fortune 500 HQ in IL)
| Industry | F500 HQs | Revenue |
|---|---|---|
| Insurance | 4 | $201B |
|
||
| Consumer Goods | 4 | $87B |
|
||
| Industrial Machinery | 3 | $64B |
|
||
| Healthcare | 2 | $55B |
|
||
| Retail / Pharmacy | 1 | $148B |
|
||
| Agriculture / Food | 1 | $86B |
|
||
Price history
1 event — show timeline
- 2026-05-27 Listed $29,900 RMLSA as Distributed by MLS Grid
Cash-flow waterfall
monthlySold comps — $/sqft
last 12 mo · ≤1 miLoading sold comps…