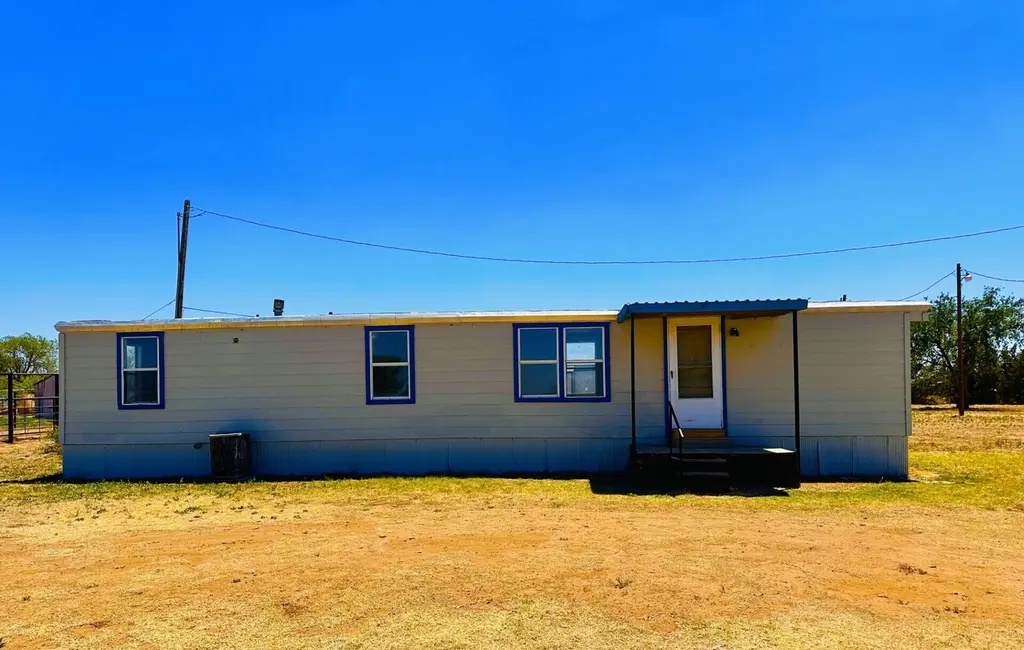
201 W Noble St · New Deal, TX
Flood risk 1/10 · Minimal
- FEMA flood zone
- X (unshaded)
- Chance of flooding over 30 yrs
- 0.0%
- Est. flood insurance / yr
- $507 – $1,088
Fire risk 3/10 · Minor
- Est. fire insurance / yr
- $1,222 – $2,270
Heat risk 5/10 · Moderate
- Hot days now (above 99°F)
- 7 days/yr
- Hot days in 30 yrs
- 21 days/yr
Wind risk 2/10 · Minimal
- Chance of severe wind over 30 yrs
- 1.0%
Air-quality risk 2/10 · Minimal
- Unhealthy air days now
- 1 days/yr
- Unhealthy air days in 30 yrs
- 1 days/yr
Risk factors via First Street. Map © Google.
Why this score? — see what drove the B- grade
The composite is a weighted blend of 9 inputs, each scored 0–100. Each bar is that input's sub-score; the figure is the points it added to the 100-point composite (weight × sub-score).
- Cash flow +30.0/30.0
- DSCR +10.0/10.0
- 1% rule +9.5/10.0
- ARV discount +7.5/15.0
- Schools +3.5/10.0
- Livability +3.5/5.0
- Rent growth +2.9/5.0
- Condition / age +2.5/5.0
- Appreciation +0.0/10.0
$89,500
🖨 Deal sheet (PDF) 📄 Offer letter ✓ Due diligence
Listing remarks
Welcome to peaceful country living with modern comfort! This beautifully remodeled 3-bedroom, 2-full-bath mobile home sits on a spacious 0.78-acre lot in New Deal, Texas, offering the perfect blend of space, privacy, and affordability Step inside to discover a fresh, updated interior featuring new finishes, and an open, inviting layout designed for comfortable everyday living. The living area flows seamlessly into the kitchen and dining space, creating a warm and welcoming environment for family gatherings and entertaining guest Outside, the nearly three-quarter-acre property gives you room to breathe and endless possibilities—whether you dream of gardening, adding a workshop, parkin
Key facts
- Spacious lot
- Open layout
- Updated interior
Tags
Property features AI
Finance
- Other: Property sits on approximately 0.78 acres
Exterior
- Parking: Additional open parking
- Security: Smoke detector(s)
- Utilities: Public water; Public sewer; Electricity connected; Water connected; Sewer connected
- Home design: Manufactured home; Residential property; Updated/remodeled
- Construction: Metal siding; Vinyl siding; Wood siding; Composition roof; Other foundation; Built in 1,300 above-grade finished area
- Exterior features: RV hookup; Front porch; Gravel road access
Interior
- Kitchen: Electric range
- Flooring: Carpet; Laminate
- Bathrooms: 2 full bathrooms
- Heating & cooling: Central heating (electric); Central air conditioning (electric)
- Interior features: Breakfast bar; Built-in features; Smoke detector(s)
- Laundry & utility: Washer hookup on main level; Electric dryer hookup on main level
Neighborhood map
What this means for you Summary
Snapshot
- This is a 3-bed/2.0-bath manufactured listed at $90k.
Deal economics
- At list price, monthly cash flow is $476 ($6k/yr) — positive.
- The deal already cash-flows at list — no discount required.
- Meets the 1% rule at list price ($1k rent vs $90k).
- Recommended offer: $87k (3.0% below list) — sets the bar for market timing.
Location & tenants
- Location reads 69/100 on livability (#426 in TX) — a middle-class / working-renter tenant base. Strengths: crime A+, employment A+, cost of living A+; Watch: health & safety C-, amenities F, commute F.
- New Deal ISD (rural): math 39% / reading 43% proficiency, ranked #368 of 826 in TX (top 45%) — families likely to look elsewhere, expect single-tenant / working-renter base with shorter leases.
- Zoned schools: New Deal El (math 32% / reading 37%, grade F, #1,995 of 4,322 statewide, top 50%, 275 students, 73% FRL); New Deal Middle (math 38% / reading 40%, grade F, #690 of 1,662 statewide, top 42%, 235 students, 72% FRL); New Deal H S (math 57% / reading 64%, grade C+, #265 of 1,632 statewide, top 16%, 244 students, 68% FRL) — zoned schools average 71% FRL vs 53% district-wide (18 pts higher); higher-poverty schools than district average — tighter screening recommended.
- Market conditions: Rents rising (+1.5%/yr); 166 active listings in the ZIP; 2,219 units permitted in Lubbock County in 2024 (252 in 5+ unit buildings).
- This rent runs 32% of the median local income ($48k/yr) — at the standard rent-burdened threshold; future hikes will face affordability resistance.
Forward outlook
- Local home prices are declining (-3.0%/yr); year-one equity from $619 of loan paydown is wiped out by about $3k of value loss. Plan a longer hold.
- Lubbock County population projected at +39% by 2050 — long-run rental-demand tailwind backs the buy-and-hold thesis.
- At projected returns (-3.0% appreciation + 1.5% rent growth), your $25k cash investment doubles in ~6 years — after that, you're playing with house money.
Negotiation context
- It's been on market 41 days — a 3% lower offer ($87k) is reasonable based on typical stale-listing flexibility.
Risks & watch-outs
- Climate carrying-cost: extreme-heat days projected 7→21/yr by 2055 (HVAC capex compounding) — expect insurance premiums to compound above CPI over the hold.
Questions for the listing agent
- It's been on market 41 days. Have you received any prior offers? Is the seller open to a 3% concession, seller financing, or rate buy-down credit?
- Is there a deadline driving the sale (1031 exchange, divorce, estate, relocation)? That informs how much negotiation room exists.
- What's the average days-on-market for RENTAL listings here right now (not sales)? A rising rental-DOM trend means longer vacancies and softer asking-rent achievability than the comps imply.
- What's the recent tenant-quality profile in this submarket — average credit score on applications, eviction rate, late-payment / NSF rate, and stable-employment percentage? A property-management company in the area should have these aggregated.
- How much new for-sale + rental construction is in the pipeline within 1–3 miles? Heavy new supply typically softens prices + rents 12–24 months out; constrained supply supports both.
Investment metrics
- 1% rule
- 1.45% ✓
- Cap rate
- 12.68%
- Cash-on-cash
- 22.81%
- DSCR
- 2.01
- GRM
- 5.7
CMA / ARV
No comps found within radius.
Projected returns pro-forma
-3.0% appreciation · 1.52% rent growth · sell at horizon
- IRR
- 14.1%
- Equity multiple
- 1.55×
- Total profit
- $13,906
- Equity at exit
- $13,345
- IRR
- 21.8%
- Equity multiple
- 2.74×
- Total profit
- $43,493
- Equity at exit
- $7,738
Cash invested: $25,060 (down + closing). Projections, not guarantees.
Landlord ↔ Tenant lean methodology
- Overall (STATE)
- 87 Strongly Landlord-Friendly
- State Texas
- 87 Strongly Landlord-Friendly · R+5
- County
- — inherits STATE
- City
- — inherits STATE
ZIP-level market 79403
- Home prices YoY
- -9.0%
- Rents YoY
- 1.5%
- Active inventory
- 166
- Price-to-rent
- 5.7×
Monthly cashflow live
- Estimated rent
- $1,297 medium interval (Pro) →
- Mortgage (P&I)
- −$469
- Tax from tax record
- −$42 /mo · $503/yr
- Insurance
- −$37
- HOA
- −$0
- Vacancy / Maint / Mgmt
- −$272
- Net cashflow
- $476
Break-even live
Sensitivity live
| Price | -10% $527 | -5% $502 | +0% $476 | +5% $451 | +10% $426 |
|---|---|---|---|---|---|
| Rent | -10% $374 | -5% $425 | +0% $476 | +5% $528 | +10% $579 |
| Rate | -1.0pp $521 | -0.5pp $499 | base $476 | +0.5pp $453 | +1.0pp $430 |
UW: 25.0% down · 7.5% · 30yr · 1.5% tax · 5.0% vac · 8.0% maint · 8.0% mgmt
Financing live
Cash to close
- Down payment
- $22,375
- Closing costs
- $2,685
- Reserves months
- —
- Total cash needed
- —
Loan-product check · same deal, 3 products live
Conventional
25% down · 7.5% · 30yr
- Down + closing
- —
- Monthly P&I
- —
- Monthly cashflow
- —
- DSCR
- —
- Eligible?
- —
Personal DTI + credit; lowest rate.
DSCR
20% down · 8.5% · 30yr
- Down + closing
- —
- Monthly P&I
- —
- Monthly cashflow
- —
- DSCR
- —
- Eligible?
- —
No personal income docs; deal must DSCR.
Hard money
10% down · 12.0% · 12mo
- Down + closing
- —
- Monthly P&I
- —
- Monthly cashflow
- —
- DSCR
- —
- Eligible?
- —
Short-term bridge; refi at stabilization.
Listing history 19 events
-
2026-06-21days on market $89,500 Active 41 DOM
-
2026-06-18days on market $89,500 Active 38 DOM
-
2026-06-17days on market $89,500 Active 37 DOM
-
2026-06-16days on market $89,500 Active 36 DOM
-
2026-06-15days on market $89,500 Active 35 DOM
-
2026-06-14days on market $89,500 Active 33 DOM
-
2026-06-13days on market $89,500 Active 32 DOM
-
2026-06-10days on market $89,500 Active 30 DOM
-
2026-06-09days on market $89,500 Active 29 DOM
-
2026-06-08days on market $89,500 Active 28 DOM
-
2026-06-07days on market $89,500 Active 27 DOM
-
2026-06-03days on market $89,500 Active 23 DOM
-
2026-06-02days on market $89,500 Active 22 DOM
-
2026-06-01days on market $89,500 Active 21 DOM
-
2026-05-31days on market $89,500 Active 20 DOM
-
2026-05-30days on market $89,500 Active 19 DOM
-
2026-05-11$89,500 Active 1090-char remark
-
2023-10-27soldstatus
-
1993-06-01soldstatus
ⓘ Source: listings_history table (triggers on properties + properties_extension) + one-shot
backfill from property_details.listing_events for pre-trigger history.
Tax reassessment forecast TX · Resets to sale price
- Current annual tax
- $503 · $42/mo
- Projected year-2 tax
- $1,638 · $136/mo
- Expected delta
- +$1,135/yr (+$95/mo · 225.8%)
ⓘ Screening estimate from a state-policy table — verify with the county assessor before closing.
Climate risk First Street
- Flood 1/10 Low FEMA zone X (unshaded) · 0% chance over 30 yrs
- Wildfire 3/10 Moderate
- Heat 5/10 Major 7 d/yr ≥99°F today · 21 d/yr by 30 yrs out
- Wind 2/10 Low 100% chance of damaging wind over 30 yrs
- Air quality 2/10 Low 1 unhealthy d/yr today · 1 by 30 yrs out
Nearby sold comps map
Loading sold comps map…
Walkable amenities ~0.75 mi
Loading nearby amenities…
Taxation est. · year 1
- Rental income
- $15,567
- − Mortgage interest
- −$5,013
- − Property taxes
- −$503
- − Insurance
- −$448
- − Repairs & maintenance
- −$1,245
- − Management
- −$1,245
- − Depreciation
- −$2,604
- Taxable income
- $4,509
- Est. tax owed @ 24.0%
- −$1,082
- After-tax cash flow
- $4,633/yr
For passive investors: Depreciation is non-cash, so a rental often shows a tax loss while cash-flowing — sheltering income. Rental losses are passive: they offset passive income freely, and up to $25,000/yr can offset ordinary (W-2) income if you actively participate and your MAGI is under $100k (phasing out to $0 by $150k); unused losses carry forward. On sale, claimed depreciation is recaptured at up to 25%, and gains may owe capital-gains tax (a 1031 exchange can defer both). Figures are a year-1 estimate at your 24.0% rate — not tax advice; consult a CPA.
Schools (NCES district)
- District
- New Deal ISD
- NCES district ID
- 4832430
- Math proficiency
- 39% ▼ -3.00%
- Reading proficiency
- 43% ▼ -2.00%
- Median HH income
- $48,346
- Composite
- 35.15/100
- National rank
- #5009
- State rank
- #368 of 826 in TX
Livability — New Deal
- Score
- 69/100
- State rank
- #426
- US rank
- #8833
Category grades
Schools grade is shown separately in the Schools card above.
Census & demographics
- Census place
- New Deal, TX
- County
- Lubbock County · 293,542 people
- Metro
- Lubbock, TX
- Population (ZIP)
- 16,089
- Household income
- $47,907
- Rent vs Own
- Severe rent burden
- 612.0
Population outlook (Lubbock County) Hauer SSP2
- Today (2025)
- 345,960 people
- By 2030
- 371,449 · +7.4%
- By 2040
- 424,539 · +22.7%
- By 2050
- 481,150 · +39.1%
- By 2075
- 633,467 · +83.1%
- By 2100
- 746,853 · +115.9%
Race, ethnicity, and origin ACS 2023
- Neighborhood character
- Diverse neighborhood (Simpson 0.64)
- Race & ethnicity
- Hispanic / Latino 49% White 26% Black 23% Two or more races 16% Native American 1%
- Hispanic origin (detail)
- Mexican 35%
- Common ancestry
- Slovak 1%
- Foreign-born
- 3% · Canada
- Languages at home
- 74% English-only · Spanish 25%
Political lean MEDSL · Lubbock
- 2024 margin
- Solid R (+39.5) · D 29.7% · R 69.2% · Other 1.0%
- 2008→2024 swing
- -2.8pp toward R · 2008: -36.7pp · 2024: -39.5pp
- All cycles
- 2024: R+39.5 2020: R+32.2 2016: R+38.4 2012: R+40.9 2008: R+36.7
Not yet ingested
- Civics
- —
Market trends
- HPI YoY
- ▼ -17.69%
- Current HPI
- 178.9297
- Rent YoY
- ▲ 1.52%
- Metro
- Lubbock, TX
- State GDP YoY
- ▲ 3.95%
- F500 in state
- 110
Industry mix (Fortune 500 HQ in TX)
| Industry | F500 HQs | Revenue |
|---|---|---|
| Energy | 16 | $1,198B |
|
||
| Technology | 5 | $198B |
|
||
| Engineering / Construction | 4 | $72B |
|
||
| Energy Services | 3 | $60B |
|
||
| Utilities | 3 | $41B |
|
||
| Healthcare | 2 | $330B |
|
||
Price history
3 events — show timeline
- 2026-05-11 Listed $89,500 LARMLS
- 2023-10-27 Sold (Public Records) — Public Records
- 1993-06-01 Sold (Public Records) — Public Records
Property tax history
-8.4%/yrLatest (2025): $503 · +1.8% YoY. Source: county tax records.
Cash-flow waterfall
monthlySold comps — $/sqft
last 12 mo · ≤1 miLoading sold comps…