 Duplex
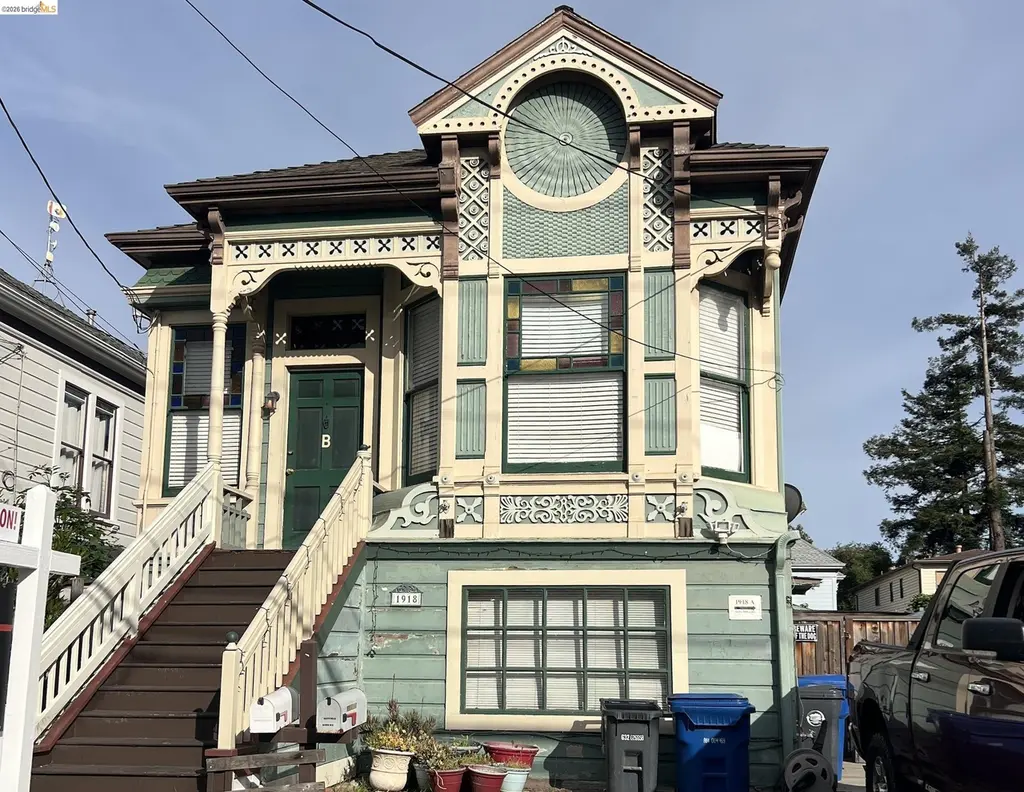
1918 Lafayette St · Alameda, CA
Flood risk 1/10 · Minimal
- FEMA flood zone
- X (unshaded)
- Chance of flooding over 30 yrs
- 0.0%
- Est. flood insurance / yr
- $507 – $1,088
Fire risk 1/10 · Minimal
- Est. fire insurance / yr
- $659 – $1,223
Heat risk 3/10 · Minor
- Hot days now (above 83°F)
- 7 days/yr
- Hot days in 30 yrs
- 15 days/yr
Wind risk 1/10 · Minimal
- Chance of severe wind over 30 yrs
- —
Air-quality risk 8/10 · Major
- Unhealthy air days now
- 14 days/yr
- Unhealthy air days in 30 yrs
- 14 days/yr
Risk factors via First Street. Map © Google.
Why this score? — see what drove the C- grade
The composite is a weighted blend of 9 inputs, each scored 0–100. Each bar is that input's sub-score; the figure is the points it added to the 100-point composite (weight × sub-score).
- ARV discount +15.0/15.0
- Cash flow +14.2/30.0
- Schools +5.9/10.0
- DSCR +4.3/10.0
- Rent growth +3.4/5.0
- Livability +3.4/5.0
- 1% rule +3.3/10.0
- Condition / age +2.5/5.0
- Appreciation +0.0/10.0
$745,000
🖨 Deal sheet (PDF) 📄 Offer letter ✓ Due diligence
Multi-family units
County records classify this as Multi-Family (2-4 Unit). Listing-text estimate: 2 units. confirmed
Listing remarks MLS
CHARMING OLD VICTORIAN. TWO CLEAN UNITS. GREAT LOCATION/AREA. THIS IS AN REO, NEW ON MARKET.
Key facts
- 4,764 sq ft lot
- Built 1894
Property features AI
Finance
- Financial info: Two-unit income property
Exterior
- Parking: Off-street parking; 2 parking spaces total (1 space allocated to each unit)
- Utilities: Individual electric meter; Individual gas meter
- Home design: Residential income duplex; Originally built in 1894
- Construction: Wood construction
- Exterior features: Back yard; Side yard; Storage; Fenced; Level lot
Interior
- Kitchen: Dishwasher (some units)
- Bedrooms: Duplex (2 total units)
- Flooring: Laminate; Vinyl; Carpet
- Bathrooms: Unit 1: 1 bathroom; Unit 2: 1.5 bathrooms
- Heating & cooling: Natural gas heating; No air conditioning
- Interior features: Apartment-style basement; Deck (some units); Dishwasher (some units); Storage; Back yard; Side yard; Fenced
- Laundry & utility: Washer; Dryer; Gas water heater
Neighborhood map
What this means for you Summary
Snapshot
- This is a 2 × 2-bed/1-bath units multifamily listed at $745k.
Deal economics
- At list price, monthly cash flow is $122 ($1k/yr) — positive. Per door: $61/mo.
- The deal already cash-flows at list — no discount required.
- To meet the 1% rule (rent ≥ 1% of price), the offer needs to be $620k (16.8% below list).
- Recommended offer: $620k (16.8% below list) — sets the bar for 1% rule.
- Cap rate 6.5% vs local median 1.7% in Alameda — top-decile yield for the area; either an underpriced asset or a hidden risk that comps aren't pricing in. Stress-test before assuming the spread holds.
Location & tenants
- Location reads 68/100 on livability (#281 in CA) — a middle-class / working-renter tenant base. Strengths: commute A+, employment A+, health & safety B+; Watch: crime F, amenities F, cost of living F.
- Alameda Unified (suburban): math 59% / reading 70% proficiency, ranked #149 of 1,400 in CA (top 11%) — acceptable for families but not a draw, mixed tenant base, ~2y average lease.
- Zoned schools: Love Elementary (471 students, 49% FRL); Will C. Wood Middle (610 students, 55% FRL); Alameda High (1,802 students, 31% FRL) — zoned schools average 45% FRL vs 25% district-wide (20 pts higher); higher-poverty schools than district average — tighter screening recommended.
- Market conditions: Rents rising (+3.5%/yr); 177 active listings in the ZIP; 9 comparable units currently listed for rent nearby; rentals at typical pace (median 15d on market — plan ~3-4 weeks tenant-placement turnaround); high-income renter base; 1,742 units permitted in Alameda County in 2024 (856 in 5+ unit buildings).
- At $6,196/mo this rent would consume 58% of the median local household income ($128k/yr) (locally 3146% of renters already pay >50% of income on rent) — very limited rent-growth headroom before tenants either downsize or default.
Forward outlook
- Local home prices are declining (-3.0%/yr); year-one equity from $5k of loan paydown is wiped out by about $22k of value loss. Plan a longer hold.
- Alameda County population projected at +34% by 2050 — long-run rental-demand tailwind backs the buy-and-hold thesis.
Negotiation context
- Only 1 days on market — expect competitive offers; lowballing is unlikely to land.
- Current owner paid $200k; list at $745k implies a 272% gain — meaningful room to come down on a strong offer.
Risks & watch-outs
- Watch-outs: built in 1894 — expect roof / HVAC / electrical / plumbing capex.
Questions for the listing agent
- Can we see the unit-by-unit rent roll, current vacancy, and any below-market leases? What's the average tenancy length?
- What capital expenditures (roof, boiler, parking lot, exteriors) have been made in the last 5 years, and what's planned in the next 2?
- Built in 1894 — when were the roof, HVAC, electrical panel, plumbing, and water heater last replaced?
- Is there a deadline driving the sale (1031 exchange, divorce, estate, relocation)? That informs how much negotiation room exists.
- Schools are B-rated — typically a magnet for longer-tenancy family renters. What's the average tenant stay here, and is there a school-zone premium baked into asking?
- Crime grade is F in this area — have there been break-ins, vandalism, or insurance claims at this property in the last 3 years? What carrier currently insures it and at what premium?
- What's the average days-on-market for RENTAL listings here right now (not sales)? A rising rental-DOM trend means longer vacancies and softer asking-rent achievability than the comps imply.
- What's the recent tenant-quality profile in this submarket — average credit score on applications, eviction rate, late-payment / NSF rate, and stable-employment percentage? A property-management company in the area should have these aggregated.
- How much new apartment / multifamily construction is in the pipeline within 1–3 miles? Heavy new supply (>2% of stock underway) typically softens rents 12–24 months out; light construction supports rent growth.
Investment metrics
- 1% rule
- 0.83% ✗
- Cap rate
- 6.49%
- Cash-on-cash
- 0.70%
- DSCR
- 1.03
- GRM
- 10.0
CMA / ARV
- ARV (on-the-fly)
- $1,072,260
- Comps found
- 3
Show comp detail 3 sales within ~0.75 mi
| Address | Dist | Beds/Ba | Sqft | Sold | Price | $/sf | Match |
|---|---|---|---|---|---|---|---|
| 1421 Chestnut St | 0.38mi | 4/2.0 | 1,719 (-11%) | 7mo | $1,050,000 | $611 | 46 |
| 1822 San Antonio Ave | 0.65mi | 2/2.0 | 2,107 (+9%) | 4mo | $1,170,000 | $555 | 39 |
| 1443 Stanton St | 0.58mi | 4/4.0 | 2,096 (+8%) | 19mo | $1,040,000 | $496 | 39 |
Match score weights: distance 35% · size 25% · config 20% · recency 20%. Top-matched comps best support the ARV.
Projected returns pro-forma
-3.0% appreciation · 3.52% rent growth · sell at horizon
- IRR
- -14.7%
- Equity multiple
- 0.47×
- Total profit
- $-109,847
- Equity at exit
- $111,082
- IRR
- -5.2%
- Equity multiple
- 0.65×
- Total profit
- $-72,712
- Equity at exit
- $64,414
Cash invested: $208,600 (down + closing). Projections, not guarantees.
Landlord ↔ Tenant lean methodology
- Overall (STATE)
- 18 Strongly Tenant-Friendly
- State California
- 18 Strongly Tenant-Friendly · D+13
- County
- — inherits STATE
- City
- — inherits STATE
ZIP-level market 94501
- Rents YoY
- 3.5%
- Active inventory
- 177
- Price-to-rent
- 20.0×
Monthly cashflow live
- Estimated rent
- $6,196 high interval (Pro) →
- Mortgage (P&I)
- −$3,907
- Tax from tax record
- −$556 /mo · $6,670/yr
- Insurance
- −$310
- HOA
- −$0
- Vacancy / Maint / Mgmt
- −$1,301
- Net cashflow
- $122
Break-even live
Sensitivity live
| Price | -10% $543 | -5% $333 | +0% $122 | +5% $-89 | +10% $-300 |
|---|---|---|---|---|---|
| Rent | -10% $-368 | -5% $-123 | +0% $122 | +5% $366 | +10% $611 |
| Rate | -1.0pp $497 | -0.5pp $311 | base $122 | +0.5pp $-71 | +1.0pp $-268 |
2-unit breakdown (identical units grouped — click to expand)
| Units | Beds | Baths | Est. rent |
|---|---|---|---|
| 2× units | 2 | 1 | $6,196 |
| #1 | 2 | 1 | $3,098 |
| #2 | 2 | 1 | $3,098 |
| Total (2 units) | $6,196 | ||
UW: 25.0% down · 7.5% · 30yr · 1.5% tax · 5.0% vac · 8.0% maint · 8.0% mgmt
Financing live
Cash to close
- Down payment
- $186,250
- Closing costs
- $22,350
- Reserves months
- —
- Total cash needed
- —
Loan-product check · same deal, 3 products live
Conventional
25% down · 7.5% · 30yr
- Down + closing
- —
- Monthly P&I
- —
- Monthly cashflow
- —
- DSCR
- —
- Eligible?
- —
Personal DTI + credit; lowest rate.
DSCR
20% down · 8.5% · 30yr
- Down + closing
- —
- Monthly P&I
- —
- Monthly cashflow
- —
- DSCR
- —
- Eligible?
- —
No personal income docs; deal must DSCR.
Hard money
10% down · 12.0% · 12mo
- Down + closing
- —
- Monthly P&I
- —
- Monthly cashflow
- —
- DSCR
- —
- Eligible?
- —
Short-term bridge; refi at stabilization.
Rent comps 9 comps
| Address | Beds | Baths | Sqft | Rent | $/sqft | DOM | Units | Dist |
|---|---|---|---|---|---|---|---|---|
| 1777 Clement Ave Alameda, CA | 2.0 | 1.0–2.0 | 1257 | $6,013 | $4.78 | 0d | 27 | 0.13mi |
| 1501 Buena Vista Ave #1873 Alameda, CA | 2.0 | 2.0 | 1269 | $4,730 | $3.73 | 22d | 1 | 0.58mi |
| 1518 Clement Ave Alameda, CA | 3.0 | 1.0–3.0 | 1108 | $4,874 | $4.40 | 0d | 19 | 0.59mi |
| 2875 Glascock St #105 Oakland, CA | 2.0 | 2.0 | 1463 | $3,500 | $2.39 | 45d | 1 | 0.82mi |
| 2889 Ford St Oakland, CA | 1.0 | 1.0 | 1450 | $2,795 | $1.93 | 14d | 1 | 0.88mi |
| 1820 International Blvd Unit 1 Oakland, CA | 2.0 | 1.5 | 1900 | $1,710 | $0.90 | 45d | 1 | 1.02mi |
| 37 8th Ave Oakland, CA | 3.0 | 1.0–2.0 | 963 | $3,947 | $4.10 | 0d | 17 | 1.08mi |
| 260 Brooklyn Basin Way Oakland, CA | 3.0 | 1.0–2.0 | 939 | $3,864 | $4.11 | 0d | 11 | 1.10mi |
| 1224 International Blvd Oakland, CA | 1.0 | 1.0 | 2590 | $3,500 | $1.35 | 45d | 1 | 1.14mi |
Listing history 5 events
-
2026-05-07status Pending
-
2026-04-21historical $745,000
-
1996-12-30soldstatus $200,000 92-char remark
Show marketing remark (92 chars)
CHARMING OLD VICTORIAN. TWO CLEAN UNITS. GREAT LOCATION/AREA. THIS IS AN REO, NEW ON MARKET.
-
1996-11-21historical 92-char remark
Show marketing remark (92 chars)
CHARMING OLD VICTORIAN. TWO CLEAN UNITS. GREAT LOCATION/AREA. THIS IS AN REO, NEW ON MARKET.
-
1996-11-06$199,900 92-char remark
Show marketing remark (92 chars)
CHARMING OLD VICTORIAN. TWO CLEAN UNITS. GREAT LOCATION/AREA. THIS IS AN REO, NEW ON MARKET.
ⓘ Source: listings_history table (triggers on properties + properties_extension) + one-shot
backfill from property_details.listing_events for pre-trigger history.
Tax reassessment forecast CA · Resets to sale price
- Current annual tax
- $6,670 · $556/mo
- Projected year-2 tax
- $6,670 · $556/mo
- Expected delta
- $0/yr ($0/mo · 0.0%)
ⓘ Screening estimate from a state-policy table — verify with the county assessor before closing.
Climate risk First Street
- Flood 1/10 Low FEMA zone X (unshaded) · 0% chance over 30 yrs
- Wildfire 1/10 Low
- Heat 3/10 Moderate 7 d/yr ≥83°F today · 15 d/yr by 30 yrs out
- Wind 1/10 Low
- Air quality 8/10 Severe 14 unhealthy d/yr today · 14 by 30 yrs out
Nearby sold comps map
Loading sold comps map…
Walkable amenities ~0.75 mi
Loading nearby amenities…
Taxation est. · year 1
- Rental income
- $74,352
- − Mortgage interest
- −$41,732
- − Property taxes
- −$6,670
- − Insurance
- −$3,725
- − Repairs & maintenance
- −$5,948
- − Management
- −$5,948
- − Depreciation
- −$21,673
- Taxable loss
- −$11,343
- Est. tax savings @ 24.0%
- +$2,722
- After-tax cash flow
- $4,183/yr
For passive investors: Depreciation is non-cash, so a rental often shows a tax loss while cash-flowing — sheltering income. Rental losses are passive: they offset passive income freely, and up to $25,000/yr can offset ordinary (W-2) income if you actively participate and your MAGI is under $100k (phasing out to $0 by $150k); unused losses carry forward. On sale, claimed depreciation is recaptured at up to 25%, and gains may owe capital-gains tax (a 1031 exchange can defer both). Figures are a year-1 estimate at your 24.0% rate — not tax advice; consult a CPA.
Schools (NCES district)
- District
- Alameda Unified
- NCES district ID
- 0601770
- Math proficiency
- 59% ▼ -1.00%
- Reading proficiency
- 70% ▲ 2.00%
- Median HH income
- $79,989
- Composite
- 59.07/100
- National rank
- #1949
- State rank
- #149 of 1400 in CA
Livability — Alameda
- Score
- 68/100
- State rank
- #281
- US rank
- #9455
Category grades
Schools grade is shown separately in the Schools card above.
Census & demographics
- Census place
- Alameda, CA
- County
- Alameda County · 1,614,355 people
- City population
- 63,808
- Metro
- San Francisco-Oakland-Berkeley, CA
- Population (ZIP)
- 63,808
- Household income
- $127,906
- Rent vs Own
- Severe rent burden
- 3146.0
Population outlook (Alameda County) Hauer SSP2
- Today (2025)
- 1,928,884 people
- By 2030
- 2,069,146 · +7.3%
- By 2040
- 2,338,405 · +21.2%
- By 2050
- 2,586,608 · +34.1%
- By 2075
- 3,061,911 · +58.7%
- By 2100
- 3,234,133 · +67.7%
Race, ethnicity, and origin ACS 2023
- Neighborhood character
- Highly diverse neighborhood (Simpson 0.73)
- Race & ethnicity
- White 41% Asian 28% Two or more races 15% Hispanic / Latino 14% Black 7%
- Hispanic origin (detail)
- Mexican 9%
- Common ancestry
- Italian 3% Romanian 2% Slovak 2%
- Foreign-born
- 25% · China, Canada, Vietnam
- Languages at home
- 65% English-only · Chinese 8% Spanish 8% Tagalog/Filipino 4%
Political lean MEDSL · Alameda
- 2024 margin
- Solid D (+53.6) · D 74.6% · R 21.0% · Other 4.4%
- 2008→2024 swing
- -5.9pp toward R · 2008: 59.5pp · 2024: 53.6pp
- All cycles
- 2024: D+53.6 2020: D+62.5 2016: D+64.4 2012: D+59.8 2008: D+59.5
Not yet ingested
- Civics
- —
Market trends
- HPI YoY
- ▼ -1187.80%
- Current HPI
- 286.9207
- Rent YoY
- ▲ 3.52%
- Metro
- San Francisco-Oakland-Berkeley, CA
- State GDP YoY
- ▲ 3.21%
- F500 in state
- 116
Industry mix (Fortune 500 HQ in CA)
| Industry | F500 HQs | Revenue |
|---|---|---|
| Technology | 27 | $1,492B |
|
||
| Financial Services | 3 | $174B |
|
||
| Retail | 3 | $44B |
|
||
| Insurance | 3 | $26B |
|
||
| Media / Entertainment | 2 | $115B |
|
||
| Pharmaceuticals / Biotech | 2 | $62B |
|
||
Price history
+272.7% since first listed5 events — show timeline
- 2026-05-07 Pending — bridgeMLS, Bay East AOR, or Contra Costa AOR
- 2026-04-21 Coming Soon $745,000 bridgeMLS, Bay East AOR, or Contra Costa AOR
- 1996-12-30 Sold (MLS) $200,000 bridgeMLS, Bay East AOR, or Contra Costa AOR
- 1996-11-21 Listing Removed — bridgeMLS, Bay East AOR, or Contra Costa AOR
- 1996-11-06 Listed $199,900 bridgeMLS, Bay East AOR, or Contra Costa AOR
Property tax history
+3.0%/yrLatest (2025): $6,670 · +1.5% YoY. Source: county tax records.
Cash-flow waterfall
monthlySold comps — $/sqft
last 12 mo · ≤1 miLoading sold comps…