 🔨 Auction
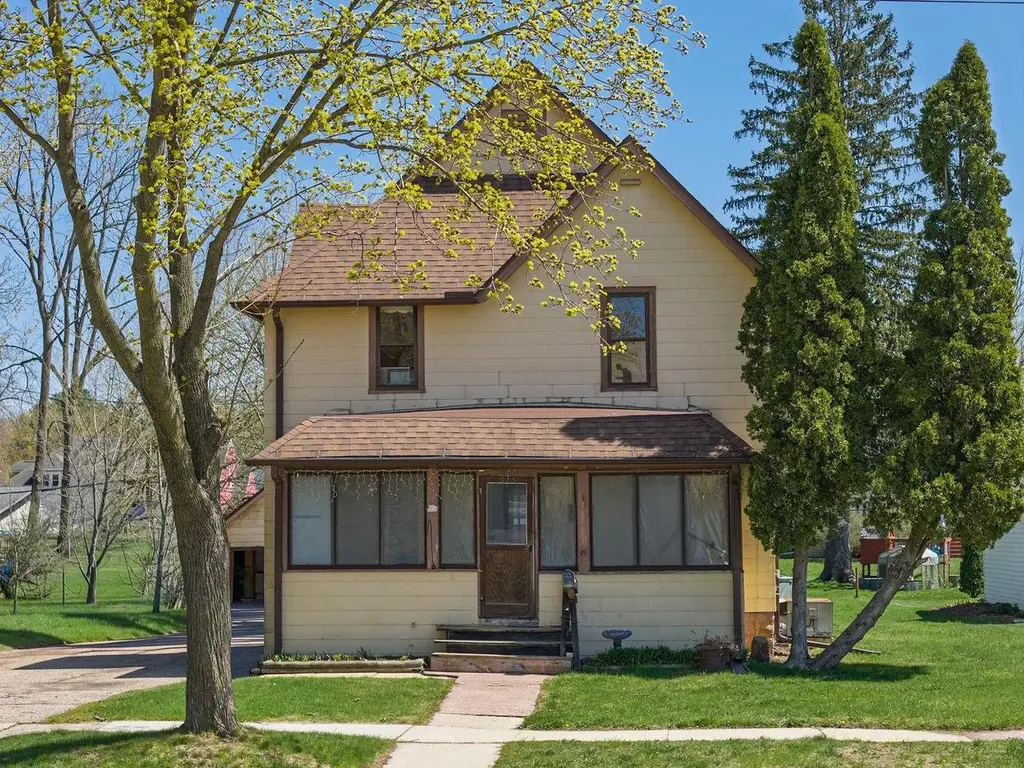
315 S Pine St · Reedsburg, WI
Flood risk 6/10 · Moderate
- FEMA flood zone
- X (shaded)
- Chance of flooding over 30 yrs
- 0.71%
- Est. flood insurance / yr
- $473 – $860
Fire risk 3/10 · Minor
- Est. fire insurance / yr
- $636 – $1,182
Heat risk 2/10 · Minimal
- Hot days now (above 99°F)
- 7 days/yr
- Hot days in 30 yrs
- 14 days/yr
Wind risk 2/10 · Minimal
- Chance of severe wind over 30 yrs
- —
Air-quality risk 2/10 · Minimal
- Unhealthy air days now
- 0 days/yr
- Unhealthy air days in 30 yrs
- 1 days/yr
Risk factors via First Street. Map © Google.
Why this score? — see what drove the F grade
The composite is a weighted blend of 9 inputs, each scored 0–100. Each bar is that input's sub-score; the figure is the points it added to the 100-point composite (weight × sub-score).
- Cash flow +8.0/30.0
- ARV discount +7.5/15.0
- Livability +3.7/5.0
- Schools +2.9/10.0
- Rent growth +2.5/5.0
- Condition / age +2.5/5.0
- 1% rule +2.0/10.0
- DSCR +2.0/10.0
- Appreciation +0.0/10.0
$50,000
🖨 Deal sheet 📄 Offer letter ✓ Due diligence
Listing remarks MLS
Offered at online auction ending Wednesday, May 27th at 11:00 AM. Listing price reflects SUGGESTED STARTING BID. $5,000 down in earnest money & sign an Offer to Purchase w/ no contingencies within 24 hours of auction ending. Property is being sold in its AS IS condition & subject to the owner's approval. Here is your opportunity to put your personal touches on a home and make it your own or flip. Close to downtown Reedsburg, you'll love the convenience of being within walking distance of several local businesses. This 4 bedroom, 1 bathroom home has plenty of storage inside and out.
Key facts
- Plenty storage
- 0.25 acre lot
- Garage
Tags
Neighborhood map
What this means for you Summary
Snapshot
- This is a 4-bed/1.0-bath single-family listed at $50k.
Deal economics
- At list price, monthly cash flow is $-223 ($-3k/yr) — negative.
- The deal already cash-flows at list — no discount required.
- Meets the 1% rule at list price ($2k rent vs $50k).
- Recommended offer: $48k (3.0% below list) — sets the bar for market timing.
- Cap rate 5.1% vs local median 2.2% in Reedsburg — top-decile yield for the area; either an underpriced asset or a hidden risk that comps aren't pricing in. Stress-test before assuming the spread holds.
Location & tenants
- Location reads 74/100 on livability (#187 in WI, #4,937 nationally) — a middle-class / working-renter tenant base. Strengths: cost of living A+, housing A+, crime B+; Watch: schools C-, health & safety D, amenities F.
- Reedsburg School District (town): math 31% / reading 36% proficiency, ranked #242 of 342 in WI (top 71%) — families likely to look elsewhere, expect single-tenant / working-renter base with shorter leases.
- Market conditions: 66 active listings in the ZIP; 1 comparable units currently listed for rent nearby; solid renter incomes; 527 units permitted in Sauk County in 2024 (268 in 5+ unit buildings).
Forward outlook
- Local home prices are declining (-3.0%/yr); year-one equity from $1k of loan paydown is wiped out by about $7k of value loss. Plan a longer hold.
Negotiation context
- It's been on market 35 days — a 3% lower offer ($48k) is reasonable based on typical stale-listing flexibility.
Risks & watch-outs
- Watch-outs: property tax is 4.8% of price; built in 1902 — expect roof / HVAC / electrical / plumbing capex.
- Climate carrying-cost: major flood risk — expect insurance premiums to compound above CPI over the hold.
Questions for the listing agent
- What do current leases actually rent for vs. the listed asking? Can we see a recent rent roll and the last 12 months of T-12 income?
- It's been on market 35 days. Have you received any prior offers? Is the seller open to a 3% concession, seller financing, or rate buy-down credit?
- Built in 1902 — when were the roof, HVAC, electrical panel, plumbing, and water heater last replaced?
- Property tax is high relative to price — has the assessment been appealed recently, and will the sale trigger a re-assessment?
- Is there a deadline driving the sale (1031 exchange, divorce, estate, relocation)? That informs how much negotiation room exists.
- The area grade is low — what's the realistic commute time and amenity access for the typical tenant pool here? Any planned neighborhood developments (good or bad) we should know about?
- What's the average days-on-market for RENTAL listings here right now (not sales)? A rising rental-DOM trend means longer vacancies and softer asking-rent achievability than the comps imply.
- What's the recent tenant-quality profile in this submarket — average credit score on applications, eviction rate, late-payment / NSF rate, and stable-employment percentage? A property-management company in the area should have these aggregated.
- How much new for-sale + rental construction is in the pipeline within 1–3 miles? Heavy new supply typically softens prices + rents 12–24 months out; constrained supply supports both.
Investment metrics
- 1% rule
- 0.70% ✗
- Cap rate
- 5.06%
- Cash-on-cash
- -4.40%
- DSCR
- 0.80
- GRM
- 11.8
CMA / ARV
- ARV (median comp)
- $216,707
- List price
- $50,000
- Delta
- -76.93%
- Verdict
- UNDERPRICED
- Comps
- 20 within 1.0 mi
Show comp detail 12 sales within ~0.75 mi
| Address | Dist | Beds/Ba | Sqft | Sold | Price | $/sf | Match |
|---|---|---|---|---|---|---|---|
| 628 Booster Blvd | 0.26mi | 3/2.0 (-1) | 1,308 (-3%) | 1mo | $231,000 | $177 | 72 |
| 342 Warren Ave | 0.07mi | 3/1.5 (-1) | 1,403 (+4%) | 14mo | $242,000 | $172 | 72 |
| 240 3rd St | 0.37mi | 3/2.0 (-1) | 1,414 (+5%) | 1mo | $257,000 | $182 | 66 |
| 609 N Walnut St | 0.63mi | 3/2.0 (-1) | 1,320 (-2%) | 7mo | $255,000 | $193 | 52 |
| 804 Seymour St | 0.49mi | 3/1.5 (-1) | 1,530 (+13%) | 2mo | $275,000 | $180 | 47 |
| 337 W Main St | 0.75mi | 3/1.0 (-1) | 1,392 (+3%) | 12mo | $167,000 | $120 | 45 |
| 127 S Willow St | 0.25mi | 3/1.5 (-1) | 1,540 (+14%) | 15mo | $215,000 | $140 | 45 |
| 612 8th St | 0.67mi | 3/1.5 (-1) | 1,400 (+4%) | 15mo | $148,000 | $106 | 43 |
| 102 S Albert Ave | 0.71mi | 3/1.0 (-1) | 1,516 (+12%) | 2mo | $220,000 | $145 | 40 |
| 247 N Grove St | 0.47mi | 3/2.0 (-1) | 1,224 (-10%) | 18mo | $165,000 | $135 | 39 |
| 225 N Dewey Ave | 0.52mi | 3/1.5 (-1) | 1,192 (-12%) | 18mo | $199,000 | $167 | 34 |
| 744 8th St | 0.69mi | 3/1.5 (-1) | 1,218 (-10%) | 17mo | $213,500 | $175 | 30 |
Match score weights: distance 35% · size 25% · config 20% · recency 20%. Top-matched comps best support the ARV.
Projected returns pro-forma
-3.0% appreciation · 3.0% rent growth · sell at horizon
- IRR
- -23.8%
- Equity multiple
- 0.19×
- Total profit
- $-49,315
- Equity at exit
- $32,312
- IRR
- -18.8%
- Equity multiple
- -0.01×
- Total profit
- $-61,284
- Equity at exit
- $18,737
Cash invested: $60,678 (down + closing). Projections, not guarantees.
Landlord ↔ Tenant lean methodology
- Overall (STATE)
- 73 Landlord-Friendly
- State Wisconsin
- 73 Landlord-Friendly · R+2
- County
- — inherits STATE
- City
- — inherits STATE
ZIP-level market 53959
- Home prices YoY
- -34.7%
- Active inventory
- 66
- Price-to-rent
- 2.7×
Monthly cashflow live
- Estimated rent
- $1,524 medium interval (Pro) →
- Mortgage (P&I)
- −$1,136
- Tax from tax record
- −$200 /mo · $2,402/yr
- Insurance
- −$90
- HOA
- −$0
- Vacancy / Maint / Mgmt
- −$320
- Net cashflow
- $-223
Break-even live
UW: 25.0% down · 7.5% · 30yr · 1.5% tax · 5.0% vac · 8.0% maint · 8.0% mgmt
Financing live
Cash to close
- Down payment
- $54,177
- Closing costs
- $6,501
- Reserves months
- —
- Total cash needed
- —
Loan-product check · same deal, 3 products live
Conventional
25% down · 7.5% · 30yr
- Down + closing
- —
- Monthly P&I
- —
- Monthly cashflow
- —
- DSCR
- —
- Eligible?
- —
Personal DTI + credit; lowest rate.
DSCR
20% down · 8.5% · 30yr
- Down + closing
- —
- Monthly P&I
- —
- Monthly cashflow
- —
- DSCR
- —
- Eligible?
- —
No personal income docs; deal must DSCR.
Hard money
10% down · 12.0% · 12mo
- Down + closing
- —
- Monthly P&I
- —
- Monthly cashflow
- —
- DSCR
- —
- Eligible?
- —
Short-term bridge; refi at stabilization.
Rent comps 1 comps
| Address | Beds | Baths | Sqft | Rent | $/sqft | DOM | Units | Dist |
|---|---|---|---|---|---|---|---|---|
| 201 S Walnut St Reedsburg, WI | 1.0–3.0 | 1.0–2.0 | 871 | $1,285 | $1.48 | 23d | 1 | 0.21mi |
Listing history 1 events
-
2026-04-22$50,000 Active 600-char remark
Show marketing remark (600 chars)
Offered at online auction ending Wednesday, May 27th at 11:00 AM. Listing price reflects SUGGESTED STARTING BID. $5,000 down in earnest money & sign an Offer to Purchase w/ no contingencies within 24 hours of auction ending. Property is being sold in its AS IS condition & subject to the owner's approval. Here is your opportunity to put your personal touches on a home and make it your own or flip. Close to downtown Reedsburg, you'll love the convenience of being within walking distance of several local businesses. This 4 bedroom, 1 bathroom home has plenty of storage inside and out.
ⓘ Source: listings_history table (triggers on properties + properties_extension) + one-shot
backfill from property_details.listing_events for pre-trigger history.
Tax reassessment forecast WI · Partial reset (capped growth)
- Current annual tax
- $2,402 · $200/mo
- Projected year-2 tax
- $2,402 · $200/mo
- Expected delta
- $0/yr ($0/mo · 0.0%)
ⓘ Screening estimate from a state-policy table — verify with the county assessor before closing.
Climate risk First Street
- Flood 6/10 Major FEMA zone X (shaded) · 71% chance over 30 yrs
- Wildfire 3/10 Moderate
- Heat 2/10 Low 7 d/yr ≥99°F today · 14 d/yr by 30 yrs out
- Wind 2/10 Low
- Air quality 2/10 Low 0 unhealthy d/yr today · 1 by 30 yrs out
Nearby sold comps map
Loading sold comps map…
Walkable amenities ~0.75 mi
Loading nearby amenities…
Taxation est. · year 1
- Rental income
- $18,293
- − Mortgage interest
- −$12,139
- − Property taxes
- −$2,402
- − Insurance
- −$1,084
- − Repairs & maintenance
- −$1,463
- − Management
- −$1,463
- − Depreciation
- −$6,304
- Taxable loss
- −$6,563
- Est. tax savings @ 24.0%
- +$1,575
- After-tax cash flow
- $-1,096/yr
For passive investors: Depreciation is non-cash, so a rental often shows a tax loss while cash-flowing — sheltering income. Rental losses are passive: they offset passive income freely, and up to $25,000/yr can offset ordinary (W-2) income if you actively participate and your MAGI is under $100k (phasing out to $0 by $150k); unused losses carry forward. On sale, claimed depreciation is recaptured at up to 25%, and gains may owe capital-gains tax (a 1031 exchange can defer both). Figures are a year-1 estimate at your 24.0% rate — not tax advice; consult a CPA.
Schools (NCES district)
- District
- Reedsburg School District
- NCES district ID
- 5512660
- Math proficiency
- 31% ▼ -8.00%
- Reading proficiency
- 36% ▼ -3.00%
- Median HH income
- $52,578
- Composite
- 29.34/100
- National rank
- #6544
- State rank
- #242 of 342 in WI
Livability — Reedsburg
- Score
- 74/100
- State rank
- #187
- US rank
- #4937
Category grades
Schools grade is shown separately in the Schools card above.
Census & demographics
- Census place
- Reedsburg, WI
- County
- Sauk County · 36,155 people
- City population
- 14,451
- Metro
- Baraboo, WI
- Population (ZIP)
- 14,451
- Household income
- $77,924
- Rent vs Own
- Severe rent burden
- 294.0
Population outlook (Sauk County) Hauer SSP2
- Today (2025)
- 66,065 people
- By 2030
- 66,755 · +1.0%
- By 2040
- 66,999 · +1.4%
- By 2050
- 65,499 · -0.9%
- By 2075
- 60,000 · -9.2%
- By 2100
- 51,070 · -22.7%
Race, ethnicity, and origin ACS 2023
- Neighborhood character
- Predominantly White (82%)
- Race & ethnicity
- White 82% Hispanic / Latino 10% Two or more races 8%
- Hispanic origin (detail)
- Mexican 6% Puerto Rican 1%
- Common ancestry
- Portuguese 5% Romanian 4% Lithuanian 3%
- Foreign-born
- 4% · Canada
- Languages at home
- 93% English-only · Spanish 6%
Political lean MEDSL · Sauk
- 2024 margin
- Toss-up / Even · D 48.4% · R 50.0% · Other 1.6%
- 2008→2024 swing
- -23.2pp toward R · 2008: 21.6pp · 2024: -1.7pp
- All cycles
- 2024: R+1.7 2020: D+1.7 2016: R+0.3 2012: D+18.5 2008: D+21.6
Not yet ingested
- Civics
- —
Market trends
- HPI YoY
- ▼ -122.25%
- Current HPI
- 229.9937
- Rent YoY
- —
- Metro
- Baraboo, WI
- State GDP YoY
- ▲ 2.10%
- F500 in state
- 20
Industry mix (Fortune 500 HQ in WI)
| Industry | F500 HQs | Revenue |
|---|---|---|
| Industrial Machinery | 4 | $23B |
|
||
| Industrial Technology | 2 | $36B |
|
||
| Insurance | 1 | $36B |
|
||
| Professional Services | 1 | $19B |
|
||
| Utilities | 1 | $9B |
|
||
| Consumer Goods | 1 | $3B |
|
||
Price history
1 event — show timeline
- 2026-04-22 Listed $50,000 SCWMLS
Property tax history
+1.8%/yrLatest (2025): $2,402 · +11.3% YoY. Source: county tax records.
Cash-flow waterfall
monthlySold comps — $/sqft
last 12 mo · ≤1 miLoading sold comps…