1701 2nd Ave N · Pell City, AL
Flood risk 1/10 · Minimal
- FEMA flood zone
- X (unshaded)
- Chance of flooding over 30 yrs
- 0.0%
- Est. flood insurance / yr
- $507 – $1,088
Fire risk 5/10 · Moderate
- Est. fire insurance / yr
- $916 – $1,700
Heat risk 6/10 · Moderate
- Hot days now (above 107°F)
- 7 days/yr
- Hot days in 30 yrs
- 21 days/yr
Wind risk 6/10 · Moderate
- Chance of severe wind over 30 yrs
- 27.0%
Air-quality risk 3/10 · Minor
- Unhealthy air days now
- 1 days/yr
- Unhealthy air days in 30 yrs
- 4 days/yr
Risk factors via First Street. Map © Google.
Why this score? — see what drove the D grade
The composite is a weighted blend of 9 inputs, each scored 0–100. Each bar is that input's sub-score; the figure is the points it added to the 100-point composite (weight × sub-score).
- Cash flow +16.7/30.0
- DSCR +5.2/10.0
- ARV discount +4.3/15.0
- Livability +3.5/5.0
- 1% rule +3.2/10.0
- Schools +2.6/10.0
- Rent growth +2.5/5.0
- Condition / age +2.5/5.0
- Appreciation +0.0/10.0
$165,000
🖨 Deal sheet (PDF) 📄 Offer letter ✓ Due diligence
Listing remarks MLS
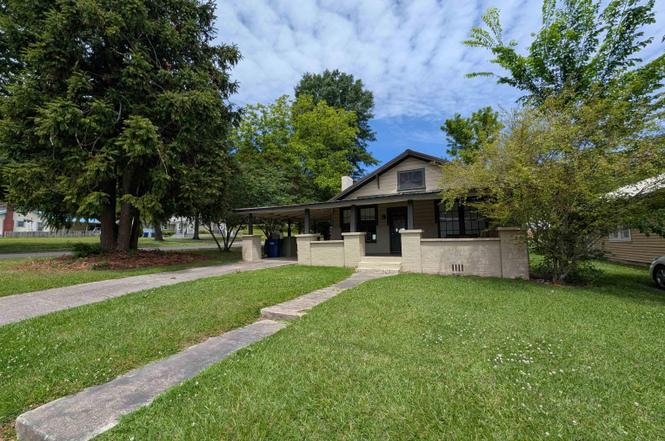
Located in downtown Pell City. This home is close to everything Pell City has to offer. Situated on a corner lot within a block of the municipal buildings. Come put your special touch on this home. Home features some hardwood floors and has a large front porch that will be perfect for that first cup of coffee in the mornings.
Key facts
- Spacious side porch
- Storage building
- Central location
Tags
Property features AI
Finance
- Financial info: Garbage fee $45 monthly; Has down payment assistance
- HOA & community: Fire fee included; Library fee included; Monthly garbage fee
Exterior
- Parking: Main level parking; One carport space
- Utilities: Public water; Connected sewer; Electric water heater; Underground utilities; Internet service available
- Home design: Single-story layout (all listed rooms on main level); Existing construction; Facing direction not specified
- Construction: Hardiplank siding; Crawl space foundation
- Exterior features: Storage building; No pool; No patio; No deck; No garden/patio space indicated; Not waterfront
Interior
- Kitchen: Laminate countertops; Built-in dishwasher; Electric stove; Refrigerator
- Bedrooms: Master bedroom on main level; Additional bedrooms on main level; Walk-in closets
- Flooring: Vinyl flooring
- Bathrooms: Two full bathrooms; Separate shower in at least one bathroom; Tub/shower combo in at least one bathroom
- Heating & cooling: Central heating; Central air conditioning
- Interior features: Smooth ceilings; No additional interior features listed
- Laundry & utility: Laundry on main level; Washer hookup; Electric dryer hookup; Laundry located in a closet
Neighborhood map
What this means for you Summary
Snapshot
- This is a 3-bed/2.0-bath single-family listed at $165k.
Deal economics
- At list price, monthly cash flow is $104 ($1k/yr) — positive.
- The deal already cash-flows at list — no discount required.
- To meet the 1% rule (rent ≥ 1% of price), the offer needs to be $135k (17.9% below list).
- Recommended offer: $135k (17.9% below list) — sets the bar for 1% rule.
- Cap rate 7.0% vs local median 2.5% in Pell City — top-decile yield for the area; either an underpriced asset or a hidden risk that comps aren't pricing in. Stress-test before assuming the spread holds.
Location & tenants
- Location reads 69/100 on livability (#50 in AL) — a middle-class / working-renter tenant base. Strengths: cost of living A+, housing A+, health & safety A+; Watch: crime C-, employment D+, amenities F.
- Pell City (town): math 17% / reading 44% proficiency, ranked #67 of 129 in AL (top 52%) — families likely to look elsewhere, expect single-tenant / working-renter base with shorter leases.
- Zoned schools: Iola Roberts Elementary School (math 17% / reading 47%, grade F, #331 of 627 statewide, top 57%, 388 students, 78% FRL); Williams Intermediate School (math 18% / reading 42%, grade F, #121 of 257 statewide, top 50%, 632 students, 66% FRL); Pell City High School (math 17% / reading 21%, grade F, #181 of 305 statewide, top 60%, 1,171 students, 55% FRL) — zoned schools average 67% FRL vs 47% district-wide (19 pts higher); higher-poverty schools than district average — tighter screening recommended.
- Market conditions: 65 active listings in the ZIP; 9 comparable units currently listed for rent nearby; rentals leasing fast (median 14d on market — plan ~1-2 weeks tenant-placement turnaround); 557 units permitted in St. Clair County in 2024 (0 in 5+ unit buildings).
Forward outlook
- Local home prices are declining (-3.0%/yr); year-one equity from $1k of loan paydown is wiped out by about $5k of value loss. Plan a longer hold.
- St. Clair County population projected at +11% by 2050 — modest demand growth; plan on rents tracking national, not racing it.
Negotiation context
- It's been on market 50 days — a 3% lower offer ($160k) is reasonable based on typical stale-listing flexibility.
- 2 sale attempts since 7y ago with the ask held roughly flat each time — persistent listings suggest the price (not the market) is what's stuck; bring a comps-based counter.
- Current owner paid $31k; list at $165k implies a 432% gain — meaningful room to come down on a strong offer.
Risks & watch-outs
- Watch-outs: built in 1945 — expect roof / HVAC / electrical / plumbing capex.
- Climate carrying-cost: major wind risk, 27% chance of damaging wind over 30y; moderate wildfire risk; extreme-heat days projected 7→21/yr by 2055 (HVAC capex compounding) — expect insurance premiums to compound above CPI over the hold.
Questions for the listing agent
- It's been on market 50 days. Have you received any prior offers? Is the seller open to a 18% concession, seller financing, or rate buy-down credit?
- Built in 1945 — when were the roof, HVAC, electrical panel, plumbing, and water heater last replaced?
- Is there a deadline driving the sale (1031 exchange, divorce, estate, relocation)? That informs how much negotiation room exists.
- The area grade is low — what's the realistic commute time and amenity access for the typical tenant pool here? Any planned neighborhood developments (good or bad) we should know about?
- What's the average days-on-market for RENTAL listings here right now (not sales)? A rising rental-DOM trend means longer vacancies and softer asking-rent achievability than the comps imply.
- What's the recent tenant-quality profile in this submarket — average credit score on applications, eviction rate, late-payment / NSF rate, and stable-employment percentage? A property-management company in the area should have these aggregated.
- How much new for-sale + rental construction is in the pipeline within 1–3 miles? Heavy new supply typically softens prices + rents 12–24 months out; constrained supply supports both.
Investment metrics
- 1% rule
- 0.82% ✗
- Cap rate
- 7.05%
- Cash-on-cash
- 2.69%
- DSCR
- 1.12
- GRM
- 10.2
CMA / ARV
- ARV (on-the-fly)
- $153,888
- Comps found
- 8
Show comp detail 8 sales within ~0.75 mi
| Address | Dist | Beds/Ba | Sqft | Sold | Price | $/sf | Match |
|---|---|---|---|---|---|---|---|
| 1918 3rd Ave S | 0.36mi | 3/2.0 | 1,453 (+6%) | 3mo | $194,900 | $134 | 71 |
| 119 17th St N | 0.04mi | 2/2.0 (-1) | 1,334 (-3%) | 23mo | $149,900 | $112 | 70 |
| 1808 2nd Ave N | 0.09mi | 3/2.0 | 1,524 (+11%) | 12mo | $253,500 | $166 | 67 |
| 1010 1st Pl S | 0.44mi | 3/2.0 | 1,254 (-9%) | 1mo | $195,600 | $156 | 64 |
| 110 21st St | 0.28mi | 3/2.0 | 1,437 (+5%) | 23mo | $115,000 | $80 | 60 |
| 504 N 26th St | 0.65mi | 3/2.0 | 1,501 (+9%) | 1mo | $149,900 | $100 | 54 |
| 2414 4th Ave N | 0.53mi | 2/1.0 (-1) | 1,252 (-9%) | 8mo | $69,000 | $55 | 45 |
| 407 26th St N | 0.57mi | 2/2.0 (-1) | 1,568 (+14%) | 23mo | $150,000 | $96 | 26 |
Match score weights: distance 35% · size 25% · config 20% · recency 20%. Top-matched comps best support the ARV.
Projected returns pro-forma
-3.0% appreciation · 3.0% rent growth · sell at horizon
- IRR
- -12.1%
- Equity multiple
- 0.56×
- Total profit
- $-20,231
- Equity at exit
- $24,602
- IRR
- -3.1%
- Equity multiple
- 0.79×
- Total profit
- $-9,480
- Equity at exit
- $14,266
Cash invested: $46,200 (down + closing). Projections, not guarantees.
Landlord ↔ Tenant lean methodology
- Overall (STATE)
- 90 Strongly Landlord-Friendly
- State Alabama
- 90 Strongly Landlord-Friendly · R+15
- County
- — inherits STATE
- City
- — inherits STATE
ZIP-level market 35125
- Home prices YoY
- -22.0%
- Active inventory
- 65
- Price-to-rent
- 10.2×
Monthly cashflow live
- Estimated rent
- $1,354 high interval (Pro) →
- Mortgage (P&I)
- −$865
- Tax from tax record
- −$32 /mo · $385/yr
- Insurance
- −$69
- HOA
- −$0
- Vacancy / Maint / Mgmt
- −$284
- Net cashflow
- $104
Break-even live
Sensitivity live
| Price | -10% $197 | -5% $150 | +0% $104 | +5% $57 | +10% $10 |
|---|---|---|---|---|---|
| Rent | -10% $-3 | -5% $50 | +0% $104 | +5% $157 | +10% $210 |
| Rate | -1.0pp $187 | -0.5pp $145 | base $104 | +0.5pp $61 | +1.0pp $17 |
UW: 25.0% down · 7.5% · 30yr · 1.5% tax · 5.0% vac · 8.0% maint · 8.0% mgmt
Financing live
Cash to close
- Down payment
- $41,250
- Closing costs
- $4,950
- Reserves months
- —
- Total cash needed
- —
Loan-product check · same deal, 3 products live
Conventional
25% down · 7.5% · 30yr
- Down + closing
- —
- Monthly P&I
- —
- Monthly cashflow
- —
- DSCR
- —
- Eligible?
- —
Personal DTI + credit; lowest rate.
DSCR
20% down · 8.5% · 30yr
- Down + closing
- —
- Monthly P&I
- —
- Monthly cashflow
- —
- DSCR
- —
- Eligible?
- —
No personal income docs; deal must DSCR.
Hard money
10% down · 12.0% · 12mo
- Down + closing
- —
- Monthly P&I
- —
- Monthly cashflow
- —
- DSCR
- —
- Eligible?
- —
Short-term bridge; refi at stabilization.
Rent comps 9 comps
| Address | Beds | Baths | Sqft | Rent | $/sqft | DOM | Units | Dist |
|---|---|---|---|---|---|---|---|---|
| 1919 2nd Ave N Pell City, AL | 2.0 | 1.5 | 1400 | $1,350 | $0.96 | 13d | 1 | 0.20mi |
| 1917 2nd Ave N Pell City, AL | 2.0 | 1.5 | 1400 | $1,350 | $0.96 | 13d | 1 | 0.20mi |
| 2000 3rd Ave S Pell City, AL | 2.0 | 1.0 | 1158 | $1,190 | $1.03 | 25d | 1 | 0.36mi |
| 713 21st St N Unit A Pell City, AL | 2.0 | 2.0 | 1200 | $985 | $0.82 | 4d | 1 | 0.65mi |
| 1103 23rd St N Pell City, AL | 1.0–3.0 | 1.0–3.0 | 990 | $1,445 | $1.46 | 3d | 11 | 0.91mi |
| 281 Woodland Trl Pell City, AL | 4.0 | 2.0 | 1494 | $1,749 | $1.17 | 21d | 1 | 0.94mi |
| 570 Woodland Crest Rd Pell City, AL | 3.0 | 2.0 | 1200 | $1,566 | $1.30 | 21d | 1 | 0.98mi |
| 311 7th Ct N Pell City, AL | 2.0 | 2.0 | 960 | $1,155 | $1.20 | 25d | 1 | 1.04mi |
| 490 Woodland Crest Rd Pell City, AL | 4.0 | 2.0 | 1661 | $1,870 | $1.13 | 13d | 1 | 1.06mi |
Listing history 21 events
-
2026-06-22remarks 659-char remark
-
2026-06-22statusdays on market $165,000 Active 50 DOM
-
2026-06-18days on market $165,000 Contingent 47 DOM
-
2026-06-17days on market $165,000 Contingent 46 DOM
-
2026-06-16days on market $165,000 Contingent 45 DOM
-
2026-06-15days on market $165,000 Contingent 44 DOM
-
2026-06-13days on market $165,000 Contingent 42 DOM
-
2026-06-10days on market $165,000 Contingent 39 DOM
-
2026-06-09days on market $165,000 Contingent 38 DOM
-
2026-06-08days on market $165,000 Contingent 37 DOM
-
2026-06-07days on market $165,000 Contingent 36 DOM
-
2026-06-05days on market $165,000 Contingent 33 DOM
-
2026-06-03days on market $165,000 Contingent 32 DOM
-
2026-06-02days on market $165,000 Contingent 31 DOM
-
2026-06-01days on market $165,000 Contingent 30 DOM
-
2026-05-31days on market $165,000 Contingent 29 DOM
-
2026-05-13historical Contingent
-
2026-05-02$165,000 Active
-
2019-05-22soldstatus $31,000 Sold 327-char remark
Show marketing remark (327 chars)
Located in downtown Pell City. This home is close to everything Pell City has to offer. Situated on a corner lot within a block of the municipal buildings. Come put your special touch on this home. Home features some hardwood floors and has a large front porch that will be perfect for that first cup of coffee in the mornings.
-
2019-04-27historical 327-char remark
Show marketing remark (327 chars)
Located in downtown Pell City. This home is close to everything Pell City has to offer. Situated on a corner lot within a block of the municipal buildings. Come put your special touch on this home. Home features some hardwood floors and has a large front porch that will be perfect for that first cup of coffee in the mornings.
-
2019-04-22$31,000 Active 327-char remark
Show marketing remark (327 chars)
Located in downtown Pell City. This home is close to everything Pell City has to offer. Situated on a corner lot within a block of the municipal buildings. Come put your special touch on this home. Home features some hardwood floors and has a large front porch that will be perfect for that first cup of coffee in the mornings.
ⓘ Source: listings_history table (triggers on properties + properties_extension) + one-shot
backfill from property_details.listing_events for pre-trigger history.
Tax reassessment forecast AL · Resets to sale price
- Current annual tax
- $385 · $32/mo
- Projected year-2 tax
- $677 · $56/mo
- Expected delta
- +$292/yr (+$24/mo · 75.9%)
ⓘ Screening estimate from a state-policy table — verify with the county assessor before closing.
Climate risk First Street
- Flood 1/10 Low FEMA zone X (unshaded) · 0% chance over 30 yrs
- Wildfire 5/10 Major
- Heat 6/10 Major 7 d/yr ≥107°F today · 21 d/yr by 30 yrs out
- Wind 6/10 Major 27% chance of damaging wind over 30 yrs
- Air quality 3/10 Moderate 1 unhealthy d/yr today · 4 by 30 yrs out
Nearby sold comps map
Loading sold comps map…
Walkable amenities ~0.75 mi
Loading nearby amenities…
Taxation est. · year 1
- Rental income
- $16,247
- − Mortgage interest
- −$9,243
- − Property taxes
- −$385
- − Insurance
- −$825
- − Repairs & maintenance
- −$1,300
- − Management
- −$1,300
- − Depreciation
- −$4,800
- Taxable loss
- −$1,605
- Est. tax savings @ 24.0%
- +$385
- After-tax cash flow
- $1,627/yr
For passive investors: Depreciation is non-cash, so a rental often shows a tax loss while cash-flowing — sheltering income. Rental losses are passive: they offset passive income freely, and up to $25,000/yr can offset ordinary (W-2) income if you actively participate and your MAGI is under $100k (phasing out to $0 by $150k); unused losses carry forward. On sale, claimed depreciation is recaptured at up to 25%, and gains may owe capital-gains tax (a 1031 exchange can defer both). Figures are a year-1 estimate at your 24.0% rate — not tax advice; consult a CPA.
Schools (NCES district)
- District
- Pell City
- NCES district ID
- 0102650
- Math proficiency
- 17% ▼ -30.00%
- Reading proficiency
- 44% ▼ -4.00%
- Median HH income
- $45,051
- Composite
- 26.04/100
- National rank
- #7303
- State rank
- #67 of 129 in AL
Livability — Pell City
- Score
- 69/100
- State rank
- #50
- US rank
- #8246
Category grades
Schools grade is shown separately in the Schools card above.
Census & demographics
- Census place
- Pell City, AL
- City population
- 10,546
- Population (ZIP)
- 10,969
Population outlook (St. Clair County) Hauer SSP2
- Today (2025)
- 94,158 people
- By 2030
- 97,008 · +3.0%
- By 2040
- 101,615 · +7.9%
- By 2050
- 104,537 · +11.0%
- By 2075
- 109,350 · +16.1%
- By 2100
- 106,785 · +13.4%
Race, ethnicity, and origin ACS 2023
- Neighborhood character
- Predominantly White (82%)
- Race & ethnicity
- White 82% Black 9% Two or more races 5% Hispanic / Latino 3% Pacific Islander 1% Asian 1%
- Common ancestry
- Serbian 1% Italian 1% Slovak 1%
- Foreign-born
- 3% · Canada
- Languages at home
- 96% English-only · Spanish 2%
Political lean MEDSL · St. Clair
- 2024 margin
- Solid R (+64.1) · D 17.6% · R 81.7%
- 2008→2024 swing
- -0.9pp no change · 2008: -63.2pp · 2024: -64.1pp
- All cycles
- 2024: R+64.1 2020: R+64.0 2016: R+68.6 2012: R+66.1 2008: R+63.2
Not yet ingested
- Civics
- —
Market trends
- HPI YoY
- ▼ -51.53%
- Current HPI
- 182.9461
- Rent YoY
- —
- Metro
- —
- State GDP YoY
- ▲ 2.94%
- F500 in state
- 4
Industry mix (Fortune 500 HQ in AL)
| Industry | F500 HQs | Revenue |
|---|---|---|
| Financial Services | 1 | $8B |
|
||
| Healthcare | 1 | $5B |
|
||
Price history
+432.3% since first listed5 events — show timeline
- 2026-05-13 Contingent — Greater Alabama MLS
- 2026-05-02 Listed $165,000 Greater Alabama MLS
- 2019-05-22 Sold (MLS) $31,000 Greater Alabama MLS
- 2019-04-27 Delisted — Greater Alabama MLS
- 2019-04-22 Listed $31,000 Greater Alabama MLS
Property tax history
+5.8%/yrLatest (2025): $385 · +0.0% YoY. Source: county tax records.
Cash-flow waterfall
monthlySold comps — $/sqft
last 12 mo · ≤1 miLoading sold comps…