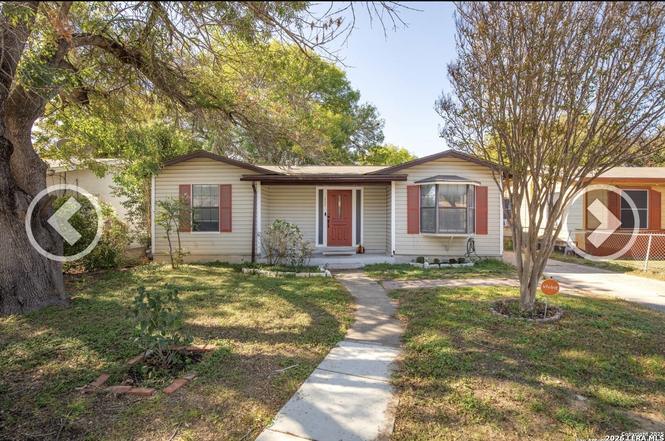
1923 Dahlgreen · San Antonio, TX
Flood risk 1/10 · Minimal
- FEMA flood zone
- X (unshaded)
- Chance of flooding over 30 yrs
- 0.0%
- Est. flood insurance / yr
- $507 – $1,088
Fire risk 1/10 · Minimal
- Est. fire insurance / yr
- $1,222 – $2,270
Heat risk 8/10 · Major
- Hot days now (above 108°F)
- 7 days/yr
- Hot days in 30 yrs
- 22 days/yr
Wind risk 7/10 · Major
- Chance of severe wind over 30 yrs
- 78.0%
Air-quality risk 2/10 · Minimal
- Unhealthy air days now
- 1 days/yr
- Unhealthy air days in 30 yrs
- 1 days/yr
Risk factors via First Street. Map © Google.
Why this score? — see what drove the D+ grade
The composite is a weighted blend of 9 inputs, each scored 0–100. Each bar is that input's sub-score; the figure is the points it added to the 100-point composite (weight × sub-score).
- Cash flow +11.8/30.0
- Appreciation +10.0/10.0
- ARV discount +7.5/15.0
- 1% rule +4.7/10.0
- Rent growth +4.0/5.0
- Livability +4.0/5.0
- DSCR +3.5/10.0
- Condition / age +2.5/5.0
- Schools +1.3/10.0
$135,000
🖨 Deal sheet 📄 Offer letter ✓ Due diligence
Listing remarks MLS
This 2-bedroom, 2-bathroom home, with a bonus room, presents a fantastic opportunity for investors, cash buyers, or those looking to put their personal touch on a property. Priced to reflect the TLC needed, this home is being sold as is-perfect for anyone ready to restore it to its full potential! The spacious layout offers a cozy living area, two well-sized bedrooms, and a bonus room that could be used as an office. Owners began renovating transforming one of the bathrooms into a spa-like retreat. This property is a diamond in the rough, awaiting someone to unlock its true value! Don't miss out-schedule a showing today and see the potential this home offers in this established Neighborhood in San Antonio!
Key facts
- 6,621 sq ft lot
- Garage
- Built 1964
Property features AI
Finance
- Other: Possession at closing/funding; For sale by eXp Realty
- Financial info: Currently being leased (lease expires April 12, 2026); Down payment assistance resource available
- HOA & community: Subdivision: Gardendale Area 8 Ed
Exterior
- Parking: Side entry parking
- Utilities: City water and sewer
- Home design: Pre-owned property; Approximate age: 62 years
- Construction: Wood shingle/shake roof; Other roof type (see remarks)
- Exterior features: Aluminum exterior
Interior
- Kitchen: Built-in oven; Stove/Range; Refrigerator; Kitchen (12 x 16); Breakfast bar
- Bedrooms: Master bedroom on lower level (12 x 12); Bedroom 2 (12 x 16); Bedroom 3 (12 x 13); All bedrooms downstairs
- Flooring: Carpeting; Linoleum flooring
- Bathrooms: 2 full bathrooms; Master bath with tub/shower combination (6 x 8)
- Heating & cooling: Central heating (natural gas); Central air conditioning
- Interior features: Ceiling fans; Central vacuum; Open floor plan; Breakfast bar; Some window coverings remain; City garbage service
- Laundry & utility: Washer connection; Dryer connection; Laundry on main level
Neighborhood map
What this means for you Summary
Snapshot
- This is a 2-bed/2.0-bath single-family listed at $135k.
Deal economics
- At list price, monthly cash flow is $-38 ($-458/yr) — negative.
- To cash-flow at today's rent, offer at most $128k (5.0% below list).
- To meet the 1% rule (rent ≥ 1% of price), the offer needs to be $131k (3.3% below list).
- Recommended offer: $119k (12.0% below list) — sets the bar for market timing.
- Cap rate 6.0% vs local median 3.8% in San Antonio — top-decile yield for the area; either an underpriced asset or a hidden risk that comps aren't pricing in. Stress-test before assuming the spread holds.
Location & tenants
- Location reads 80/100 on livability (#31 in TX, #1,616 nationally) — a professional / high-income tenant draw. Strengths: amenities A+, commute A+, cost of living A+; Watch: schools C-, crime F.
- Edgewood ISD (urban): math 12% / reading 21% proficiency, ranked #812 of 826 in TX (top 98%) — low school quality limits family demand, transient renter base, plan for 1-2y turnover.
- Market conditions: Rents rising fast (+6.1%/yr); 127 active listings in the ZIP; lower-income renter base — watch delinquency; 8,308 units permitted in Bexar County in 2024 (2,506 in 5+ unit buildings).
- This rent runs 37% of the median local income ($43k/yr) — at the standard rent-burdened threshold; future hikes will face affordability resistance.
Forward outlook
- In year one you build about $14k of equity ($933 loan paydown + $14k appreciation (10.0% local appreciation)).
- Bexar County population projected at +50% by 2050 — long-run rental-demand tailwind backs the buy-and-hold thesis.
- At projected returns (10.0% appreciation + 6.1% rent growth), your $38k cash investment doubles in ~3 years — after that, you're playing with house money.
- By year 3, paydown + projected appreciation supports a ~$37k cash-out refi (75% LTV) — recoverable capital for the next deal without selling this one.
Negotiation context
- It's been on market 132 days — a 12% lower offer ($119k) is reasonable based on typical stale-listing flexibility.
- 6 sale attempts since 8y ago; this cycle's ask has dropped $40k (23%) from the opening price — seller is motivated, your offer sets the floor, not the list.
Risks & watch-outs
- Watch-outs: property tax is 2.7% of price.
- Climate carrying-cost: major wind risk, 78% chance of damaging wind over 30y; extreme-heat days projected 7→22/yr by 2055 (HVAC capex compounding) — expect insurance premiums to compound above CPI over the hold.
Questions for the listing agent
- What do current leases actually rent for vs. the listed asking? Can we see a recent rent roll and the last 12 months of T-12 income?
- It's been on market 132 days. Have you received any prior offers? Is the seller open to a 12% concession, seller financing, or rate buy-down credit?
- Built in 1964 — when were the roof, HVAC, electrical panel, plumbing, and water heater last replaced?
- Property tax is high relative to price — has the assessment been appealed recently, and will the sale trigger a re-assessment?
- Why hasn't it sold? Are there any deal-killer items the seller is aware of (foundation, flood, title, zoning, code violations)?
- Is there a deadline driving the sale (1031 exchange, divorce, estate, relocation)? That informs how much negotiation room exists.
- Crime grade is F in this area — have there been break-ins, vandalism, or insurance claims at this property in the last 3 years? What carrier currently insures it and at what premium?
- The area grade is low — what's the realistic commute time and amenity access for the typical tenant pool here? Any planned neighborhood developments (good or bad) we should know about?
- What's the average days-on-market for RENTAL listings here right now (not sales)? A rising rental-DOM trend means longer vacancies and softer asking-rent achievability than the comps imply.
- What's the recent tenant-quality profile in this submarket — average credit score on applications, eviction rate, late-payment / NSF rate, and stable-employment percentage? A property-management company in the area should have these aggregated.
- How much new for-sale + rental construction is in the pipeline within 1–3 miles? Heavy new supply typically softens prices + rents 12–24 months out; constrained supply supports both.
Investment metrics
- 1% rule
- 0.97% ✗
- Cap rate
- 5.95%
- Cash-on-cash
- -1.21%
- DSCR
- 0.95
- GRM
- 8.6
CMA / ARV
No comps found within radius.
Projected returns pro-forma
10.0% appreciation · 6.13% rent growth · sell at horizon
- IRR
- 24.6%
- Equity multiple
- 3.00×
- Total profit
- $75,438
- Equity at exit
- $121,619
- IRR
- 22.7%
- Equity multiple
- 7.19×
- Total profit
- $234,037
- Equity at exit
- $262,275
Cash invested: $37,800 (down + closing). Projections, not guarantees.
Landlord ↔ Tenant lean methodology
- Overall (STATE)
- 87 Strongly Landlord-Friendly
- State Texas
- 87 Strongly Landlord-Friendly · R+5
- County
- — inherits STATE
- City
- — inherits STATE
ZIP-level market 78237
- Home prices YoY
- 14.1%
- Rents YoY
- 6.1%
- Active inventory
- 127
- Price-to-rent
- 8.6×
Monthly cashflow live
- Estimated rent
- $1,306 medium interval (Pro) →
- Mortgage (P&I)
- −$708
- Tax from tax record
- −$306 /mo · $3,669/yr
- Insurance
- −$56
- HOA
- −$0
- Vacancy / Maint / Mgmt
- −$274
- Net cashflow
- $-38
Break-even live
UW: 25.0% down · 7.5% · 30yr · 1.5% tax · 5.0% vac · 8.0% maint · 8.0% mgmt
Financing live
Cash to close
- Down payment
- $33,750
- Closing costs
- $4,050
- Reserves months
- —
- Total cash needed
- —
Loan-product check · same deal, 3 products live
Conventional
25% down · 7.5% · 30yr
- Down + closing
- —
- Monthly P&I
- —
- Monthly cashflow
- —
- DSCR
- —
- Eligible?
- —
Personal DTI + credit; lowest rate.
DSCR
20% down · 8.5% · 30yr
- Down + closing
- —
- Monthly P&I
- —
- Monthly cashflow
- —
- DSCR
- —
- Eligible?
- —
No personal income docs; deal must DSCR.
Hard money
10% down · 12.0% · 12mo
- Down + closing
- —
- Monthly P&I
- —
- Monthly cashflow
- —
- DSCR
- —
- Eligible?
- —
Short-term bridge; refi at stabilization.
Listing history 15 events
-
2026-06-18days on market $135,000 Active 132 DOM
-
2026-06-17days on market $135,000 Active 131 DOM
-
2026-06-16days on market $135,000 Active 130 DOM
-
2026-06-15days on market $135,000 Active 129 DOM
-
2026-06-13days on market $135,000 Active 127 DOM
-
2026-06-12days on market $135,000 Active 126 DOM
-
2026-06-09days on market $135,000 Active 123 DOM
-
2026-06-08days on market $135,000 Active 122 DOM
-
2026-06-08days on market $135,000 Active 121 DOM
-
2026-06-07days on market $135,000 Active 120 DOM
-
2026-06-03days on market $135,000 Active 117 DOM
-
2026-06-02days on market $135,000 Active 116 DOM
-
2026-06-01days on market $135,000 Active 115 DOM
-
2026-05-31remarks 610-char remark
-
2026-05-31$135,000 Active 114 DOM
ⓘ Source: listings_history table (triggers on properties + properties_extension) + one-shot
backfill from property_details.listing_events for pre-trigger history.
Tax reassessment forecast TX · Resets to sale price
- Current annual tax
- $3,669 · $306/mo
- Projected year-2 tax
- $3,669 · $306/mo
- Expected delta
- $0/yr ($0/mo · 0.0%)
ⓘ Screening estimate from a state-policy table — verify with the county assessor before closing.
Climate risk First Street
- Flood 1/10 Low FEMA zone X (unshaded) · 0% chance over 30 yrs
- Wildfire 1/10 Low
- Heat 8/10 Severe 7 d/yr ≥108°F today · 22 d/yr by 30 yrs out
- Wind 7/10 Severe 78% chance of damaging wind over 30 yrs
- Air quality 2/10 Low 1 unhealthy d/yr today · 1 by 30 yrs out
Nearby sold comps map
Loading sold comps map…
Walkable amenities ~0.75 mi
Loading nearby amenities…
Taxation est. · year 1
- Rental income
- $15,672
- − Mortgage interest
- −$7,562
- − Property taxes
- −$3,669
- − Insurance
- −$675
- − Repairs & maintenance
- −$1,254
- − Management
- −$1,254
- − Depreciation
- −$3,927
- Taxable loss
- −$2,669
- Est. tax savings @ 24.0%
- +$640
- After-tax cash flow
- $182/yr
For passive investors: Depreciation is non-cash, so a rental often shows a tax loss while cash-flowing — sheltering income. Rental losses are passive: they offset passive income freely, and up to $25,000/yr can offset ordinary (W-2) income if you actively participate and your MAGI is under $100k (phasing out to $0 by $150k); unused losses carry forward. On sale, claimed depreciation is recaptured at up to 25%, and gains may owe capital-gains tax (a 1031 exchange can defer both). Figures are a year-1 estimate at your 24.0% rate — not tax advice; consult a CPA.
Schools (NCES district)
- District
- Edgewood ISD
- NCES district ID
- 4818150
- Math proficiency
- 12% ▼ -18.00%
- Reading proficiency
- 21% ▼ -5.00%
- Median HH income
- $27,419
- Composite
- 12.82/100
- National rank
- #9597
- State rank
- #812 of 826 in TX
Livability — San Antonio
- Score
- 80/100
- State rank
- #31
- US rank
- #1616
Category grades
Schools grade is shown separately in the Schools card above.
Census & demographics
- Census place
- San Antonio, TX
- County
- Bexar County · 1,990,555 people
- City population
- 1,806,925
- Metro
- San Antonio-New Braunfels, TX
- Population (ZIP)
- 37,379
- Household income
- $42,772
- Rent vs Own
- Severe rent burden
- 1185.0
Population outlook (Bexar County) Hauer SSP2
- Today (2025)
- 2,336,851 people
- By 2030
- 2,560,728 · +9.6%
- By 2040
- 3,020,569 · +29.3%
- By 2050
- 3,493,522 · +49.5%
- By 2075
- 4,668,459 · +99.8%
- By 2100
- 5,533,242 · +136.8%
Race, ethnicity, and origin ACS 2023
- Neighborhood character
- Predominantly Hispanic (95%)
- Race & ethnicity
- Hispanic / Latino 95% Two or more races 50% White 3% Native American 2% Black 2%
- Hispanic origin (detail)
- Mexican 84%
- Foreign-born
- 18% · Canada
- Languages at home
- 34% English-only · Spanish 66%
Political lean MEDSL · Bexar
- 2024 margin
- Lean D (+9.8) · D 54.3% · R 44.6% · Other 1.1%
- 2008→2024 swing
- +4.2pp toward D · 2008: 5.6pp · 2024: 9.8pp
- All cycles
- 2024: D+9.8 2020: D+18.2 2016: D+13.5 2012: D+4.6 2008: D+5.6
Not yet ingested
- Civics
- —
Market trends
- HPI YoY
- ▲ 30.52%
- Current HPI
- 247.7257
- Rent YoY
- ▲ 6.13%
- Metro
- San Antonio-New Braunfels, TX
- State GDP YoY
- ▲ 3.95%
- F500 in state
- 110
Industry mix (Fortune 500 HQ in TX)
| Industry | F500 HQs | Revenue |
|---|---|---|
| Energy | 16 | $1,198B |
|
||
| Technology | 5 | $198B |
|
||
| Engineering / Construction | 4 | $72B |
|
||
| Energy Services | 3 | $60B |
|
||
| Utilities | 3 | $41B |
|
||
| Healthcare | 2 | $330B |
|
||
Price history
+25.3% since first listed23 events — show timeline
- 2026-03-22 Price Changed $135,000 LERA
- 2026-03-05 Price Changed $150,000 LERA
- 2026-02-06 Listed $175,000 LERA
- 2025-03-05 Sold (Public Records) — Public Records
- 2025-02-28 Sold (MLS) — LERA
- 2025-02-19 Pending — LERA
- 2025-02-18 Relisted — LERA
- 2025-02-11 Pending — LERA
- 2025-02-07 Listed $115,000 LERA
- 2025-01-27 Listing Removed — LERA
- 2025-01-26 Listed $115,000 LERA
- 2024-12-14 Pending — LERA
- 2024-12-14 Listing Removed — LERA
- 2024-12-04 Price Changed $150,000 LERA
- 2024-11-30 Price Changed $170,000 LERA
- 2024-11-18 Listed $174,999 LERA
- 2019-01-29 Sold (Public Records) — Public Records
- 2019-01-28 Sold (MLS) — LERA
- 2019-01-11 Pending — LERA
- 2018-12-24 Contingent — LERA
- 2018-12-19 Listed $107,750 LERA
- 2005-09-16 Sold (Public Records) — Public Records
- 1980-02-01 Sold (Public Records) — Public Records
Property tax history
+6.6%/yrLatest (2025): $3,669 · -8.2% YoY. Source: county tax records.
Cash-flow waterfall
monthlySold comps — $/sqft
last 12 mo · ≤1 miLoading sold comps…