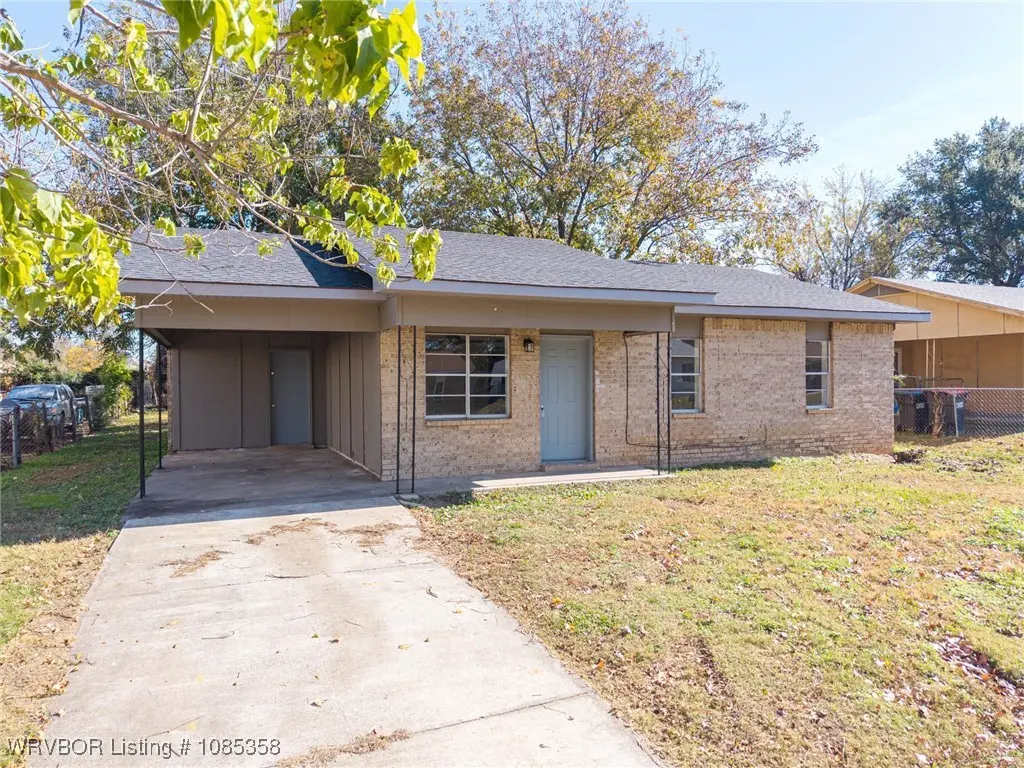
321 43rd St · Van Buren, AR
Flood risk 1/10 · Minimal
- FEMA flood zone
- X (unshaded)
- Chance of flooding over 30 yrs
- 0.0%
- Est. flood insurance / yr
- $507 – $1,088
Fire risk 7/10 · Major
- Est. fire insurance / yr
- $1,499 – $2,785
Heat risk 7/10 · Major
- Hot days now (above 111°F)
- 7 days/yr
- Hot days in 30 yrs
- 20 days/yr
Wind risk 2/10 · Minimal
- Chance of severe wind over 30 yrs
- 2.0%
Air-quality risk 2/10 · Minimal
- Unhealthy air days now
- 0 days/yr
- Unhealthy air days in 30 yrs
- 1 days/yr
Risk factors via First Street. Map © Google.
Why this score? — see what drove the D grade
The composite is a weighted blend of 9 inputs, each scored 0–100. Each bar is that input's sub-score; the figure is the points it added to the 100-point composite (weight × sub-score).
- Cash flow +12.0/30.0
- ARV discount +10.7/15.0
- Rent growth +3.7/5.0
- DSCR +3.6/10.0
- Livability +3.5/5.0
- Schools +3.4/10.0
- 1% rule +2.7/10.0
- Condition / age +2.5/5.0
- Appreciation +0.0/10.0
$140,000
🖨 Deal sheet (PDF) 📄 Offer letter ✓ Due diligence
Listing remarks MLS
Move-in ready 3 bedroom, 1.5 bath home! Fresh paint and updated light fixtures throughout give this home a clean, updated feel from the moment you walk in. The layout is comfortable and functional, offering plenty of space for everyday living. This home is eligible for zero-down loans, making it an excellent opportunity for first-time buyers or anyone looking for an affordable, turnkey option.
Key facts
- 8,712 sq ft lot
- Garage
- Built 1975
Neighborhood map
What this means for you Summary
Snapshot
- This is a 3-bed/1.5-bath single-family listed at $140k.
Deal economics
- At list price, monthly cash flow is $-32 ($-388/yr) — negative.
- To cash-flow at today's rent, offer at most $134k (4.1% below list).
- To meet the 1% rule (rent ≥ 1% of price), the offer needs to be $108k (22.8% below list).
- Recommended offer: $108k (22.8% below list) — sets the bar for 1% rule.
- Cap rate 6.0% vs local median 3.8% in Van Buren — top-decile yield for the area; either an underpriced asset or a hidden risk that comps aren't pricing in. Stress-test before assuming the spread holds.
Location & tenants
- Location reads 69/100 on livability (#75 in AR) — a middle-class / working-renter tenant base. Strengths: cost of living A+, housing A+, health & safety A; Watch: employment D, crime D-, amenities F.
- Van Buren School District (suburban): math 41% / reading 41% proficiency, ranked #62 of 238 in AR (top 26%) — families likely to look elsewhere, expect single-tenant / working-renter base with shorter leases.
- Zoned schools: James R. Tate Elem. School (math 32% / reading 27%, grade F, #305 of 454 statewide, top 71%, 457 students, 71% FRL); Butterfield Junior High School (math 38% / reading 32%, grade F, #122 of 201 statewide, top 61%, 613 students, 73% FRL); Van Buren High School (math 25% / reading 44%, grade F, #92 of 292 statewide, top 37%, 1,228 students, 48% FRL).
- Market conditions: Rents rising fast (+4.8%/yr); 249 active listings in the ZIP; 7 comparable units currently listed for rent nearby; rentals at typical pace (median 15d on market — plan ~3-4 weeks tenant-placement turnaround); 47 units permitted in Crawford County in 2024 (0 in 5+ unit buildings).
Forward outlook
- Local home prices are declining (-3.0%/yr); year-one equity from $968 of loan paydown is wiped out by about $4k of value loss. Plan a longer hold.
- Crawford County population projected to shrink 7% by 2050 — rents likely to lag national; underwrite the cash flow, not the appreciation.
Negotiation context
- It's been on market 177 days — a 12% lower offer ($123k) is reasonable based on typical stale-listing flexibility.
- Current owner paid $70k; list at $140k implies a 100% gain — meaningful room to come down on a strong offer.
Risks & watch-outs
- Climate carrying-cost: major wildfire risk; extreme-heat days projected 7→20/yr by 2055 (HVAC capex compounding) — expect insurance premiums to compound above CPI over the hold.
Questions for the listing agent
- What do current leases actually rent for vs. the listed asking? Can we see a recent rent roll and the last 12 months of T-12 income?
- It's been on market 177 days. Have you received any prior offers? Is the seller open to a 23% concession, seller financing, or rate buy-down credit?
- Built in 1975 — when were the roof, HVAC, electrical panel, plumbing, and water heater last replaced?
- Why hasn't it sold? Are there any deal-killer items the seller is aware of (foundation, flood, title, zoning, code violations)?
- Is there a deadline driving the sale (1031 exchange, divorce, estate, relocation)? That informs how much negotiation room exists.
- Crime grade is D in this area — have there been break-ins, vandalism, or insurance claims at this property in the last 3 years? What carrier currently insures it and at what premium?
- The area grade is low — what's the realistic commute time and amenity access for the typical tenant pool here? Any planned neighborhood developments (good or bad) we should know about?
- What's the average days-on-market for RENTAL listings here right now (not sales)? A rising rental-DOM trend means longer vacancies and softer asking-rent achievability than the comps imply.
- What's the recent tenant-quality profile in this submarket — average credit score on applications, eviction rate, late-payment / NSF rate, and stable-employment percentage? A property-management company in the area should have these aggregated.
- How much new for-sale + rental construction is in the pipeline within 1–3 miles? Heavy new supply typically softens prices + rents 12–24 months out; constrained supply supports both.
Investment metrics
- 1% rule
- 0.77% ✗
- Cap rate
- 6.02%
- Cash-on-cash
- -0.99%
- DSCR
- 0.96
- GRM
- 10.8
CMA / ARV
- ARV (median comp)
- $150,745
- List price
- $140,000
- Delta
- -7.13%
- Verdict
- FAIR
- Comps
- 20 within 1.0 mi
Show comp detail 12 sales within ~0.75 mi
| Address | Dist | Beds/Ba | Sqft | Sold | Price | $/sf | Match |
|---|---|---|---|---|---|---|---|
| 121 S 39th St | 0.33mi | 3/1.5 | 1,161 (+1%) | 6mo | $64,440 | $56 | 78 |
| 2 S 45th St | 0.31mi | 3/1.5 | 1,134 (-1%) | 6mo | $171,000 | $151 | 78 |
| 3919 Wellington St | 0.38mi | 3/2.0 | 1,182 (+3%) | 2mo | $191,000 | $162 | 74 |
| 109 S 42nd St | 0.23mi | 3/1.5 | 1,052 (-8%) | 2mo | $148,500 | $141 | 73 |
| 3505 Cherry St | 0.60mi | 3/2.0 | 1,157 (+1%) | 1mo | $175,000 | $151 | 68 |
| 3908 Kingsberry Dr | 0.46mi | 3/2.0 | 1,244 (+8%) | 2mo | $209,000 | $168 | 62 |
| 106 35th St | 0.66mi | 3/1.5 | 1,161 (+1%) | 8mo | $115,000 | $99 | 61 |
| 105 S 42nd St | 0.25mi | 4/1.5 (+1) | 1,300 (+13%) | 2mo | $169,900 | $131 | 60 |
| 901 S 38th St | 0.71mi | 3/2.0 | 1,168 (+2%) | 8mo | $176,000 | $151 | 56 |
| 3716 Wellington Ct | 0.54mi | 3/2.0 | 1,273 (+11%) | 6mo | $205,000 | $161 | 50 |
| 3906 Vinsett Ln | 0.61mi | 3/2.0 | 1,280 (+11%) | 4mo | $188,000 | $147 | 48 |
| 822 S 38th St | 0.68mi | 3/2.0 | 1,309 (+14%) | 1mo | $195,000 | $149 | 43 |
Match score weights: distance 35% · size 25% · config 20% · recency 20%. Top-matched comps best support the ARV.
Projected returns pro-forma
-3.0% appreciation · 4.76% rent growth · sell at horizon
- IRR
- -16.2%
- Equity multiple
- 0.42×
- Total profit
- $-22,830
- Equity at exit
- $20,874
- IRR
- -5.3%
- Equity multiple
- 0.63×
- Total profit
- $-14,386
- Equity at exit
- $12,105
Cash invested: $39,200 (down + closing). Projections, not guarantees.
Landlord ↔ Tenant lean methodology
- Overall (STATE)
- 92 Strongly Landlord-Friendly
- State Arkansas
- 92 Strongly Landlord-Friendly · R+14
- County
- — inherits STATE
- City
- — inherits STATE
ZIP-level market 72956
- Rents YoY
- 4.8%
- Active inventory
- 249
- Price-to-rent
- 10.8×
Monthly cashflow live
- Estimated rent
- $1,080 high interval (Pro) →
- Mortgage (P&I)
- −$734
- Tax from tax record
- −$93 /mo · $1,119/yr
- Insurance
- −$58
- HOA
- −$0
- Vacancy / Maint / Mgmt
- −$227
- Net cashflow
- $-32
Break-even live
Sensitivity live
| Price | -10% $47 | -5% $7 | +0% $-32 | +5% $-72 | +10% $-112 |
|---|---|---|---|---|---|
| Rent | -10% $-118 | -5% $-75 | +0% $-32 | +5% $10 | +10% $53 |
| Rate | -1.0pp $38 | -0.5pp $3 | base $-32 | +0.5pp $-69 | +1.0pp $-105 |
UW: 25.0% down · 7.5% · 30yr · 1.5% tax · 5.0% vac · 8.0% maint · 8.0% mgmt
Financing live
Cash to close
- Down payment
- $35,000
- Closing costs
- $4,200
- Reserves months
- —
- Total cash needed
- —
Loan-product check · same deal, 3 products live
Conventional
25% down · 7.5% · 30yr
- Down + closing
- —
- Monthly P&I
- —
- Monthly cashflow
- —
- DSCR
- —
- Eligible?
- —
Personal DTI + credit; lowest rate.
DSCR
20% down · 8.5% · 30yr
- Down + closing
- —
- Monthly P&I
- —
- Monthly cashflow
- —
- DSCR
- —
- Eligible?
- —
No personal income docs; deal must DSCR.
Hard money
10% down · 12.0% · 12mo
- Down + closing
- —
- Monthly P&I
- —
- Monthly cashflow
- —
- DSCR
- —
- Eligible?
- —
Short-term bridge; refi at stabilization.
Rent comps 7 comps
| Address | Beds | Baths | Sqft | Rent | $/sqft | DOM | Units | Dist |
|---|---|---|---|---|---|---|---|---|
| 3409 Kibler Rd Van Buren, AR | 2.0–3.0 | 2.0 | 1000 | $1,075 | $1.07 | 15d | 1 | 0.68mi |
| 1032 S 40th St Van Buren, AR | 1.0–2.0 | 1.0 | 875 | $795 | $0.91 | 15d | 4 | 0.77mi |
| 3802 Hollis Dr Unit 3802A Van Buren, AR | 2.0 | 2.0 | 950 | $995 | $1.05 | 23d | 1 | 1.20mi |
| 208 S 26th St Unit D Van Buren, AR | 2.0 | 1.5 | 1344 | $825 | $0.61 | 23d | 1 | 1.41mi |
| 1515 Oak Grove Rd Van Buren, AR | 4.0 | 2.0 | 1450 | $1,450 | $1.00 | 15d | 1 | 1.42mi |
| 206 S 26th St Apt G Van Buren, AR | 3.0 | 2.0 | 1017 | $975 | $0.96 | 15d | 1 | 1.42mi |
| 4510 Alma Hwy Van Buren, AR | 3.0 | 2.0 | 1104 | $890 | $0.81 | 15d | 1 | 1.48mi |
Listing history 7 events
-
2026-05-13status Pending 397-char remark
Show marketing remark (397 chars)
Move-in ready 3 bedroom, 1.5 bath home! Fresh paint and updated light fixtures throughout give this home a clean, updated feel from the moment you walk in. The layout is comfortable and functional, offering plenty of space for everyday living. This home is eligible for zero-down loans, making it an excellent opportunity for first-time buyers or anyone looking for an affordable, turnkey option.
-
2026-03-27price $140,000 397-char remark
Show marketing remark (397 chars)
Move-in ready 3 bedroom, 1.5 bath home! Fresh paint and updated light fixtures throughout give this home a clean, updated feel from the moment you walk in. The layout is comfortable and functional, offering plenty of space for everyday living. This home is eligible for zero-down loans, making it an excellent opportunity for first-time buyers or anyone looking for an affordable, turnkey option.
-
2026-03-11price $149,000 397-char remark
Show marketing remark (397 chars)
Move-in ready 3 bedroom, 1.5 bath home! Fresh paint and updated light fixtures throughout give this home a clean, updated feel from the moment you walk in. The layout is comfortable and functional, offering plenty of space for everyday living. This home is eligible for zero-down loans, making it an excellent opportunity for first-time buyers or anyone looking for an affordable, turnkey option.
-
2026-02-06price $154,900 397-char remark
Show marketing remark (397 chars)
Move-in ready 3 bedroom, 1.5 bath home! Fresh paint and updated light fixtures throughout give this home a clean, updated feel from the moment you walk in. The layout is comfortable and functional, offering plenty of space for everyday living. This home is eligible for zero-down loans, making it an excellent opportunity for first-time buyers or anyone looking for an affordable, turnkey option.
-
2025-11-17$159,900 Active 397-char remark
Show marketing remark (397 chars)
Move-in ready 3 bedroom, 1.5 bath home! Fresh paint and updated light fixtures throughout give this home a clean, updated feel from the moment you walk in. The layout is comfortable and functional, offering plenty of space for everyday living. This home is eligible for zero-down loans, making it an excellent opportunity for first-time buyers or anyone looking for an affordable, turnkey option.
-
2012-07-23soldstatus $70,000
-
2012-02-28soldstatus $32,000
ⓘ Source: listings_history table (triggers on properties + properties_extension) + one-shot
backfill from property_details.listing_events for pre-trigger history.
Tax reassessment forecast AR · Resets to sale price
- Current annual tax
- $1,119 · $93/mo
- Projected year-2 tax
- $1,119 · $93/mo
- Expected delta
- $0/yr ($0/mo · 0.0%)
ⓘ Screening estimate from a state-policy table — verify with the county assessor before closing.
Climate risk First Street
- Flood 1/10 Low FEMA zone X (unshaded) · 0% chance over 30 yrs
- Wildfire 7/10 Severe
- Heat 7/10 Severe 7 d/yr ≥111°F today · 20 d/yr by 30 yrs out
- Wind 2/10 Low 2% chance of damaging wind over 30 yrs
- Air quality 2/10 Low 0 unhealthy d/yr today · 1 by 30 yrs out
Nearby sold comps map
Loading sold comps map…
Walkable amenities ~0.75 mi
Loading nearby amenities…
Taxation est. · year 1
- Rental income
- $12,964
- − Mortgage interest
- −$7,842
- − Property taxes
- −$1,119
- − Insurance
- −$700
- − Repairs & maintenance
- −$1,037
- − Management
- −$1,037
- − Depreciation
- −$4,073
- Taxable loss
- −$2,844
- Est. tax savings @ 24.0%
- +$683
- After-tax cash flow
- $295/yr
For passive investors: Depreciation is non-cash, so a rental often shows a tax loss while cash-flowing — sheltering income. Rental losses are passive: they offset passive income freely, and up to $25,000/yr can offset ordinary (W-2) income if you actively participate and your MAGI is under $100k (phasing out to $0 by $150k); unused losses carry forward. On sale, claimed depreciation is recaptured at up to 25%, and gains may owe capital-gains tax (a 1031 exchange can defer both). Figures are a year-1 estimate at your 24.0% rate — not tax advice; consult a CPA.
Schools (NCES district)
- District
- Van Buren School District
- NCES district ID
- 0513410
- Math proficiency
- 41% ▼ -8.00%
- Reading proficiency
- 41% ▼ -4.00%
- Median HH income
- $40,350
- Composite
- 34.41/100
- National rank
- #5201
- State rank
- #62 of 238 in AR
Livability — Van Buren
- Score
- 69/100
- State rank
- #75
- US rank
- #8898
Category grades
Schools grade is shown separately in the Schools card above.
Census & demographics
- Census place
- Van Buren, AR
- County
- Crawford County · 34,546 people
- City population
- 34,546
- Metro
- Fort Smith, AR-OK
- Population (ZIP)
- 34,546
- Household income
- $62,988
- Rent vs Own
- Severe rent burden
- 571.0
Population outlook (Crawford County) Hauer SSP2
- Today (2025)
- 62,108 people
- By 2030
- 61,519 · -0.9%
- By 2040
- 59,735 · -3.8%
- By 2050
- 57,521 · -7.4%
- By 2075
- 53,143 · -14.4%
- By 2100
- 49,596 · -20.1%
Race, ethnicity, and origin ACS 2023
- Neighborhood character
- Predominantly White (76%)
- Race & ethnicity
- White 76% Hispanic / Latino 12% Two or more races 11% Asian 2% Native American 1% Black 1%
- Hispanic origin (detail)
- Mexican 5%
- Common ancestry
- Lithuanian 1% Slovak 1% Romanian 1%
- Foreign-born
- 6% · Canada
- Languages at home
- 89% English-only · Spanish 10%
Political lean MEDSL · Crawford
- 2024 margin
- Solid R (+58.2) · D 19.9% · R 78.1% · Other 2.0%
- 2008→2024 swing
- -12.1pp toward R · 2008: -46.0pp · 2024: -58.2pp
- All cycles
- 2024: R+58.2 2020: R+56.7 2016: R+55.0 2012: R+49.9 2008: R+46.0
Not yet ingested
- Civics
- —
Market trends
- HPI YoY
- ▼ -156.05%
- Current HPI
- 221.3066
- Rent YoY
- ▲ 4.76%
- Metro
- Fort Smith, AR-OK
- State GDP YoY
- ▲ 3.80%
- F500 in state
- 10
Industry mix (Fortune 500 HQ in AR)
| Industry | F500 HQs | Revenue |
|---|---|---|
| Retail | 1 | $681B |
|
||
| Food / Agriculture | 1 | $53B |
|
||
| Retail / Energy | 1 | $22B |
|
||
| Transportation / Logistics | 1 | $12B |
|
||
| Energy | 1 | $4B |
|
||
Price history
+337.5% since first listed7 events — show timeline
- 2026-05-13 Pending — WRVBOR
- 2026-03-27 Price Changed $140,000 WRVBOR
- 2026-03-11 Price Changed $149,000 WRVBOR
- 2026-02-06 Price Changed $154,900 WRVBOR
- 2025-11-17 Listed $159,900 WRVBOR
- 2012-07-23 Sold (Public Records) $70,000 Public Records
- 2012-02-28 Sold (Public Records) $32,000 Public Records
Property tax history
+5.7%/yrLatest (2025): $1,119 · +53.3% YoY. Source: county tax records.
Cash-flow waterfall
monthlySold comps — $/sqft
last 12 mo · ≤1 miLoading sold comps…