1621 Coronado Ave · La Presa, CA
Flood risk 1/10 · Minimal
- FEMA flood zone
- X (unshaded)
- Chance of flooding over 30 yrs
- 0.0%
- Est. flood insurance / yr
- $507 – $1,088
Fire risk 5/10 · Moderate
- Est. fire insurance / yr
- $659 – $1,223
Heat risk 4/10 · Minor
- Hot days now (above 93°F)
- 3 days/yr
- Hot days in 30 yrs
- 9 days/yr
Wind risk 1/10 · Minimal
- Chance of severe wind over 30 yrs
- —
Air-quality risk 3/10 · Minor
- Unhealthy air days now
- 3 days/yr
- Unhealthy air days in 30 yrs
- 3 days/yr
Risk factors via First Street. Map © Google.
Why this score? — see what drove the D grade
The composite is a weighted blend of 9 inputs, each scored 0–100. Each bar is that input's sub-score; the figure is the points it added to the 100-point composite (weight × sub-score).
- Cash flow +12.8/30.0
- ARV discount +7.5/15.0
- Schools +4.4/10.0
- 1% rule +4.3/10.0
- DSCR +3.8/10.0
- Livability +3.0/5.0
- Rent growth +2.7/5.0
- Condition / age +2.5/5.0
- Appreciation +0.0/10.0
$449,000
🖨 Deal sheet (PDF) 📄 Offer letter ✓ Due diligence
Listing remarks
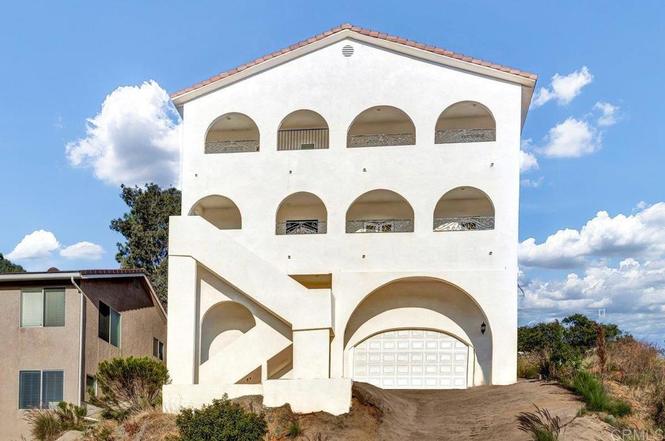
Amazing views & an amazing opportunity! Now shovel-ready with fully approved county plans to finish the project and realize fast profits! Save months of time and hassle. Attention seasoned builders, investors, and flippers! Offering 7 bedrooms this property is a true canvas for transformation. Ideal for those seeking a rewarding value-add project in a highly sought-after location. This new construction home boasts stunning views that are sure to impress. Bring your vision and unlock the full potential of this diamond in the rough.
Key facts
- Stunning views
- 6,403 sq ft lot
- 2 garage spots
Tags
Property features AI
Finance
- Other: Parcel number 5793922300; Located in La Mesa-Spring Valley high school district
- Financial info: Assessments: Unknown
Exterior
- Parking: Attached garage; Two garage spaces; Two total parking spaces
- Utilities: Lot size and living area sourced from assessor's data
- Home design: Single-family home (R1 zoning); Three total stories; No common walls; Lot approximately 0–1 unit per acre (assessor's data)
- Construction: Year built per assessor
- Exterior features: No pool; Property has a view; Curbs
Interior
- Bedrooms: One main-level bedroom
- Bathrooms: Three full bathrooms; One bathroom on the main level
- Interior features: Three or more levels; Entry located up the stairs, farthest away from the front door; Second-level entry
- Laundry & utility: Washer hookup; Has laundry
Neighborhood map
What this means for you Summary
Snapshot
- This is a 7-bed/3.0-bath single-family listed at $449k.
Deal economics
- At list price, monthly cash flow is $-40 ($-483/yr) — negative.
- To cash-flow at today's rent, offer at most $442k (1.6% below list).
- To meet the 1% rule (rent ≥ 1% of price), the offer needs to be $417k (7.1% below list).
- Recommended offer: $395k (12.0% below list) — sets the bar for market timing.
- Cap rate 6.2% vs local median 2.9% in La Presa — top-decile yield for the area; either an underpriced asset or a hidden risk that comps aren't pricing in. Stress-test before assuming the spread holds.
Location & tenants
- Location reads 60/100 on livability (#571 in CA) — a middle-class / working-renter tenant base. Strengths: commute A+, employment B, housing B; Watch: health & safety D, crime F, cost of living F.
- La Mesa-Spring Valley (suburban): math 41% / reading 53% proficiency, ranked #478 of 1,400 in CA (top 34%) — families likely to look elsewhere, expect single-tenant / working-renter base with shorter leases.
- Zoned schools: Sweetwater Springs Elementary (435 students, 69% FRL); Sci Tech Engr Arts And Math Acad At La Presa (718 students, 81% FRL); Monte Vista High (math 32% / reading 60%, grade D-, #409 of 1,170 statewide, top 36%, 1,569 students, 76% FRL) — zoned schools average 76% FRL vs 46% district-wide (30 pts higher); higher-poverty schools than district average — tighter screening recommended.
- Market conditions: Rents flat; 161 active listings in the ZIP; 1 comparable units currently listed for rent nearby; solid renter incomes; 11,759 units permitted in San Diego County in 2024 (7,244 in 5+ unit buildings).
- At $4,172/mo this rent would consume 50% of the median local household income ($100k/yr) (locally 2007% of renters already pay >50% of income on rent) — very limited rent-growth headroom before tenants either downsize or default.
Forward outlook
- Local home prices are declining (-3.0%/yr); year-one equity from $3k of loan paydown is wiped out by about $13k of value loss. Plan a longer hold.
- San Diego County population projected at +20% by 2050 — long-run rental-demand tailwind backs the buy-and-hold thesis.
Negotiation context
- It's been on market 177 days — a 12% lower offer ($395k) is reasonable based on typical stale-listing flexibility.
- 11 sale attempts since 18y ago; this cycle's ask has dropped $151k (25%) from the opening price — seller is motivated, your offer sets the floor, not the list.
- Current owner paid $60k; list at $449k implies a 648% gain — meaningful room to come down on a strong offer.
Risks & watch-outs
- Climate carrying-cost: moderate wildfire risk — expect insurance premiums to compound above CPI over the hold.
Questions for the listing agent
- What do current leases actually rent for vs. the listed asking? Can we see a recent rent roll and the last 12 months of T-12 income?
- It's been on market 177 days. Have you received any prior offers? Is the seller open to a 12% concession, seller financing, or rate buy-down credit?
- Why hasn't it sold? Are there any deal-killer items the seller is aware of (foundation, flood, title, zoning, code violations)?
- Is there a deadline driving the sale (1031 exchange, divorce, estate, relocation)? That informs how much negotiation room exists.
- Schools are D-rated, which usually means shorter tenancies and higher turnover. Who's the typical renter profile here, and what's been the actual vacancy rate?
- Crime grade is F in this area — have there been break-ins, vandalism, or insurance claims at this property in the last 3 years? What carrier currently insures it and at what premium?
- The area grade is low — what's the realistic commute time and amenity access for the typical tenant pool here? Any planned neighborhood developments (good or bad) we should know about?
- What's the average days-on-market for RENTAL listings here right now (not sales)? A rising rental-DOM trend means longer vacancies and softer asking-rent achievability than the comps imply.
- What's the recent tenant-quality profile in this submarket — average credit score on applications, eviction rate, late-payment / NSF rate, and stable-employment percentage? A property-management company in the area should have these aggregated.
- How much new for-sale + rental construction is in the pipeline within 1–3 miles? Heavy new supply typically softens prices + rents 12–24 months out; constrained supply supports both.
Investment metrics
- 1% rule
- 0.93% ✗
- Cap rate
- 6.19%
- Cash-on-cash
- -0.38%
- DSCR
- 0.98
- GRM
- 9.0
CMA / ARV
- ARV (on-the-fly)
- $1,057,060
- Comps found
- 5
Show comp detail 5 sales within ~0.75 mi
| Address | Dist | Beds/Ba | Sqft | Sold | Price | $/sf | Match |
|---|---|---|---|---|---|---|---|
| 1606 Sangamon Ave | 0.20mi | 7/4.0 | 3,223 (+4%) | 3mo | $480,000 | $149 | 78 |
| 1403 Capistrano Ave | 0.20mi | 6/3.5 (-1) | 2,931 (-6%) | 21mo | $1,000,000 | $341 | 57 |
| 1431 Grand Ave | 0.53mi | 6/4.0 (-1) | 3,082 (-1%) | 15mo | $445,000 | $144 | 52 |
| 9915 JACOBY Rd | 0.29mi | 6/4.0 (-1) | 3,481 (+12%) | 8mo | $1,365,000 | $392 | 51 |
| 1047 Sangamon Ave | 0.43mi | 6/4.5 (-1) | 3,516 (+13%) | 5mo | $1,195,000 | $340 | 43 |
Match score weights: distance 35% · size 25% · config 20% · recency 20%. Top-matched comps best support the ARV.
Projected returns pro-forma
-3.0% appreciation · 0.88% rent growth · sell at horizon
- IRR
- -19.5%
- Equity multiple
- 0.33×
- Total profit
- $-83,828
- Equity at exit
- $66,947
- IRR
- -17.8%
- Equity multiple
- 0.13×
- Total profit
- $-109,728
- Equity at exit
- $38,821
Cash invested: $125,720 (down + closing). Projections, not guarantees.
Landlord ↔ Tenant lean methodology
- Overall (STATE)
- 18 Strongly Tenant-Friendly
- State California
- 18 Strongly Tenant-Friendly · D+13
- County
- — inherits STATE
- City
- — inherits STATE
ZIP-level market 91977
- Rents YoY
- 0.9%
- Active inventory
- 161
- Price-to-rent
- 9.0×
Monthly cashflow live
- Estimated rent
- $4,172 medium interval (Pro) →
- Mortgage (P&I)
- −$2,355
- Tax from tax record
- −$794 /mo · $9,531/yr
- Insurance
- −$187
- HOA
- −$0
- Vacancy / Maint / Mgmt
- −$876
- Net cashflow
- $-40
Break-even live
Sensitivity live
| Price | -10% $214 | -5% $87 | +0% $-40 | +5% $-167 | +10% $-294 |
|---|---|---|---|---|---|
| Rent | -10% $-370 | -5% $-205 | +0% $-40 | +5% $125 | +10% $289 |
| Rate | -1.0pp $186 | -0.5pp $74 | base $-40 | +0.5pp $-157 | +1.0pp $-275 |
UW: 25.0% down · 7.5% · 30yr · 1.5% tax · 5.0% vac · 8.0% maint · 8.0% mgmt
Financing live
Cash to close
- Down payment
- $112,250
- Closing costs
- $13,470
- Reserves months
- —
- Total cash needed
- —
Loan-product check · same deal, 3 products live
Conventional
25% down · 7.5% · 30yr
- Down + closing
- —
- Monthly P&I
- —
- Monthly cashflow
- —
- DSCR
- —
- Eligible?
- —
Personal DTI + credit; lowest rate.
DSCR
20% down · 8.5% · 30yr
- Down + closing
- —
- Monthly P&I
- —
- Monthly cashflow
- —
- DSCR
- —
- Eligible?
- —
No personal income docs; deal must DSCR.
Hard money
10% down · 12.0% · 12mo
- Down + closing
- —
- Monthly P&I
- —
- Monthly cashflow
- —
- DSCR
- —
- Eligible?
- —
Short-term bridge; refi at stabilization.
Rent comps 1 comps
| Address | Beds | Baths | Sqft | Rent | $/sqft | DOM | Units | Dist |
|---|---|---|---|---|---|---|---|---|
| 10160 Challenger Cir Spring Valley, CA | 6.0 | 4.0 | 2920 | $5,850 | $2.00 | 3d | 1 | 1.14mi |
Listing history 44 events
-
2026-06-21days on market $449,000 Active 177 DOM
-
2026-06-18days on market $449,000 Active 174 DOM
-
2026-06-17days on market $449,000 Active 173 DOM
-
2026-06-16days on market $449,000 Active 172 DOM
-
2026-06-15days on market $449,000 Active 171 DOM
-
2026-06-13days on market $449,000 Active 169 DOM
-
2026-06-09days on market $449,000 Active 165 DOM
-
2026-06-08days on market $449,000 Active 164 DOM
-
2026-06-07days on market $449,000 Active 163 DOM
-
2026-06-04days on market $449,000 Active 160 DOM
-
2026-06-03days on market $449,000 Active 159 DOM
-
2026-06-02days on market $449,000 Active 158 DOM
-
2026-06-01days on market $449,000 Active 157 DOM
-
2026-05-31days on market $449,000 Active 156 DOM
-
2026-05-05status Active
-
2026-04-02historical Active Under Contract
-
2026-02-23status Active
-
2026-02-23price $449,000
-
2026-02-09historical Active Under Contract
-
2026-01-16price $549,000
-
2025-12-26$600,000 Active
-
2024-05-31historical
-
2024-05-06$748,000 Active
-
2024-04-29historical
-
2024-04-02price $748,000
-
2024-03-11status Active
-
2024-02-17historical Active Under Contract
-
2024-01-22$749,000 Active
-
2023-10-01historical
-
2023-09-27$749,000 Active
-
2023-09-26historical
-
2023-05-11status Pending Sale
-
2023-05-10historical
-
2023-04-25$749,000 Active
-
2023-02-01historical
-
2022-09-29price $1,100,000
-
2022-07-17price $750,000
-
2022-01-24price $1,100,000
-
2022-01-06$800,000 Active
-
2009-02-27historical
-
2009-01-05$49,980
-
2008-12-08historical
-
2008-06-13$78,900
-
2003-10-14soldstatus $60,000
ⓘ Source: listings_history table (triggers on properties + properties_extension) + one-shot
backfill from property_details.listing_events for pre-trigger history.
Tax reassessment forecast CA · Resets to sale price
- Current annual tax
- $9,531 · $794/mo
- Projected year-2 tax
- $9,531 · $794/mo
- Expected delta
- $0/yr ($0/mo · 0.0%)
ⓘ Screening estimate from a state-policy table — verify with the county assessor before closing.
Climate risk First Street
- Flood 1/10 Low FEMA zone X (unshaded) · 0% chance over 30 yrs
- Wildfire 5/10 Major
- Heat 4/10 Moderate 3 d/yr ≥93°F today · 9 d/yr by 30 yrs out
- Wind 1/10 Low
- Air quality 3/10 Moderate 3 unhealthy d/yr today · 3 by 30 yrs out
Nearby sold comps map
Loading sold comps map…
Walkable amenities ~0.75 mi
Loading nearby amenities…
Taxation est. · year 1
- Rental income
- $50,061
- − Mortgage interest
- −$25,151
- − Property taxes
- −$9,531
- − Insurance
- −$2,245
- − Repairs & maintenance
- −$4,005
- − Management
- −$4,005
- − Depreciation
- −$13,062
- Taxable loss
- −$7,937
- Est. tax savings @ 24.0%
- +$1,905
- After-tax cash flow
- $1,422/yr
For passive investors: Depreciation is non-cash, so a rental often shows a tax loss while cash-flowing — sheltering income. Rental losses are passive: they offset passive income freely, and up to $25,000/yr can offset ordinary (W-2) income if you actively participate and your MAGI is under $100k (phasing out to $0 by $150k); unused losses carry forward. On sale, claimed depreciation is recaptured at up to 25%, and gains may owe capital-gains tax (a 1031 exchange can defer both). Figures are a year-1 estimate at your 24.0% rate — not tax advice; consult a CPA.
Schools (NCES district)
- District
- La Mesa-Spring Valley
- NCES district ID
- 0620250
- Math proficiency
- 41% ▲ 1.00%
- Reading proficiency
- 53% ▬ 0.00%
- Median HH income
- $61,742
- Composite
- 43.53/100
- National rank
- #6442
- State rank
- #478 of 1400 in CA
Livability — La Presa
- Score
- 60/100
- State rank
- #571
- US rank
- #18714
Category grades
Schools grade is shown separately in the Schools card above.
Census & demographics
- Census place
- La Presa, CA
- County
- San Diego County · 3,178,799 people
- City population
- 62,957
- Metro
- San Diego-Chula Vista-Carlsbad, CA
- Population (ZIP)
- 61,064
- Household income
- $99,657
- Rent vs Own
- Severe rent burden
- 2007.0
Population outlook (San Diego County) Hauer SSP2
- Today (2025)
- 3,678,185 people
- By 2030
- 3,856,546 · +4.8%
- By 2040
- 4,171,407 · +13.4%
- By 2050
- 4,421,607 · +20.2%
- By 2075
- 4,831,599 · +31.4%
- By 2100
- 4,832,502 · +31.4%
Race, ethnicity, and origin ACS 2023
- Neighborhood character
- Diverse neighborhood (Simpson 0.68)
- Race & ethnicity
- Hispanic / Latino 46% White 29% Two or more races 19% Black 12% Asian 7% Native American 1%
- Hispanic origin (detail)
- Mexican 43%
- Common ancestry
- Portuguese 2% Lithuanian 1% Italian 1%
- Foreign-born
- 19% · Canada, China, Vietnam
- Languages at home
- 59% English-only · Spanish 32% Tagalog/Filipino 3% Arabic 1%
Political lean MEDSL · San Diego
- 2024 margin
- D (+16.8) · D 56.9% · R 40.1% · Other 2.9%
- 2008→2024 swing
- +6.6pp toward D · 2008: 10.2pp · 2024: 16.8pp
- All cycles
- 2024: D+16.8 2020: D+22.8 2016: D+17.8 2012: D+5.1 2008: D+10.2
Not yet ingested
- Civics
- —
Market trends
- HPI YoY
- ▼ -697.99%
- Current HPI
- 381.66
- Rent YoY
- ▲ 0.88%
- Metro
- San Diego-Chula Vista-Carlsbad, CA
- State GDP YoY
- ▲ 3.21%
- F500 in state
- 116
Industry mix (Fortune 500 HQ in CA)
| Industry | F500 HQs | Revenue |
|---|---|---|
| Technology | 27 | $1,492B |
|
||
| Financial Services | 3 | $174B |
|
||
| Retail | 3 | $44B |
|
||
| Insurance | 3 | $26B |
|
||
| Media / Entertainment | 2 | $115B |
|
||
| Pharmaceuticals / Biotech | 2 | $62B |
|
||
Price history
+648.3% since first listed30 events — show timeline
- 2026-05-05 Relisted — CRMLS
- 2026-04-02 Contingent — CRMLS
- 2026-02-23 Relisted — CRMLS
- 2026-02-23 Price Changed $449,000 CRMLS
- 2026-02-09 Contingent — CRMLS
- 2026-01-16 Price Changed $549,000 CRMLS
- 2025-12-26 Listed $600,000 CRMLS
- 2024-05-31 Listing Removed — CRMLS
- 2024-05-06 Listed $748,000 CRMLS
- 2024-04-29 Listing Removed — CRMLS
- 2024-04-02 Price Changed $748,000 CRMLS
- 2024-03-11 Relisted — CRMLS
- 2024-02-17 Contingent — CRMLS
- 2024-01-22 Listed $749,000 CRMLS
- 2023-10-01 Listing Removed — CRMLS
- 2023-09-27 Listed $749,000 CRMLS
- 2023-09-26 Coming Soon — CRMLS
- 2023-05-11 Pending — CRMLS
- 2023-05-10 Listing Removed — CRMLS
- 2023-04-25 Listed $749,000 CRMLS
- 2023-02-01 Listing Removed — SDMLS
- 2022-09-29 Price Changed $1,100,000 SDMLS
- 2022-07-17 Price Changed $750,000 SDMLS
- 2022-01-24 Price Changed $1,100,000 SDMLS
- 2022-01-06 Listed $800,000 SDMLS
- 2009-02-27 Listing Removed — SDMLS
- 2009-01-05 Listed $49,980 SDMLS
- 2008-12-08 Listing Removed — SDMLS
- 2008-06-13 Listed $78,900 SDMLS
- 2003-10-14 Sold (Public Records) $60,000 Public Records
Property tax history
+16.2%/yrLatest (2025): $9,531 · +3.4% YoY. Source: county tax records.
Cash-flow waterfall
monthlySold comps — $/sqft
last 12 mo · ≤1 miLoading sold comps…