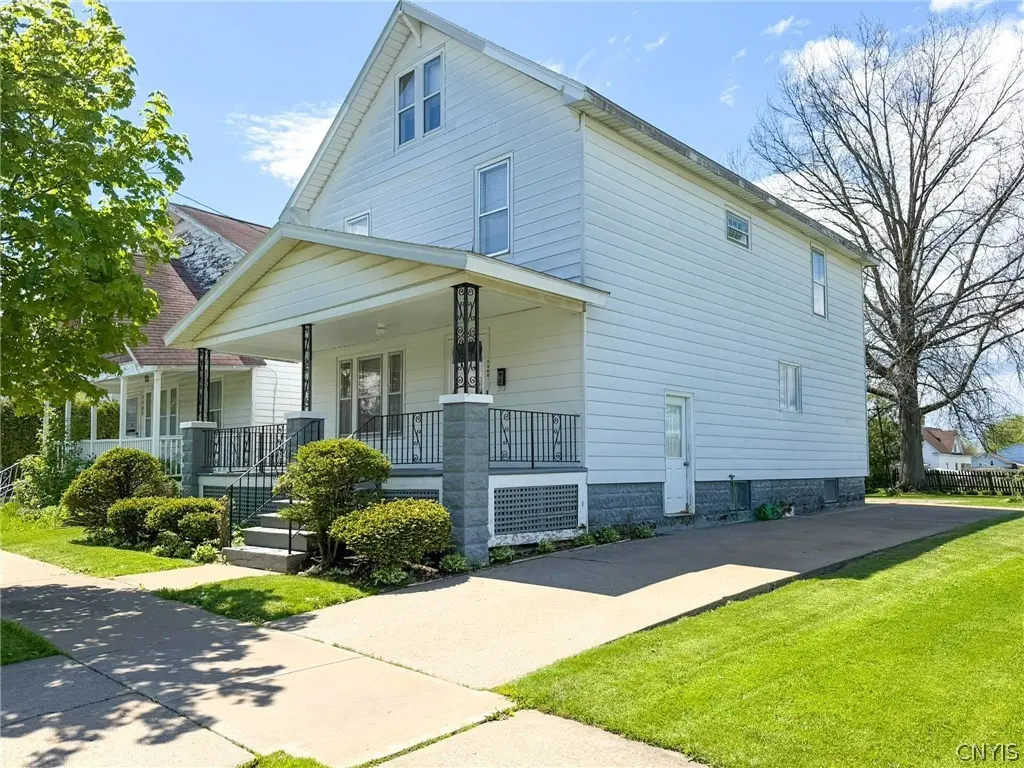
1162 Hammond Ave · Utica, NY
Flood risk 1/10 · Minimal
- FEMA flood zone
- X (unshaded)
- Chance of flooding over 30 yrs
- 0.0%
- Est. flood insurance / yr
- $473 – $860
Fire risk 3/10 · Minor
- Est. fire insurance / yr
- $691 – $1,283
Heat risk 3/10 · Minor
- Hot days now (above 95°F)
- 7 days/yr
- Hot days in 30 yrs
- 17 days/yr
Wind risk 2/10 · Minimal
- Chance of severe wind over 30 yrs
- 1.0%
Air-quality risk 2/10 · Minimal
- Unhealthy air days now
- 0 days/yr
- Unhealthy air days in 30 yrs
- 1 days/yr
Risk factors via First Street. Map © Google.
Why this score? — see what drove the B+ grade
The composite is a weighted blend of 9 inputs, each scored 0–100. Each bar is that input's sub-score; the figure is the points it added to the 100-point composite (weight × sub-score).
- Cash flow +26.6/30.0
- ARV discount +15.0/15.0
- Appreciation +10.0/10.0
- DSCR +9.1/10.0
- 1% rule +5.9/10.0
- Livability +4.0/5.0
- Schools +2.9/10.0
- Rent growth +2.5/5.0
- Condition / age +2.5/5.0
$142,900
🖨 Deal sheet 📄 Offer letter ✓ Due diligence
Listing remarks
Great sized 4–5 bedroom spacious East Utica home, large living room, formal dining room, eat in kitchen, first floor laundry. First floor den/bedroom & bath. Big Front porch, fabulous yard. (Hardwoods below carpeting)
Key facts
- Formal dining room
- Big front porch
- Eat in kitchen
Tags
Property features AI
Exterior
- Parking: No garage
- Utilities: Public water (connected); Sewer connected; Cable available; High-speed internet available; Circuit breaker electric
- Home design: 2-story house; Existing structure
- Construction: Aluminum siding; Asphalt roof; Block foundation
- Exterior features: Concrete driveway; Enclosed porch; Open porch; Patio; Partial fencing
Interior
- Kitchen: Gas oven; Gas range; Refrigerator
- Bedrooms: 1 main-level bedroom; Four additional bedrooms on second floor (total 5 bedrooms)
- Flooring: Carpet; Ceramic tile; Hardwood; Vinyl; Varies
- Bathrooms: 1 full bathroom (main level)
- Heating & cooling: Gas forced-air heating
- Interior features: Entrance foyer; Eat-in kitchen; Storm windows with wood frames
- Laundry & utility: Gas water heater
Neighborhood map
What this means for you Summary
Snapshot
- This is a 4-bed/1.0-bath single-family listed at $143k.
Deal economics
- At list price, monthly cash flow is $381 ($5k/yr) — positive.
- The deal already cash-flows at list — no discount required.
- Meets the 1% rule at list price ($2k rent vs $143k).
- Cap rate 9.5% vs local median 7.7% in Utica — meaningfully above typical; check what's discounted (condition, days-on-market, listing class) to confirm the premium yield is real.
Location & tenants
- Location reads 80/100 on livability (#104 in NY, #1,589 nationally) — a professional / high-income tenant draw. Strengths: commute A+, cost of living A+, housing A+; Watch: employment D, schools D-, crime F.
- Utica City School District (urban): math 33% / reading 38% proficiency, ranked #562 of 590 in NY (top 95%) — families likely to look elsewhere, expect single-tenant / working-renter base with shorter leases; 71% free/reduced lunch — lower-income household profile, screen leases tightly.
- Market conditions: 143 active listings in the ZIP; 3 comparable units currently listed for rent nearby; rentals lingering (median 44d on market — plan ~5-8 weeks vacancy on turnover, expect pricing pressure); 100% of comp listings sitting > 30 days — soft ceiling on asking rent; 204 units permitted in Oneida County in 2024 (68 in 5+ unit buildings).
- This rent runs 36% of the median local income ($53k/yr) — at the standard rent-burdened threshold; future hikes will face affordability resistance.
Forward outlook
- In year one you build about $15k of equity ($988 loan paydown + $14k appreciation (10.0% local appreciation)).
- Oneida County population projected at -12% by 2050 — secular population decline; favor cash flow + early exit over multi-decade hold.
- At projected returns (10.0% appreciation + 3.0% rent growth), your $40k cash investment doubles in ~2 years — after that, you're playing with house money.
- By year 3, paydown + projected appreciation supports a ~$39k cash-out refi (75% LTV) — recoverable capital for the next deal without selling this one.
Negotiation context
- Only 4 days on market — expect competitive offers; lowballing is unlikely to land.
Risks & watch-outs
- Watch-outs: built in 1924 — expect roof / HVAC / electrical / plumbing capex.
Questions for the listing agent
- Built in 1924 — when were the roof, HVAC, electrical panel, plumbing, and water heater last replaced?
- Is there a deadline driving the sale (1031 exchange, divorce, estate, relocation)? That informs how much negotiation room exists.
- Schools are D-rated, which usually means shorter tenancies and higher turnover. Who's the typical renter profile here, and what's been the actual vacancy rate?
- Crime grade is F in this area — have there been break-ins, vandalism, or insurance claims at this property in the last 3 years? What carrier currently insures it and at what premium?
- What's the average days-on-market for RENTAL listings here right now (not sales)? A rising rental-DOM trend means longer vacancies and softer asking-rent achievability than the comps imply.
- What's the recent tenant-quality profile in this submarket — average credit score on applications, eviction rate, late-payment / NSF rate, and stable-employment percentage? A property-management company in the area should have these aggregated.
- How much new for-sale + rental construction is in the pipeline within 1–3 miles? Heavy new supply typically softens prices + rents 12–24 months out; constrained supply supports both.
Investment metrics
- 1% rule
- 1.09% ✓
- Cap rate
- 9.50%
- Cash-on-cash
- 11.44%
- DSCR
- 1.51
- GRM
- 7.6
CMA / ARV
- ARV (median comp)
- $215,217
- List price
- $142,900
- Delta
- -33.60%
- Verdict
- UNDERPRICED
- Comps
- 20 within 1.0 mi
Show comp detail 12 sales within ~0.75 mi
| Address | Dist | Beds/Ba | Sqft | Sold | Price | $/sf | Match |
|---|---|---|---|---|---|---|---|
| 1110 Leeds St | 0.25mi | 3/2.0 (-1) | 1,898 (-0%) | 8mo | $160,000 | $84 | 72 |
| 1242 Hilton Ave | 0.33mi | 4/2.0 | 1,704 (-10%) | 3mo | $210,000 | $123 | 61 |
| 1220 Greenview Dr | 0.21mi | 4/2.0 | 1,680 (-12%) | 8mo | $215,000 | $128 | 60 |
| 1607 Depeyster Ave | 0.69mi | 4/1.5 | 1,979 (+4%) | 5mo | $247,000 | $125 | 54 |
| 1105 Leeds St | 0.25mi | 3/1.5 (-1) | 2,170 (+14%) | 5mo | $63,500 | $29 | 54 |
| 1505 Brookside Ave | 0.58mi | 3/1.5 (-1) | 1,728 (-9%) | 3mo | $210,000 | $122 | 48 |
| 1000 Sherman Dr | 0.53mi | 4/2.5 | 2,081 (+10%) | 8mo | $339,000 | $163 | 47 |
| 1142 Brinckerhoff Ave | 0.69mi | 3/1.0 (-1) | 1,800 (-5%) | 11mo | $60,000 | $33 | 45 |
| 1319 Rutger St | 0.65mi | 3/1.0 (-1) | 2,025 (+7%) | 12mo | $254,000 | $125 | 44 |
| 1108 Tilden Ave | 0.49mi | 4/2.0 | 1,637 (-14%) | 8mo | $267,000 | $163 | 43 |
| 1614 Harrison Ave | 0.74mi | 3/2.0 (-1) | 1,986 (+4%) | 8mo | $319,300 | $161 | 42 |
| 1202 Mary St | 0.66mi | 3/3.0 (-1) | 2,064 (+9%) | 11mo | $250,000 | $121 | 32 |
Match score weights: distance 35% · size 25% · config 20% · recency 20%. Top-matched comps best support the ARV.
Projected returns pro-forma
10.0% appreciation · 3.0% rent growth · sell at horizon
- IRR
- 32.7%
- Equity multiple
- 3.55×
- Total profit
- $102,054
- Equity at exit
- $128,736
- IRR
- 28.2%
- Equity multiple
- 8.03×
- Total profit
- $281,315
- Equity at exit
- $277,623
Cash invested: $40,012 (down + closing). Projections, not guarantees.
Landlord ↔ Tenant lean methodology
- Overall (STATE)
- 15 Strongly Tenant-Friendly
- State New York
- 15 Strongly Tenant-Friendly · D+10
- County
- — inherits STATE
- City
- — inherits STATE
ZIP-level market 13501
- Home prices YoY
- 5.6%
- Active inventory
- 143
- Price-to-rent
- 7.6×
Monthly cashflow live
- Estimated rent
- $1,561 medium interval (Pro) →
- Mortgage (P&I)
- −$749
- Tax from tax record
- −$43 /mo · $514/yr
- Insurance
- −$60
- HOA
- −$0
- Vacancy / Maint / Mgmt
- −$328
- Net cashflow
- $381
Break-even live
UW: 25.0% down · 7.5% · 30yr · 1.5% tax · 5.0% vac · 8.0% maint · 8.0% mgmt
Financing live
Cash to close
- Down payment
- $35,725
- Closing costs
- $4,287
- Reserves months
- —
- Total cash needed
- —
Loan-product check · same deal, 3 products live
Conventional
25% down · 7.5% · 30yr
- Down + closing
- —
- Monthly P&I
- —
- Monthly cashflow
- —
- DSCR
- —
- Eligible?
- —
Personal DTI + credit; lowest rate.
DSCR
20% down · 8.5% · 30yr
- Down + closing
- —
- Monthly P&I
- —
- Monthly cashflow
- —
- DSCR
- —
- Eligible?
- —
No personal income docs; deal must DSCR.
Hard money
10% down · 12.0% · 12mo
- Down + closing
- —
- Monthly P&I
- —
- Monthly cashflow
- —
- DSCR
- —
- Eligible?
- —
Short-term bridge; refi at stabilization.
Rent comps 3 comps
| Address | Beds | Baths | Sqft | Rent | $/sqft | DOM | Units | Dist |
|---|---|---|---|---|---|---|---|---|
| 807 Eagle St Utica, NY | 3.0 | 1.0 | 1526 | $1,300 | $0.85 | 43d | 1 | 0.15mi |
| 1124 Dudley Ave Unit 1 Utica, NY | 3.0 | 1.0 | 1300 | $1,400 | $1.08 | 43d | 1 | 0.76mi |
| 1642 Taylor Ave #1644 Utica, NY | 3.0 | 1.0 | 2600 | $1,650 | $0.63 | 43d | 1 | 0.97mi |
Listing history 2 events
-
2026-05-16status Pending 229-char remark
-
2026-05-12$142,900 Active 229-char remark
ⓘ Source: listings_history table (triggers on properties + properties_extension) + one-shot
backfill from property_details.listing_events for pre-trigger history.
Tax reassessment forecast NY · Partial reset (capped growth)
- Current annual tax
- $514 · $43/mo
- Projected year-2 tax
- $1,464 · $122/mo
- Expected delta
- +$951/yr (+$79/mo · 185.0%)
ⓘ Screening estimate from a state-policy table — verify with the county assessor before closing.
Climate risk First Street
- Flood 1/10 Low FEMA zone X (unshaded) · 0% chance over 30 yrs
- Wildfire 3/10 Moderate
- Heat 3/10 Moderate 7 d/yr ≥95°F today · 17 d/yr by 30 yrs out
- Wind 2/10 Low 100% chance of damaging wind over 30 yrs
- Air quality 2/10 Low 0 unhealthy d/yr today · 1 by 30 yrs out
Nearby sold comps map
Loading sold comps map…
Walkable amenities ~0.75 mi
Loading nearby amenities…
Taxation est. · year 1
- Rental income
- $18,730
- − Mortgage interest
- −$8,005
- − Property taxes
- −$514
- − Insurance
- −$714
- − Repairs & maintenance
- −$1,498
- − Management
- −$1,498
- − Depreciation
- −$4,157
- Taxable income
- $2,343
- Est. tax owed @ 24.0%
- −$562
- After-tax cash flow
- $4,014/yr
For passive investors: Depreciation is non-cash, so a rental often shows a tax loss while cash-flowing — sheltering income. Rental losses are passive: they offset passive income freely, and up to $25,000/yr can offset ordinary (W-2) income if you actively participate and your MAGI is under $100k (phasing out to $0 by $150k); unused losses carry forward. On sale, claimed depreciation is recaptured at up to 25%, and gains may owe capital-gains tax (a 1031 exchange can defer both). Figures are a year-1 estimate at your 24.0% rate — not tax advice; consult a CPA.
Schools (NCES district)
- District
- Utica City School District
- NCES district ID
- 3629370
- Math proficiency
- 33% ▼ -7.00%
- Reading proficiency
- 38% ▲ 2.00%
- Median HH income
- $31,834
- Composite
- 29.01/100
- National rank
- #6613
- State rank
- #562 of 590 in NY
Livability — Utica
- Score
- 80/100
- State rank
- #104
- US rank
- #1589
Category grades
Schools grade is shown separately in the Schools card above.
Census & demographics
- Census place
- Utica, NY
- County
- Oneida County · 89,710 people
- City population
- 72,968
- Metro
- Utica-Rome, NY
- Population (ZIP)
- 38,931
- Household income
- $52,548
- Rent vs Own
- Severe rent burden
- 2251.0
Population outlook (Oneida County) Hauer SSP2
- Today (2025)
- 225,223 people
- By 2030
- 220,384 · -2.1%
- By 2040
- 209,071 · -7.2%
- By 2050
- 197,920 · -12.1%
- By 2075
- 175,541 · -22.1%
- By 2100
- 148,491 · -34.1%
Race, ethnicity, and origin ACS 2023
- Neighborhood character
- Highly diverse neighborhood (Simpson 0.70)
- Race & ethnicity
- White 49% Two or more races 15% Hispanic / Latino 14% Black 14% Asian 14%
- Hispanic origin (detail)
- Puerto Rican 8% Dominican 4%
- Common ancestry
- American 8% Romanian 3% Lithuanian 1%
- Foreign-born
- 25% · Canada, Philippines, Vietnam
- Languages at home
- 62% English-only · Other Asian/Pacific 11% Russian/Polish/Slavic 10% Spanish 9%
Political lean MEDSL · Oneida
- 2024 margin
- Strong R (+21.3) · D 39.4% · R 60.6%
- 2008→2024 swing
- -15.2pp toward R · 2008: -6.1pp · 2024: -21.3pp
- All cycles
- 2024: R+21.3 2020: R+15.5 2016: R+21.1 2012: R+5.3 2008: R+6.1
Not yet ingested
- Civics
- —
Market trends
- HPI YoY
- ▲ 20.28%
- Current HPI
- 382.3726
- Rent YoY
- —
- Metro
- Utica-Rome, NY
- State GDP YoY
- ▲ 2.60%
- F500 in state
- 92
Industry mix (Fortune 500 HQ in NY)
| Industry | F500 HQs | Revenue |
|---|---|---|
| Financial Services | 10 | $950B |
|
||
| Consumer Goods | 9 | $162B |
|
||
| Insurance | 4 | $225B |
|
||
| Telecommunications | 2 | $144B |
|
||
| Pharmaceuticals | 2 | $112B |
|
||
| Media / Entertainment | 2 | $69B |
|
||
Price history
2 events — show timeline
- 2026-05-16 Pending — CNYIS
- 2026-05-12 Listed $142,900 CNYIS
Property tax history
-8.4%/yrLatest (2025): $514 · -24.6% YoY. Source: county tax records.
Cash-flow waterfall
monthlySold comps — $/sqft
last 12 mo · ≤1 miLoading sold comps…