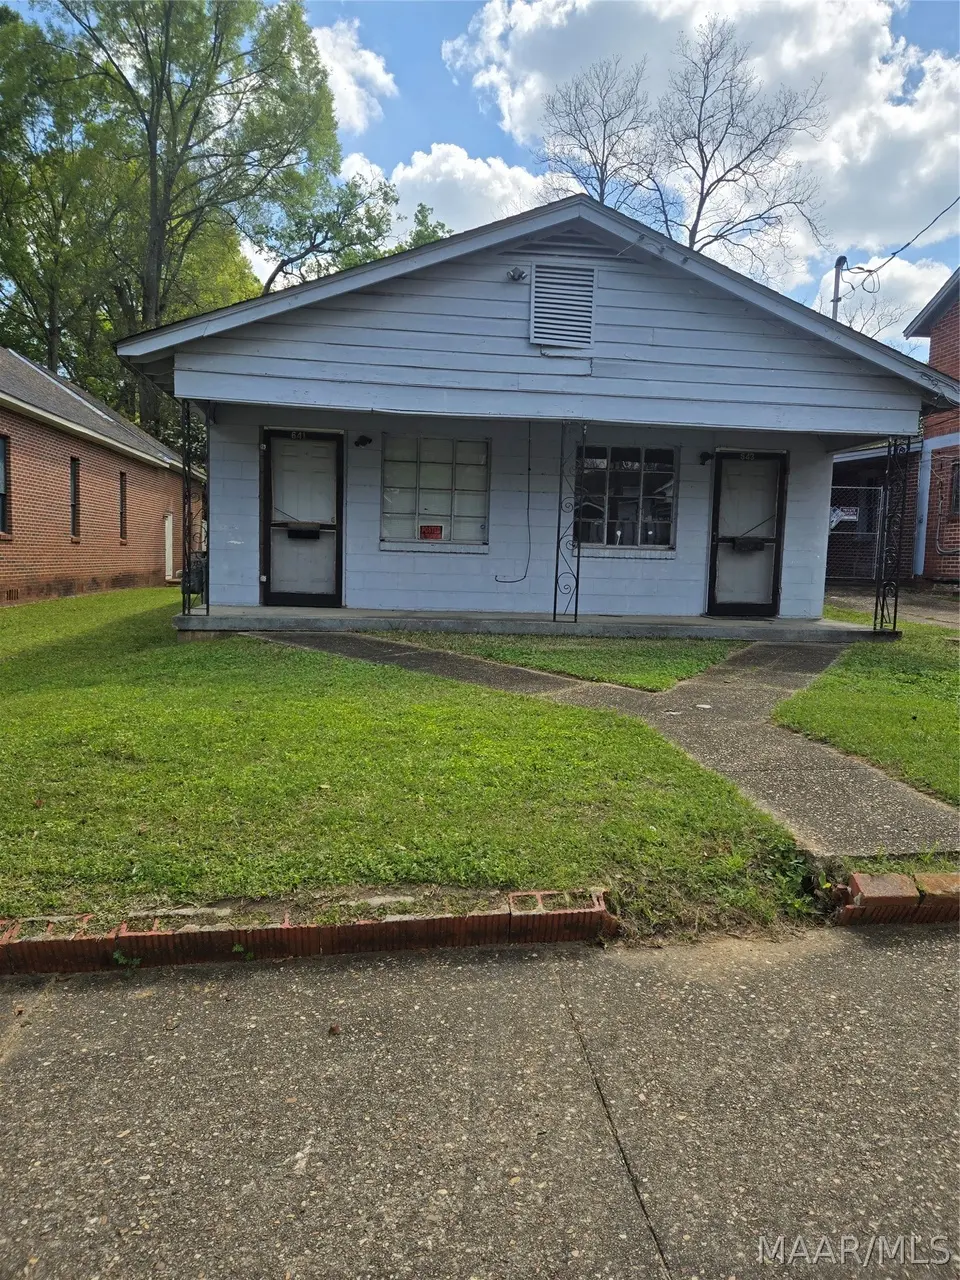
643 Clinton St Unit DUPLEX · Montgomery, AL
Flood risk 1/10 · Minimal
- FEMA flood zone
- X (unshaded)
- Chance of flooding over 30 yrs
- 0.0%
- Est. flood insurance / yr
- $507 – $1,088
Fire risk 1/10 · Minimal
- Est. fire insurance / yr
- $916 – $1,700
Heat risk 7/10 · Major
- Hot days now (above 107°F)
- 7 days/yr
- Hot days in 30 yrs
- 19 days/yr
Wind risk 8/10 · Major
- Chance of severe wind over 30 yrs
- 80.0%
Air-quality risk 3/10 · Minor
- Unhealthy air days now
- 4 days/yr
- Unhealthy air days in 30 yrs
- 4 days/yr
Risk factors via First Street. Map © Google.
Why this score? — see what drove the B grade
The composite is a weighted blend of 9 inputs, each scored 0–100. Each bar is that input's sub-score; the figure is the points it added to the 100-point composite (weight × sub-score).
- Cash flow +30.0/30.0
- DSCR +10.0/10.0
- 1% rule +8.5/10.0
- ARV discount +7.5/15.0
- Appreciation +6.4/10.0
- Livability +3.2/5.0
- Rent growth +2.5/5.0
- Condition / age +2.2/5.0
- Schools +1.7/10.0
$75,000
🖨 Deal sheet (PDF) 📄 Offer letter ✓ Due diligence
Key facts
- Six foot fence
- New paint
- New roof
Tags
Property features AI
Exterior
- Parking: Driveway
- Utilities: Cable available; Electricity available; Natural gas available; Public water; Public sewer
- Home design: Single-story property; Slab foundation; Block and concrete construction; Year built from public records
- Construction: Block and concrete construction; Slab foundation
- Exterior features: Covered patio; Porch; Fully fenced yard; City lot
Interior
- Flooring: Carpet; Laminate
- Bathrooms: 1 full bathroom
- Interior features: Carpet and laminate flooring
- Laundry & utility: Gas water heater
Neighborhood map
What this means for you Summary
Snapshot
- This is a 1-bed/1.0-bath single-family listed at $75k. Condition is rated fair.
Deal economics
- At list price, monthly cash flow is $282 ($3k/yr) — positive.
- The deal already cash-flows at list — no discount required.
- Meets the 1% rule at list price ($1k rent vs $75k).
- Recommended offer: $73k (3.0% below list) — sets the bar for market timing.
- Cap rate 10.8% vs local median 6.0% in Montgomery — top-decile yield for the area; either an underpriced asset or a hidden risk that comps aren't pricing in. Stress-test before assuming the spread holds.
Location & tenants
- Location reads 65/100 on livability (#138 in AL) — a middle-class / working-renter tenant base. Strengths: cost of living A+, housing A+; Watch: employment D, crime F, amenities D-.
- Montgomery County (urban): math 9% / reading 31% proficiency, ranked #106 of 129 in AL (top 82%) — low school quality limits family demand, transient renter base, plan for 1-2y turnover; 70% free/reduced lunch — lower-income household profile, screen leases tightly.
- Zoned schools: Nixon Elementary School (math 2% / reading 8%, grade F, #618 of 627 statewide, top 100%, 441 students, 97% FRL, charter); Bellingrath Middle School (math 0% / reading 12%, grade F, #252 of 257 statewide, top 98%, 607 students, 96% FRL, charter); Lanier Senior High School (math 2% / reading 12%, grade F, #265 of 305 statewide, top 89%, 798 students, 94% FRL) — zoned schools average 95% FRL vs 70% district-wide (25 pts higher); higher-poverty schools than district average — tighter screening recommended.
- Zoned-school proficiency averages 6% at this address vs 20% district-wide (-14 pts) — the specific schools serving this property underperform the Montgomery County average; the district grade overstates school quality for this exact location.
- Market conditions: 65 active listings in the ZIP; 18 comparable units currently listed for rent nearby; rentals at typical pace (median 23d on market — plan ~3-4 weeks tenant-placement turnaround); 44% of comp listings sitting > 30 days — soft ceiling on asking rent; 460 units permitted in Montgomery County in 2024 (37 in 5+ unit buildings).
Forward outlook
- In year one you build about $3k of equity ($519 loan paydown + $2k appreciation (2.7% local appreciation)).
- Montgomery County population projected to shrink 8% by 2050 — rents likely to lag national; underwrite the cash flow, not the appreciation.
- At projected returns (2.7% appreciation + 3.0% rent growth), your $21k cash investment doubles in ~4 years — after that, you're playing with house money.
Negotiation context
- It's been on market 45 days — a 3% lower offer ($73k) is reasonable based on typical stale-listing flexibility.
Risks & watch-outs
- Watch-outs: built in 1940 — expect roof / HVAC / electrical / plumbing capex.
- Climate carrying-cost: severe wind risk, 80% chance of damaging wind over 30y; extreme-heat days projected 7→19/yr by 2055 (HVAC capex compounding) — expect insurance premiums to compound above CPI over the hold.
Questions for the listing agent
- It's been on market 45 days. Have you received any prior offers? Is the seller open to a 3% concession, seller financing, or rate buy-down credit?
- Have any recent inspections been done? Can we get a copy of the seller's disclosures and any deferred-maintenance estimates?
- Built in 1940 — when were the roof, HVAC, electrical panel, plumbing, and water heater last replaced?
- Is there a deadline driving the sale (1031 exchange, divorce, estate, relocation)? That informs how much negotiation room exists.
- Crime grade is F in this area — have there been break-ins, vandalism, or insurance claims at this property in the last 3 years? What carrier currently insures it and at what premium?
- What's the average days-on-market for RENTAL listings here right now (not sales)? A rising rental-DOM trend means longer vacancies and softer asking-rent achievability than the comps imply.
- What's the recent tenant-quality profile in this submarket — average credit score on applications, eviction rate, late-payment / NSF rate, and stable-employment percentage? A property-management company in the area should have these aggregated.
- How much new for-sale + rental construction is in the pipeline within 1–3 miles? Heavy new supply typically softens prices + rents 12–24 months out; constrained supply supports both.
Investment metrics
- 1% rule
- 1.35% ✓
- Cap rate
- 10.80%
- Cash-on-cash
- 16.10%
- DSCR
- 1.72
- GRM
- 6.2
CMA / ARV
- ARV (median comp)
- $22,312
- List price
- $75,000
- Delta
- 236.14%
- Verdict
- OVERPRICED
- Comps
- 20 within 1.0 mi
Show comp detail 6 sales within ~0.75 mi
| Address | Dist | Beds/Ba | Sqft | Sold | Price | $/sf | Match |
|---|---|---|---|---|---|---|---|
| 317 Georgia St | 0.20mi | 2/1.0 (+1) | 1,232 (+15%) | 4mo | $16,000 | $13 | 58 |
| 24 Flood St | 0.51mi | 2/1.0 (+1) | 1,170 (+9%) | 1mo | $33,000 | $28 | 55 |
| 2128 Early St | 0.58mi | 2/1.0 (+1) | 1,119 (+4%) | 10mo | $30,000 | $27 | 52 |
| 2112 Stella St | 0.59mi | 2/1.0 (+1) | 1,061 (-1%) | 18mo | $20,000 | $19 | 50 |
| 1824 S Holt St | 0.51mi | 2/1.0 (+1) | 952 (-11%) | 15mo | $22,000 | $23 | 39 |
| 1108 S Lawrence St | 0.73mi | 2/1.0 (+1) | 1,152 (+7%) | 24mo | $97,500 | $85 | 29 |
Match score weights: distance 35% · size 25% · config 20% · recency 20%. Top-matched comps best support the ARV.
Projected returns pro-forma
2.71% appreciation · 3.0% rent growth · sell at horizon
- IRR
- 22.0%
- Equity multiple
- 2.23×
- Total profit
- $25,835
- Equity at exit
- $32,492
- IRR
- 23.3%
- Equity multiple
- 4.25×
- Total profit
- $68,312
- Equity at exit
- $49,136
Cash invested: $21,000 (down + closing). Projections, not guarantees.
Landlord ↔ Tenant lean methodology
- Overall (STATE)
- 90 Strongly Landlord-Friendly
- State Alabama
- 90 Strongly Landlord-Friendly · R+15
- County
- — inherits STATE
- City
- — inherits STATE
ZIP-level market 36108
- Home prices YoY
- 2.9%
- Active inventory
- 65
- Price-to-rent
- 6.2×
Monthly cashflow live
- Estimated rent
- $1,013 high interval (Pro) →
- Mortgage (P&I)
- −$393
- Tax est. 1.5%
- −$94 /mo · $1,125/yr
- Insurance
- −$31
- HOA
- −$0
- Vacancy / Maint / Mgmt
- −$213
- Net cashflow
- $282
Break-even live
Sensitivity live
| Price | -10% $334 | -5% $308 | +0% $282 | +5% $256 | +10% $230 |
|---|---|---|---|---|---|
| Rent | -10% $202 | -5% $242 | +0% $282 | +5% $322 | +10% $362 |
| Rate | -1.0pp $319 | -0.5pp $301 | base $282 | +0.5pp $262 | +1.0pp $243 |
UW: 25.0% down · 7.5% · 30yr · 1.5% tax · 5.0% vac · 8.0% maint · 8.0% mgmt
Financing live
Cash to close
- Down payment
- $18,750
- Closing costs
- $2,250
- Reserves months
- —
- Total cash needed
- —
Loan-product check · same deal, 3 products live
Conventional
25% down · 7.5% · 30yr
- Down + closing
- —
- Monthly P&I
- —
- Monthly cashflow
- —
- DSCR
- —
- Eligible?
- —
Personal DTI + credit; lowest rate.
DSCR
20% down · 8.5% · 30yr
- Down + closing
- —
- Monthly P&I
- —
- Monthly cashflow
- —
- DSCR
- —
- Eligible?
- —
No personal income docs; deal must DSCR.
Hard money
10% down · 12.0% · 12mo
- Down + closing
- —
- Monthly P&I
- —
- Monthly cashflow
- —
- DSCR
- —
- Eligible?
- —
Short-term bridge; refi at stabilization.
Rent comps 18 comps
| Address | Beds | Baths | Sqft | Rent | $/sqft | DOM | Units | Dist |
|---|---|---|---|---|---|---|---|---|
| 24 Flood St Montgomery, AL | 2.0 | 1.0 | 1140 | $1,000 | $0.88 | 22d | 1 | 0.50mi |
| 1301 S Perry St Unit A Montgomery, AL | 2.0 | 1.0 | 1100 | $950 | $0.86 | 15d | 1 | 0.67mi |
| 1314 S Hull St Unit 1316B Montgomery, AL | 1.0 | 1.0 | 866 | $700 | $0.81 | 45d | 1 | 0.86mi |
| 1316 S Hull St Unit B Montgomery, AL | 1.0 | 1.0 | 866 | $700 | $0.81 | 45d | 1 | 0.87mi |
| 671 S Perry St Montgomery, AL | 2.0 | 1.0–2.0 | 525 | $1,360 | $2.59 | 22d | 1 | 0.89mi |
| 105 Arlington Rd Unit B Montgomery, AL | 2.0 | 1.0 | 1100 | $925 | $0.84 | 45d | 1 | 0.93mi |
| 432 Clanton Ave Montgomery, AL | 2.0 | 1.0 | 800 | $995 | $1.24 | 15d | 1 | 0.95mi |
| 329 Cloverdale Rd Montgomery, AL | 1.0 | 1.0 | 850 | $725 | $0.85 | 45d | 1 | 0.95mi |
| 718 W Edgemont Ave Unit B Montgomery, AL | 2.0 | 1.0 | 875 | $800 | $0.91 | 22d | 1 | 1.07mi |
| 429 Felder Ave Montgomery, AL | 1.0 | 1.0 | 1000 | $1,075 | $1.07 | 15d | 1 | 1.12mi |
| 545 Clay St Montgomery, AL | 2.0 | 2.0 | 1104 | $1,050 | $0.95 | 45d | 1 | 1.12mi |
| 605 Maxwell Blvd Montgomery, AL | 1.0–2.0 | 1.0–2.0 | 971 | $1,334 | $1.37 | 15d | 11 | 1.20mi |
| 207 Montgomery St Montgomery, AL | 1.0–2.0 | 1.0–2.0 | 890 | $1,335 | $1.50 | 15d | 4 | 1.23mi |
| 3394 Southmont Dr Unit 3 Montgomery, AL | 2.0 | 1.0 | 810 | $1,050 | $1.30 | 45d | 1 | 1.27mi |
| 3394 Southmont Dr Unit 2 Montgomery, AL | 2.0 | 1.0 | 810 | $1,475 | $1.82 | 45d | 1 | 1.27mi |
| 3338 S Hull St Montgomery, AL | 2.0 | 2.0 | 1311 | $1,150 | $0.88 | 22d | 1 | 1.31mi |
| 603 Hubbard Ave Unit A Montgomery, AL | 1.0 | 1.0 | 954 | $950 | $1.00 | 22d | 1 | 1.39mi |
| 215 N Court St Unit 04 Montgomery, AL | 1.0 | 1.0 | 927 | $1,570 | $1.69 | 45d | 1 | 1.50mi |
Listing history 17 events
-
2026-06-21days on market $75,000 Active 45 DOM
-
2026-06-18days on market $75,000 Active 42 DOM
-
2026-06-17days on market $75,000 Active 41 DOM
-
2026-06-16days on market $75,000 Active 40 DOM
-
2026-06-15days on market $75,000 Active 39 DOM
-
2026-06-14days on market $75,000 Active 37 DOM
-
2026-06-13days on market $75,000 Active 36 DOM
-
2026-06-10days on market $75,000 Active 34 DOM
-
2026-06-09days on market $75,000 Active 33 DOM
-
2026-06-08days on market $75,000 Active 32 DOM
-
2026-06-07days on market $75,000 Active 31 DOM
-
2026-06-03days on market $75,000 Active 27 DOM
-
2026-06-02days on market $75,000 Active 26 DOM
-
2026-06-01days on market $75,000 Active 25 DOM
-
2026-05-31days on market $75,000 Active 24 DOM
-
2026-05-30days on market $75,000 Active 23 DOM
-
2026-05-07$75,000 Active 251-char remark
ⓘ Source: listings_history table (triggers on properties + properties_extension) + one-shot
backfill from property_details.listing_events for pre-trigger history.
Climate risk First Street
- Flood 1/10 Low FEMA zone X (unshaded) · 0% chance over 30 yrs
- Wildfire 1/10 Low
- Heat 7/10 Severe 7 d/yr ≥107°F today · 19 d/yr by 30 yrs out
- Wind 8/10 Severe 80% chance of damaging wind over 30 yrs
- Air quality 3/10 Moderate 4 unhealthy d/yr today · 4 by 30 yrs out
Nearby sold comps map
Loading sold comps map…
Walkable amenities ~0.75 mi
Loading nearby amenities…
Taxation est. · year 1
- Rental income
- $12,152
- − Mortgage interest
- −$4,201
- − Property taxes
- −$1,125
- − Insurance
- −$375
- − Repairs & maintenance
- −$972
- − Management
- −$972
- − Depreciation
- −$2,182
- Taxable income
- $2,325
- Est. tax owed @ 24.0%
- −$558
- After-tax cash flow
- $2,823/yr
For passive investors: Depreciation is non-cash, so a rental often shows a tax loss while cash-flowing — sheltering income. Rental losses are passive: they offset passive income freely, and up to $25,000/yr can offset ordinary (W-2) income if you actively participate and your MAGI is under $100k (phasing out to $0 by $150k); unused losses carry forward. On sale, claimed depreciation is recaptured at up to 25%, and gains may owe capital-gains tax (a 1031 exchange can defer both). Figures are a year-1 estimate at your 24.0% rate — not tax advice; consult a CPA.
Condition & rehab AI · 30 photos
This property requires moderate renovations to improve its condition and appeal to buyers/renters. Updates to the kitchen and bathroom, along with exterior repairs, would significantly increase its value.
Repairs flagged
- Major kitchen appliances — outdated and worn
- Major bathroom fixtures — dated and in need of replacement
- Moderate exterior siding — moderate wear
- Moderate windows — some appear old and may need replacement
Value-add opportunities
- Both update kitchen appliances — modern appliances would attract more buyers/renters
- Both replace bathroom fixtures — new fixtures would improve both resale and rental appeal
- Both paint interior walls — fresh paint would improve the home's appearance and value
- Both replace carpet — new carpet would improve the home's appearance and value
- Both repair exterior siding — new siding would improve the home's appearance and value
- Both replace windows — new windows would improve the home's appearance and value
Renovation cost estimate screening
| Repair item | Severity | Est. cost |
|---|---|---|
| kitchen appliances · outdated and worn | Major | $15,000–50,000 |
| bathroom fixtures · dated and in need of replacement | Major | $15,000–50,000 |
| exterior siding · moderate wear | Moderate | $3,000–15,000 |
| windows · some appear old and may need replacement | Moderate | $3,000–15,000 |
| Total estimated repair cost · 4 items | $36,000–130,000 |
Value-add ROI direction
- Both update kitchen appliances — modern appliances would attract more buyers/renters ↑
- Both replace bathroom fixtures — new fixtures would improve both resale and rental appeal ↑
- Both paint interior walls — fresh paint would improve the home's appearance and value ↑
- Both replace carpet — new carpet would improve the home's appearance and value ↑
- Both repair exterior siding — new siding would improve the home's appearance and value ↑
- Both replace windows — new windows would improve the home's appearance and value ↑
ⓘ Cost ranges are severity-bucket heuristics (US national rule-of-thumb). Get contractor quotes + a written scope before underwriting a rehab budget.
Schools (NCES district)
- District
- Montgomery County
- NCES district ID
- 0102430
- Math proficiency
- 9% ▼ -21.00%
- Reading proficiency
- 31% ▼ -1.00%
- Median HH income
- $43,902
- Composite
- 17.24/100
- National rank
- #9093
- State rank
- #106 of 129 in AL
Livability — Montgomery
- Score
- 65/100
- State rank
- #138
- US rank
- #13416
Category grades
Schools grade is shown separately in the Schools card above.
Census & demographics
- Census place
- Montgomery, AL
- City population
- 175,913
- Population (ZIP)
- 15,549
Population outlook (Montgomery County) Hauer SSP2
- Today (2025)
- 224,008 people
- By 2030
- 221,460 · -1.1%
- By 2040
- 214,179 · -4.4%
- By 2050
- 204,912 · -8.5%
- By 2075
- 177,821 · -20.6%
- By 2100
- 145,134 · -35.2%
Race, ethnicity, and origin ACS 2023
- Neighborhood character
- Predominantly Black (82%)
- Race & ethnicity
- Black 82% White 10% Hispanic / Latino 6% Two or more races 2%
- Hispanic origin (detail)
- Mexican 4% Puerto Rican 1%
- Foreign-born
- 2% · Canada
- Languages at home
- 96% English-only · Spanish 3%
Political lean MEDSL · Montgomery
- 2024 margin
- Solid D (+30.7) · D 64.8% · R 34.1% · Other 1.1%
- 2008→2024 swing
- +11.5pp toward D · 2008: 19.2pp · 2024: 30.7pp
- All cycles
- 2024: D+30.7 2020: D+31.5 2016: D+26.2 2012: D+24.3 2008: D+19.2
Not yet ingested
- Civics
- —
Market trends
- HPI YoY
- ▲ 2.71%
- Current HPI
- 95.2405
- Rent YoY
- —
- Metro
- —
- State GDP YoY
- ▲ 2.94%
- F500 in state
- 4
Industry mix (Fortune 500 HQ in AL)
| Industry | F500 HQs | Revenue |
|---|---|---|
| Financial Services | 1 | $8B |
|
||
| Healthcare | 1 | $5B |
|
||
Price history
1 event — show timeline
- 2026-05-07 Listed $75,000 MAAR
Cash-flow waterfall
monthlySold comps — $/sqft
last 12 mo · ≤1 miLoading sold comps…