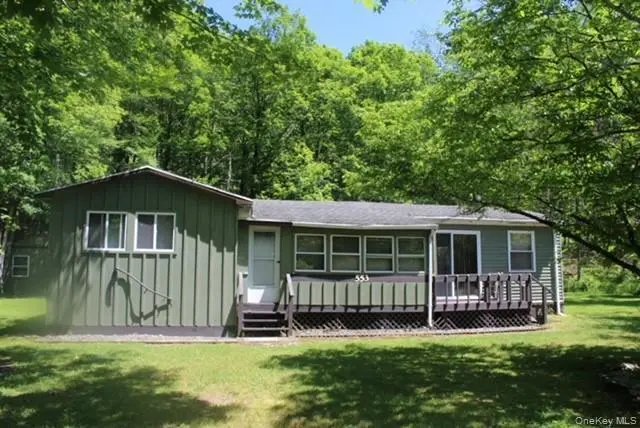
553 Friedenstein Rd · Hankins, NY
Flood risk 1/10 · Minimal
- FEMA flood zone
- X (unshaded)
- Chance of flooding over 30 yrs
- 0.0%
- Est. flood insurance / yr
- $507 – $1,088
Fire risk 1/10 · Minimal
- Est. fire insurance / yr
- $691 – $1,283
Heat risk 2/10 · Minimal
- Hot days now (above 91°F)
- 7 days/yr
- Hot days in 30 yrs
- 16 days/yr
Wind risk 2/10 · Minimal
- Chance of severe wind over 30 yrs
- 2.0%
Air-quality risk 2/10 · Minimal
- Unhealthy air days now
- 0 days/yr
- Unhealthy air days in 30 yrs
- 1 days/yr
Risk factors via First Street. Map © Google.
Why this score? — see what drove the D- grade
The composite is a weighted blend of 9 inputs, each scored 0–100. Each bar is that input's sub-score; the figure is the points it added to the 100-point composite (weight × sub-score).
- Cash flow +8.1/30.0
- ARV discount +7.5/15.0
- Appreciation +7.3/10.0
- Schools +4.0/10.0
- 1% rule +3.2/10.0
- Rent growth +2.5/5.0
- Livability +2.5/5.0
- Condition / age +2.5/5.0
- DSCR +2.1/10.0
$149,500
🖨 Deal sheet 📄 Offer letter ✓ Due diligence
Listing remarks MLS
Mixed condition mobile with large additions. Electric: Circuit Breaker, BasementDescription: Piers, LandFeatures: Mature Trees,
Key facts
- Short drive to lakes
- Low taxes
- Flat lawn
Tags
Property features AI
Exterior
- Parking: Driveway; No carport
- Utilities: Electric service (NYSEG); Septic tank; Cable available; Electricity connected; Propane; Sewer connected; Water connected
- Home design: Manufactured house; Single-family residence; One level
- Construction: Vinyl and wood siding
- Exterior features: Vinyl siding; Wood siding; Not waterfront
Interior
- Kitchen: Gas oven; Gas range
- Bedrooms: Bedroom on the first floor
- Bathrooms: 1 full bathroom
- Heating & cooling: Baseboard heating; Electric heating; Wood heating; No central air conditioning
- Interior features: First-floor bedroom; First-floor full bathroom; Galley-style kitchen; Walk-through kitchen; Dining area; Home office
- Laundry & utility: Gas water heater
Neighborhood map
What this means for you Summary
Snapshot
- This is a 3-bed/1.0-bath single-family listed at $150k.
Deal economics
- At list price, monthly cash flow is $-147 ($-2k/yr) — negative.
- To cash-flow at today's rent, offer at most $124k (17.3% below list).
- To meet the 1% rule (rent ≥ 1% of price), the offer needs to be $123k (17.8% below list).
- Recommended offer: $123k (17.8% below list) — sets the bar for 1% rule.
- Cap rate 5.1% vs local median 1.7% in Hankins — top-decile yield for the area; either an underpriced asset or a hidden risk that comps aren't pricing in. Stress-test before assuming the spread holds.
Location & tenants
- Location reads: area grade D — affects rentability + tenant quality, not the cash-flow math above.
- Sullivan West Central School District (rural): math 45% / reading 47% proficiency, ranked #436 of 590 in NY (top 74%) — families likely to look elsewhere, expect single-tenant / working-renter base with shorter leases.
- Zoned schools: Sullivan West Elementary School (math 41% / reading 48%, grade F, #1,277 of 2,108 statewide, top 64%, 571 students, 37% FRL); Sullivan West High School At Lake Huntington (math 52% / reading 47%, grade D, #974 of 1,100 statewide, top 91%, 477 students, 39% FRL).
- Market conditions: 12 active listings in the ZIP; 739 units permitted in Sullivan County in 2024 (5 in 5+ unit buildings).
Forward outlook
- In year one you build about $8k of equity ($1k loan paydown + $7k appreciation (4.6% local appreciation)).
- Sullivan County population projected at -24% by 2050 — secular population decline; favor cash flow + early exit over multi-decade hold.
- By year 5, paydown + projected appreciation supports a ~$34k cash-out refi (75% LTV) — recoverable capital for the next deal without selling this one.
Negotiation context
- Only 7 days on market — expect competitive offers; lowballing is unlikely to land.
- 2 sale attempts since 10y ago with the ask held roughly flat each time — persistent listings suggest the price (not the market) is what's stuck; bring a comps-based counter.
- Current owner paid $27k; list at $150k implies a 462% gain — meaningful room to come down on a strong offer.
Questions for the listing agent
- What do current leases actually rent for vs. the listed asking? Can we see a recent rent roll and the last 12 months of T-12 income?
- Is there a deadline driving the sale (1031 exchange, divorce, estate, relocation)? That informs how much negotiation room exists.
- The area grade is low — what's the realistic commute time and amenity access for the typical tenant pool here? Any planned neighborhood developments (good or bad) we should know about?
- What's the average days-on-market for RENTAL listings here right now (not sales)? A rising rental-DOM trend means longer vacancies and softer asking-rent achievability than the comps imply.
- What's the recent tenant-quality profile in this submarket — average credit score on applications, eviction rate, late-payment / NSF rate, and stable-employment percentage? A property-management company in the area should have these aggregated.
- How much new for-sale + rental construction is in the pipeline within 1–3 miles? Heavy new supply typically softens prices + rents 12–24 months out; constrained supply supports both.
Investment metrics
- 1% rule
- 0.82% ✗
- Cap rate
- 5.12%
- Cash-on-cash
- -4.20%
- DSCR
- 0.81
- GRM
- 10.1
CMA / ARV
- ARV (on-the-fly)
- $53,907
- Comps found
- 1
Show comp detail 1 sale within ~0.75 mi
| Address | Dist | Beds/Ba | Sqft | Sold | Price | $/sf | Match |
|---|---|---|---|---|---|---|---|
| 59 Raspberry Park Rd | 0.52mi | 3/1.0 | 1,080 (+2%) | 20mo | $55,000 | $51 | 55 |
Match score weights: distance 35% · size 25% · config 20% · recency 20%. Top-matched comps best support the ARV.
Projected returns pro-forma
4.61% appreciation · 3.0% rent growth · sell at horizon
- IRR
- 8.3%
- Equity multiple
- 1.52×
- Total profit
- $21,888
- Equity at exit
- $81,209
- IRR
- 10.2%
- Equity multiple
- 2.82×
- Total profit
- $76,038
- Equity at exit
- $137,335
Cash invested: $41,860 (down + closing). Projections, not guarantees.
Landlord ↔ Tenant lean methodology
- Overall (STATE)
- 15 Strongly Tenant-Friendly
- State New York
- 15 Strongly Tenant-Friendly · D+10
- County
- — inherits STATE
- City
- — inherits STATE
ZIP-level market 12760
- Home prices YoY
- 0.9%
- Active inventory
- 12
- Price-to-rent
- 10.1×
Monthly cashflow live
- Estimated rent
- $1,229 medium interval (Pro) →
- Mortgage (P&I)
- −$784
- Tax from tax record
- −$271 /mo · $3,251/yr
- Insurance
- −$62
- HOA
- −$0
- Vacancy / Maint / Mgmt
- −$258
- Net cashflow
- $-147
Break-even live
UW: 25.0% down · 7.5% · 30yr · 1.5% tax · 5.0% vac · 8.0% maint · 8.0% mgmt
Financing live
Cash to close
- Down payment
- $37,375
- Closing costs
- $4,485
- Reserves months
- —
- Total cash needed
- —
Loan-product check · same deal, 3 products live
Conventional
25% down · 7.5% · 30yr
- Down + closing
- —
- Monthly P&I
- —
- Monthly cashflow
- —
- DSCR
- —
- Eligible?
- —
Personal DTI + credit; lowest rate.
DSCR
20% down · 8.5% · 30yr
- Down + closing
- —
- Monthly P&I
- —
- Monthly cashflow
- —
- DSCR
- —
- Eligible?
- —
No personal income docs; deal must DSCR.
Hard money
10% down · 12.0% · 12mo
- Down + closing
- —
- Monthly P&I
- —
- Monthly cashflow
- —
- DSCR
- —
- Eligible?
- —
Short-term bridge; refi at stabilization.
Listing history 7 events
-
2026-06-18days on market $149,500 Active 7 DOM
-
2026-06-17days on market $149,500 Active 6 DOM
-
2026-06-16days on market $149,500 Active 5 DOM
-
2026-06-15days on market $149,500 Active 4 DOM
-
2026-06-13days on market $149,500 Active 2 DOM
-
2026-06-12remarks 154-char remark
-
2026-06-12$149,500 Active 1 DOM
ⓘ Source: listings_history table (triggers on properties + properties_extension) + one-shot
backfill from property_details.listing_events for pre-trigger history.
Tax reassessment forecast NY · Partial reset (capped growth)
- Current annual tax
- $3,251 · $271/mo
- Projected year-2 tax
- $3,251 · $271/mo
- Expected delta
- $0/yr ($0/mo · 0.0%)
ⓘ Screening estimate from a state-policy table — verify with the county assessor before closing.
Climate risk First Street
- Flood 1/10 Low FEMA zone X (unshaded) · 0% chance over 30 yrs
- Wildfire 1/10 Low
- Heat 2/10 Low 7 d/yr ≥91°F today · 16 d/yr by 30 yrs out
- Wind 2/10 Low 2% chance of damaging wind over 30 yrs
- Air quality 2/10 Low 0 unhealthy d/yr today · 1 by 30 yrs out
Nearby sold comps map
Loading sold comps map…
Walkable amenities ~0.75 mi
Loading nearby amenities…
Taxation est. · year 1
- Rental income
- $14,743
- − Mortgage interest
- −$8,374
- − Property taxes
- −$3,251
- − Insurance
- −$748
- − Repairs & maintenance
- −$1,179
- − Management
- −$1,179
- − Depreciation
- −$4,349
- Taxable loss
- −$4,338
- Est. tax savings @ 24.0%
- +$1,041
- After-tax cash flow
- $-718/yr
For passive investors: Depreciation is non-cash, so a rental often shows a tax loss while cash-flowing — sheltering income. Rental losses are passive: they offset passive income freely, and up to $25,000/yr can offset ordinary (W-2) income if you actively participate and your MAGI is under $100k (phasing out to $0 by $150k); unused losses carry forward. On sale, claimed depreciation is recaptured at up to 25%, and gains may owe capital-gains tax (a 1031 exchange can defer both). Figures are a year-1 estimate at your 24.0% rate — not tax advice; consult a CPA.
Schools (NCES district)
- District
- Sullivan West Central School District
- NCES district ID
- 3600023
- Math proficiency
- 45% ▼ -7.00%
- Reading proficiency
- 47% ▼ -2.00%
- Median HH income
- $56,078
- Composite
- 40.05/100
- National rank
- #3817
- State rank
- #436 of 590 in NY
Livability — Hankins
No livability data for this city. (Only ~50 U.S. cities are tracked.)
Census & demographics
- Population (ZIP)
- 337
Population outlook (Sullivan County) Hauer SSP2
- Today (2025)
- 68,974 people
- By 2030
- 65,609 · -4.9%
- By 2040
- 58,878 · -14.6%
- By 2050
- 52,500 · -23.9%
- By 2075
- 39,941 · -42.1%
- By 2100
- 28,880 · -58.1%
Race, ethnicity, and origin ACS 2023
- Neighborhood character
- Predominantly White (78%)
- Race & ethnicity
- White 78% Hispanic / Latino 18% Asian 4%
- Hispanic origin (detail)
- Common ancestry
- Scottish 7% Portuguese 4% Lithuanian 4%
- Foreign-born
- 4% · China
- Languages at home
- 99% English-only · Chinese 1%
Political lean MEDSL · Sullivan
- 2024 margin
- R (+16.7) · D 41.6% · R 58.4%
- 2008→2024 swing
- -26.2pp toward R · 2008: 9.5pp · 2024: -16.7pp
- All cycles
- 2024: R+16.7 2020: R+9.2 2016: R+13.7 2012: D+10.4 2008: D+9.5
Not yet ingested
- Civics
- —
Market trends
- HPI YoY
- ▲ 4.61%
- Current HPI
- 526.7442
- Rent YoY
- —
- Metro
- —
- State GDP YoY
- ▲ 2.60%
- F500 in state
- 92
Industry mix (Fortune 500 HQ in NY)
| Industry | F500 HQs | Revenue |
|---|---|---|
| Financial Services | 10 | $950B |
|
||
| Consumer Goods | 9 | $162B |
|
||
| Insurance | 4 | $225B |
|
||
| Telecommunications | 2 | $144B |
|
||
| Pharmaceuticals | 2 | $112B |
|
||
| Media / Entertainment | 2 | $69B |
|
||
Price history
+433.9% since first listed3 events — show timeline
- 2026-06-11 Listed $149,500 OneKey® MLS as Distributed by MLS Grid
- 2016-12-16 Sold (MLS) $26,600 HGMLS
- 2016-07-01 Listed $28,000 HGMLS
Property tax history
+1.8%/yrLatest (2025): $3,251 · -0.9% YoY. Source: county tax records.
Cash-flow waterfall
monthlySold comps — $/sqft
last 12 mo · ≤1 miLoading sold comps…