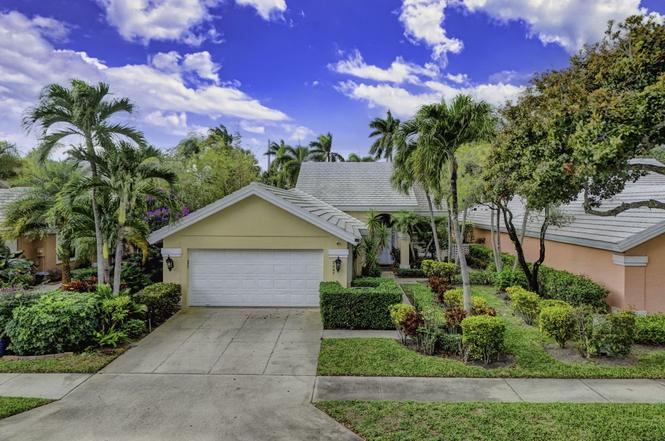
2347 Saratoga Bay Dr · West Palm Beach, FL
Flood risk 1/10 · Minimal
- FEMA flood zone
- X (unshaded)
- Chance of flooding over 30 yrs
- 0.0%
- Est. flood insurance / yr
- $507 – $1,088
Fire risk 1/10 · Minimal
- Est. fire insurance / yr
- $947 – $1,759
Heat risk 9/10 · Severe
- Hot days now (above 106°F)
- 3 days/yr
- Hot days in 30 yrs
- 11 days/yr
Wind risk 10/10 · Severe
- Chance of severe wind over 30 yrs
- 99.0%
Air-quality risk 2/10 · Minimal
- Unhealthy air days now
- 1 days/yr
- Unhealthy air days in 30 yrs
- 1 days/yr
Risk factors via First Street. Map © Google.
Why this score? — see what drove the D+ grade
The composite is a weighted blend of 9 inputs, each scored 0–100. Each bar is that input's sub-score; the figure is the points it added to the 100-point composite (weight × sub-score).
- ARV discount +15.0/15.0
- Cash flow +12.4/30.0
- Schools +4.3/10.0
- Livability +4.1/5.0
- 1% rule +3.9/10.0
- DSCR +3.7/10.0
- Rent growth +2.5/5.0
- Condition / age +2.5/5.0
- Appreciation +0.0/10.0
$571,000
🖨 Deal sheet (PDF) 📄 Offer letter ✓ Due diligence
Listing remarks
Enjoy South Florida living from this lovely Divosta-built home! Privately nestled and tucked away within the golf gated community of Saratoga Bay, this expanded model offers 3 bedrooms, 2 baths, nearly 2,300 SF of living area, vaulted ceilings, newer A/C (2024), roof (2018) and accordion shutters throughout. Spacious split floor plan boasts vaulted ceilings, ceramic tile in main living areas, expanded lanai, perfect for entertaining, and allows for tons of options to utilize this additional space. Updated kitchen, with cozy breakfast area, equipped with custom wood cabinetry, granite counter tops, ceramic tile backsplash, and stainless-steel appliances. Generous primary suite features lamin
Key facts
- Expanded model
- Updated kitchen
- Granite counter tops
Tags
Property features AI
Finance
- Financial info: Pets allowed with possible breed restrictions
- HOA & community: Community amenities include pool, tennis courts, pickleball courts, playground, dog park, jogging path, trails, picnic area, sidewalks and street lights; Monthly HOA fee (approx.): $516.66; HOA covers cable TV, grounds maintenance, security, sewer, trash, water and common area upkeep
Exterior
- Parking: Attached 2-car garage; Two covered parking spaces
- Security: Owned security system; Gated community (no guard)
- Utilities: Public water; Public sewer; Three-phase electric; Cable available
- Home design: Single-family home; Multi/split levels; One story; Faces northeast; Resale property
- Construction: Built by DiVosta Homes; CBS construction; Concrete, flat and tile roof
- Exterior features: Open patio; Patio
Interior
- Kitchen: Dishwasher; Electric range; Microwave; Refrigerator
- Bedrooms: Three main-level bedrooms
- Flooring: Laminate
- Bathrooms: Two full bathrooms (both on main level)
- Heating & cooling: Central electric heating; Central electric cooling; Ceiling fans
- Interior features: Cathedral ceilings; Vaulted ceilings; Entrance foyer; Walk-in closets; Split bedroom layout; Blinds
- Laundry & utility: Laundry inside in a laundry closet; Electric water heater
Neighborhood map
What this means for you Summary
Snapshot
- This is a 3-bed/2.0-bath single-family listed at $571k.
Deal economics
- At list price, monthly cash flow is $-92 ($-1k/yr) — negative.
- To cash-flow at today's rent, offer at most $555k (2.8% below list).
- To meet the 1% rule (rent ≥ 1% of price), the offer needs to be $507k (11.2% below list).
- Recommended offer: $507k (11.2% below list) — sets the bar for 1% rule.
- Cap rate 6.1% vs local median 3.8% in West Palm Beach — top-decile yield for the area; either an underpriced asset or a hidden risk that comps aren't pricing in. Stress-test before assuming the spread holds.
Location & tenants
- Location reads 82/100 on livability (#75 in FL, #1,255 nationally) — a professional / high-income tenant draw. Strengths: commute A+, housing A+, health & safety A+; Watch: employment C-, crime F.
- Palm Beach (suburban): math 46% / reading 53% proficiency, ranked #34 of 73 in FL (top 47%) — families likely to look elsewhere, expect single-tenant / working-renter base with shorter leases.
- Zoned schools: Seminole Trails Elementary School (math 26% / reading 36%, grade F, #1,854 of 2,144 statewide, top 87%, 650 students, 73% FRL); Bear Lakes Middle School (math 19% / reading 33%, grade F, #506 of 571 statewide, top 89%, 842 students, 74% FRL); Palm Beach Lakes High School (math 17% / reading 26%, grade F, #546 of 667 statewide, top 82%, 2,688 students, 70% FRL) — zoned schools average 72% FRL vs 52% district-wide (20 pts higher); higher-poverty schools than district average — tighter screening recommended.
- Zoned-school proficiency averages 26% at this address vs 50% district-wide (-23 pts) — the specific schools serving this property underperform the Palm Beach average; the district grade overstates school quality for this exact location.
- Market conditions: Rents soft (-0.1%/yr); 194 active listings in the ZIP; 18 comparable units currently listed for rent nearby; rentals at typical pace (median 26d on market — plan ~3-4 weeks tenant-placement turnaround); 3,974 units permitted in Palm Beach County in 2024 (1,012 in 5+ unit buildings).
- At $5,069/mo this rent would consume 91% of the median local household income ($67k/yr) (locally 1333% of renters already pay >50% of income on rent) — very limited rent-growth headroom before tenants either downsize or default.
Forward outlook
- Local home prices are declining (-3.0%/yr); year-one equity from $4k of loan paydown is wiped out by about $17k of value loss. Plan a longer hold.
- Palm Beach County population projected at +30% by 2050 — long-run rental-demand tailwind backs the buy-and-hold thesis.
Negotiation context
- It's been on market 94 days — a 9% lower offer ($520k) is reasonable based on typical stale-listing flexibility.
- 8 sale attempts since 28y ago; this cycle's ask has dropped $44k (7%) from the opening price — seller is motivated, your offer sets the floor, not the list.
- Current owner paid $403k; 42% above their basis — modest negotiation headroom, anchor on the comps not their cost.
Risks & watch-outs
- Climate carrying-cost: severe wind risk, 99% chance of damaging wind over 30y; extreme-heat days projected 3→11/yr by 2055 (HVAC capex compounding) — expect insurance premiums to compound above CPI over the hold.
Questions for the listing agent
- What do current leases actually rent for vs. the listed asking? Can we see a recent rent roll and the last 12 months of T-12 income?
- It's been on market 94 days. Have you received any prior offers? Is the seller open to a 11% concession, seller financing, or rate buy-down credit?
- What does the HOA fee cover, when was the last increase, and are there any pending special assessments or reserve-fund shortfalls?
- Why hasn't it sold? Are there any deal-killer items the seller is aware of (foundation, flood, title, zoning, code violations)?
- Is there a deadline driving the sale (1031 exchange, divorce, estate, relocation)? That informs how much negotiation room exists.
- Crime grade is F in this area — have there been break-ins, vandalism, or insurance claims at this property in the last 3 years? What carrier currently insures it and at what premium?
- The area grade is low — what's the realistic commute time and amenity access for the typical tenant pool here? Any planned neighborhood developments (good or bad) we should know about?
- What's the average days-on-market for RENTAL listings here right now (not sales)? A rising rental-DOM trend means longer vacancies and softer asking-rent achievability than the comps imply.
- What's the recent tenant-quality profile in this submarket — average credit score on applications, eviction rate, late-payment / NSF rate, and stable-employment percentage? A property-management company in the area should have these aggregated.
- How much new for-sale + rental construction is in the pipeline within 1–3 miles? Heavy new supply typically softens prices + rents 12–24 months out; constrained supply supports both.
Investment metrics
- 1% rule
- 0.89% ✗
- Cap rate
- 6.10%
- Cash-on-cash
- -0.69%
- DSCR
- 0.97
- GRM
- 9.4
CMA / ARV
- ARV (on-the-fly)
- $685,842
- Comps found
- 1
Show comp detail 1 sale within ~0.75 mi
| Address | Dist | Beds/Ba | Sqft | Sold | Price | $/sf | Match |
|---|---|---|---|---|---|---|---|
| 2368 Saratoga Bay Dr | 0.15mi | 3/2.0 | 2,271 (0%) | 5mo | $685,000 | $302 | 89 |
Match score weights: distance 35% · size 25% · config 20% · recency 20%. Top-matched comps best support the ARV.
Projected returns pro-forma
-3.0% appreciation · 0.0% rent growth · sell at horizon
- IRR
- -21.0%
- Equity multiple
- 0.29×
- Total profit
- $-113,074
- Equity at exit
- $85,138
- IRR
- -23.8%
- Equity multiple
- -0.02×
- Total profit
- $-162,733
- Equity at exit
- $49,370
Cash invested: $159,880 (down + closing). Projections, not guarantees.
Landlord ↔ Tenant lean methodology
- Overall (STATE)
- 87 Strongly Landlord-Friendly
- State Florida
- 87 Strongly Landlord-Friendly · R+3
- County
- — inherits STATE
- City
- — inherits STATE
ZIP-level market 33409
- Home prices YoY
- -25.6%
- Rents YoY
- -0.1%
- Active inventory
- 194
- Price-to-rent
- 9.4×
Monthly cashflow live
- Estimated rent
- $5,069 high interval (Pro) →
- Mortgage (P&I)
- −$2,994
- Tax from tax record
- −$348 /mo · $4,178/yr
- Insurance
- −$238
- HOA
- −$516
- Vacancy / Maint / Mgmt
- −$1,064
- Net cashflow
- $-92
Break-even live
Sensitivity live
| Price | -10% $231 | -5% $70 | +0% $-92 | +5% $-254 | +10% $-415 |
|---|---|---|---|---|---|
| Rent | -10% $-492 | -5% $-292 | +0% $-92 | +5% $108 | +10% $308 |
| Rate | -1.0pp $196 | -0.5pp $53 | base $-92 | +0.5pp $-240 | +1.0pp $-391 |
UW: 25.0% down · 7.5% · 30yr · 1.5% tax · 5.0% vac · 8.0% maint · 8.0% mgmt
Financing live
Cash to close
- Down payment
- $142,750
- Closing costs
- $17,130
- Reserves months
- —
- Total cash needed
- —
Loan-product check · same deal, 3 products live
Conventional
25% down · 7.5% · 30yr
- Down + closing
- —
- Monthly P&I
- —
- Monthly cashflow
- —
- DSCR
- —
- Eligible?
- —
Personal DTI + credit; lowest rate.
DSCR
20% down · 8.5% · 30yr
- Down + closing
- —
- Monthly P&I
- —
- Monthly cashflow
- —
- DSCR
- —
- Eligible?
- —
No personal income docs; deal must DSCR.
Hard money
10% down · 12.0% · 12mo
- Down + closing
- —
- Monthly P&I
- —
- Monthly cashflow
- —
- DSCR
- —
- Eligible?
- —
Short-term bridge; refi at stabilization.
Rent comps 18 comps
| Address | Beds | Baths | Sqft | Rent | $/sqft | DOM | Units | Dist |
|---|---|---|---|---|---|---|---|---|
| 2076 Cezanne Rd West Palm Beach, FL | 3.0 | 2.0 | 2376 | $4,850 | $2.04 | 26d | 1 | 0.34mi |
| 2067 Cezanne Rd West Palm Beach, FL | 4.0 | 2.5 | 2991 | $4,950 | $1.65 | 26d | 1 | 0.38mi |
| 4400 Portofino Way West Palm Beach, FL | 1.0–3.0 | 1.0–2.0 | 1222 | $3,108 | $2.54 | 19d | 60 | 0.46mi |
| 2055 Regents Blvd West Palm Beach, FL | 3.0 | 3.0 | 2166 | $6,900 | $3.19 | 26d | 1 | 0.55mi |
| 3190 El Camino Real West Palm Beach, FL | 4.0 | 2.5 | 2742 | $4,700 | $1.71 | 23d | 1 | 0.63mi |
| 2938 Gin Berry Way West Palm Beach, FL | 3.0 | 3.5 | 2482 | $8,500 | $3.42 | 26d | 1 | 0.83mi |
| 4543 Tara Cove Way West Palm Beach, FL | 3.0 | 2.5 | 1807 | $3,000 | $1.66 | 0d | 1 | 0.84mi |
| 2451 Presidential Way Unit A West Palm Beach, FL | 3.0 | 2.5 | 2782 | $6,500 | $2.34 | 26d | 1 | 0.84mi |
| 2480 Presidential Way #902 West Palm Beach, FL | 2.0 | 2.0 | 1855 | $4,650 | $2.51 | 7d | 1 | 0.85mi |
| 2480 Presidential Way #1903 West Palm Beach, FL | 2.0 | 2.0 | 1855 | $4,650 | $2.51 | 26d | 1 | 0.85mi |
| 2828 Gin Berry Way West Palm Beach, FL | 3.0 | 3.5 | 3258 | $13,500 | $4.14 | 26d | 1 | 0.86mi |
| 2929 Gin Berry Way West Palm Beach, FL | 3.0 | 3.5 | 2555 | $9,500 | $3.72 | 26d | 1 | 0.86mi |
| 2435 Presidential Way Unit G West Palm Beach, FL | 3.0 | 2.5 | 2519 | $6,500 | $2.58 | 19d | 1 | 0.87mi |
| 2450 Presidential Way #7 West Palm Beach, FL | 2.0 | 2.0 | 1855 | $4,700 | $2.53 | 26d | 1 | 0.89mi |
| 2450 Presidential Way #208 West Palm Beach, FL | 3.0 | 3.0 | 2250 | $3,900 | $1.73 | 26d | 1 | 0.89mi |
| 2450 Presidential Way #7 West Palm Beach, FL | 2.0 | 2.0 | 1855 | $4,700 | $2.53 | 4d | 1 | 0.89mi |
| 1640 Presidential Way #501 West Palm Beach, FL | 4.0 | 3.5 | 2821 | $4,900 | $1.74 | 26d | 1 | 1.31mi |
| 1225 Avondale Ln West Palm Beach, FL | 4.0 | 2.5 | 2941 | $5,600 | $1.90 | 16d | 1 | 1.33mi |
HOA detail
- Monthly dues
- $516 · $6,192/yr
- Likely covers
- security
Listing history 27 events
-
2026-05-01status Pending
-
2026-04-10price $571,000
-
2026-02-19price $599,000
-
2026-01-27$615,000 Active
-
2014-10-30historical
-
2013-09-22historical
-
2007-01-05soldstatus $403,000
-
2007-01-02soldstatus $403,000
-
2006-11-27historical
-
2006-05-04$435,000
-
2006-01-09$435,000
-
2004-09-24soldstatus $290,000
-
2004-09-22soldstatus $290,000
-
2004-08-09historical
-
2004-06-22$300,000
-
2004-04-28soldstatus $280,000
-
2004-04-24historical
-
2004-02-25$309,900
-
2002-12-12soldstatus $185,500
-
2002-11-26soldstatus $185,500
-
2002-11-08historical
-
2001-10-08$205,000
-
2001-10-08$196,800
-
1998-08-03soldstatus $155,000
-
1998-07-28soldstatus $155,000
-
1998-07-06historical
-
1998-03-19$158,900
ⓘ Source: listings_history table (triggers on properties + properties_extension) + one-shot
backfill from property_details.listing_events for pre-trigger history.
Tax reassessment forecast FL · Resets to sale price
- Current annual tax
- $4,178 · $348/mo
- Projected year-2 tax
- $4,739 · $395/mo
- Expected delta
- +$561/yr (+$47/mo · 13.4%)
ⓘ Screening estimate from a state-policy table — verify with the county assessor before closing.
Climate risk First Street
- Flood 1/10 Low FEMA zone X (unshaded) · 0% chance over 30 yrs
- Wildfire 1/10 Low
- Heat 9/10 Extreme 3 d/yr ≥106°F today · 11 d/yr by 30 yrs out
- Wind 10/10 Extreme 99% chance of damaging wind over 30 yrs
- Air quality 2/10 Low 1 unhealthy d/yr today · 1 by 30 yrs out
Nearby sold comps map
Loading sold comps map…
Walkable amenities ~0.75 mi
Loading nearby amenities…
Taxation est. · year 1
- Rental income
- $60,827
- − Mortgage interest
- −$31,985
- − Property taxes
- −$4,178
- − Insurance
- −$2,855
- − Repairs & maintenance
- −$4,866
- − Management
- −$4,866
- − HOA
- −$6,192
- − Depreciation
- −$16,611
- Taxable loss
- −$10,726
- Est. tax savings @ 24.0%
- +$2,574
- After-tax cash flow
- $1,470/yr
For passive investors: Depreciation is non-cash, so a rental often shows a tax loss while cash-flowing — sheltering income. Rental losses are passive: they offset passive income freely, and up to $25,000/yr can offset ordinary (W-2) income if you actively participate and your MAGI is under $100k (phasing out to $0 by $150k); unused losses carry forward. On sale, claimed depreciation is recaptured at up to 25%, and gains may owe capital-gains tax (a 1031 exchange can defer both). Figures are a year-1 estimate at your 24.0% rate — not tax advice; consult a CPA.
Schools (NCES district)
- District
- Palm Beach
- NCES district ID
- 1201500
- Math proficiency
- 46% ▼ -16.00%
- Reading proficiency
- 53% ▼ -4.00%
- Median HH income
- $53,943
- Composite
- 42.72/100
- National rank
- #3160
- State rank
- #34 of 73 in FL
Livability — West Palm Beach
- Score
- 82/100
- State rank
- #75
- US rank
- #1255
Category grades
Schools grade is shown separately in the Schools card above.
Census & demographics
- Census place
- West Palm Beach, FL
- County
- Palm Beach County · 1,438,312 people
- City population
- 222,012
- Metro
- Miami-Fort Lauderdale-Pompano Beach, FL
- Population (ZIP)
- 33,489
- Household income
- $67,073
- Rent vs Own
- Severe rent burden
- 1333.0
Population outlook (Palm Beach County) Hauer SSP2
- Today (2025)
- 1,637,487 people
- By 2030
- 1,743,255 · +6.5%
- By 2040
- 1,948,712 · +19.0%
- By 2050
- 2,132,979 · +30.3%
- By 2075
- 2,530,027 · +54.5%
- By 2100
- 2,706,979 · +65.3%
Race, ethnicity, and origin ACS 2023
- Neighborhood character
- Highly diverse neighborhood (Simpson 0.70)
- Race & ethnicity
- Hispanic / Latino 36% Black 31% White 27% Two or more races 21% Asian 2%
- Hispanic origin (detail)
- Mexican 4% Puerto Rican 4% Cuban 8% Dominican 1%
- Common ancestry
- Hispanic 8% Romanian 1% Lithuanian 1%
- Foreign-born
- 34% · Canada, Jamaica
- Languages at home
- 55% English-only · Spanish 30% French/Haitian/Cajun 10% Other Indo-European 2%
Political lean MEDSL · Palm Beach
- 2024 margin
- Toss-up / Even · D 50.0% · R 49.2%
- 2008→2024 swing
- -22.1pp toward R · 2008: 22.9pp · 2024: 0.8pp
- All cycles
- 2024: D+0.8 2020: D+12.8 2016: D+15.3 2012: D+17.0 2008: D+22.9
Not yet ingested
- Civics
- —
Market trends
- HPI YoY
- ▼ -128.54%
- Current HPI
- 374.2506
- Rent YoY
- ▼ -0.15%
- Metro
- Miami-Fort Lauderdale-Pompano Beach, FL
- State GDP YoY
- ▲ 3.28%
- F500 in state
- 36
Industry mix (Fortune 500 HQ in FL)
| Industry | F500 HQs | Revenue |
|---|---|---|
| Industrial Technology | 2 | $29B |
|
||
| Insurance | 2 | $17B |
|
||
| Retail | 1 | $60B |
|
||
| Technology Distribution | 1 | $58B |
|
||
| Homebuilding | 1 | $35B |
|
||
| Technology Manufacturing | 1 | $35B |
|
||
Price history
+259.3% since first listed27 events — show timeline
- 2026-05-01 Pending — Beaches MLS
- 2026-04-10 Price Changed $571,000 Beaches MLS
- 2026-02-19 Price Changed $599,000 Beaches MLS
- 2026-01-27 Listed $615,000 Beaches MLS
- 2014-10-30 Listing Removed — Beaches MLS
- 2013-09-22 Listing Removed — Beaches MLS
- 2007-01-05 Sold (MLS) $403,000 Beaches MLS
- 2007-01-02 Sold (Public Records) $403,000 Public Records
- 2006-11-27 Listing Removed — Beaches MLS
- 2006-05-04 Listed $435,000 Beaches MLS
- 2006-01-09 Listed $435,000 Beaches MLS
- 2004-09-24 Sold (Public Records) $290,000 Public Records
- 2004-09-22 Sold (MLS) $290,000 Beaches MLS
- 2004-08-09 Listing Removed — Beaches MLS
- 2004-06-22 Listed $300,000 Beaches MLS
- 2004-04-28 Sold (Public Records) $280,000 Public Records
- 2004-04-24 Listing Removed — Beaches MLS
- 2004-02-25 Listed $309,900 Beaches MLS
- 2002-12-12 Sold (Public Records) $185,500 Public Records
- 2002-11-26 Sold (MLS) $185,500 Beaches MLS
- 2002-11-08 Listing Removed — Beaches MLS
- 2001-10-08 Listed $196,800 Beaches MLS
- 2001-10-08 Listed $205,000 Beaches MLS
- 1998-08-03 Sold (Public Records) $155,000 Public Records
- 1998-07-28 Sold (MLS) $155,000 Beaches MLS
- 1998-07-06 Listing Removed — Beaches MLS
- 1998-03-19 Listed $158,900 Beaches MLS
Property tax history
+1.3%/yrLatest (2025): $4,178 · +3.6% YoY. Source: county tax records.
Cash-flow waterfall
monthlySold comps — $/sqft
last 12 mo · ≤1 miLoading sold comps…