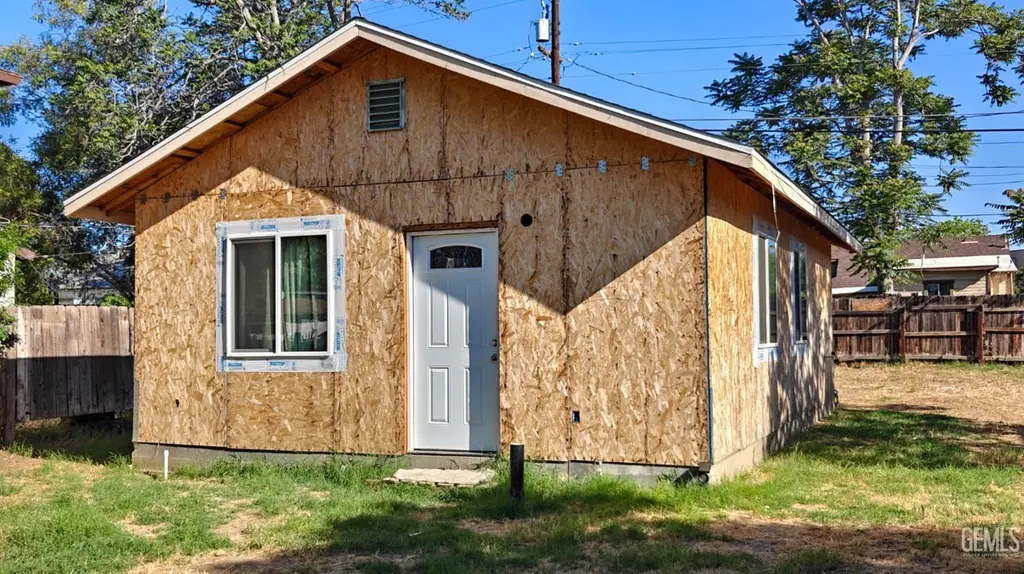
118 Hughes Ave · Oildale, CA
Flood risk 1/10 · Minimal
- FEMA flood zone
- X (unshaded)
- Chance of flooding over 30 yrs
- 0.0%
- Est. flood insurance / yr
- $507 – $1,088
Fire risk 5/10 · Moderate
- Est. fire insurance / yr
- $659 – $1,223
Heat risk 8/10 · Major
- Hot days now (above 105°F)
- 7 days/yr
- Hot days in 30 yrs
- 17 days/yr
Wind risk 1/10 · Minimal
- Chance of severe wind over 30 yrs
- —
Air-quality risk 10/10 · Severe
- Unhealthy air days now
- 39 days/yr
- Unhealthy air days in 30 yrs
- 45 days/yr
Risk factors via First Street. Map © Google.
Why this score? — see what drove the D+ grade
The composite is a weighted blend of 9 inputs, each scored 0–100. Each bar is that input's sub-score; the figure is the points it added to the 100-point composite (weight × sub-score).
- ARV discount +15.0/15.0
- Cash flow +12.9/30.0
- DSCR +3.9/10.0
- 1% rule +3.4/10.0
- Rent growth +3.1/5.0
- Livability +2.9/5.0
- Appreciation +2.7/10.0
- Condition / age +2.5/5.0
- Schools +2.1/10.0
$170,000
🖨 Deal sheet 📄 Offer letter ✓ Due diligence
Listing remarks MLS
Great investment opportunity! This partially completed 600sq. ft. 2-bedroom, 1-bath home is over 60% finished and ready for the right buyer to bring it across the finish line. Major improvements are already completed, including new windows, new roof, electrical, and plumbing. The home also features a dedicated laundry room and sits on a large lot with plenty of room to expand. Even better, approved blueprints and permits are already in place, giving you a head start on completing the project. All that's left are the final touches to make this property truly shine.
Key facts
- Large lot
- Permits
- New roof
Tags
Neighborhood map
What this means for you Summary
Snapshot
- This is a 2-bed/1.0-bath other listed at $170k.
Deal economics
- At list price, monthly cash flow is $-13 ($-156/yr) — negative.
- To cash-flow at today's rent, offer at most $168k (1.4% below list).
- To meet the 1% rule (rent ≥ 1% of price), the offer needs to be $142k (16.4% below list).
- Recommended offer: $142k (16.4% below list) — sets the bar for 1% rule.
- Cap rate 6.2% vs local median 3.9% in Oildale — top-decile yield for the area; either an underpriced asset or a hidden risk that comps aren't pricing in. Stress-test before assuming the spread holds.
Location & tenants
- Location reads 58/100 on livability (#680 in CA) — a working-class tenant base; expect higher turnover. Strengths: housing A+, schools B+; Watch: crime F, amenities F, commute F.
- Standard Elementary (suburban): math 16% / reading 27% proficiency, ranked #1,227 of 1,400 in CA (top 88%) — low school quality limits family demand, transient renter base, plan for 1-2y turnover; 66% free/reduced lunch — lower-income household profile, screen leases tightly.
- Market conditions: Rents rising (+2.2%/yr); 307 active listings in the ZIP; 38 comparable units currently listed for rent nearby; rentals leasing fast (median 3d on market — plan ~1-2 weeks tenant-placement turnaround); 3,244 units permitted in Kern County in 2024 (73 in 5+ unit buildings).
Forward outlook
- Local home prices are declining (-3.0%/yr); year-one equity from $1k of loan paydown is wiped out by about $5k of value loss. Plan a longer hold.
- Kern County population projected at +17% by 2050 — long-run rental-demand tailwind backs the buy-and-hold thesis.
Negotiation context
- It's been on market 76 days — a 6% lower offer ($160k) is reasonable based on typical stale-listing flexibility.
- 5 sale attempts since 7y ago with the ask held roughly flat each time — persistent listings suggest the price (not the market) is what's stuck; bring a comps-based counter.
- Current owner paid $135k; 26% above their basis — modest negotiation headroom, anchor on the comps not their cost.
Risks & watch-outs
- Climate carrying-cost: moderate wildfire risk; extreme-heat days projected 7→17/yr by 2055 (HVAC capex compounding) — expect insurance premiums to compound above CPI over the hold.
Questions for the listing agent
- What do current leases actually rent for vs. the listed asking? Can we see a recent rent roll and the last 12 months of T-12 income?
- It's been on market 76 days. Have you received any prior offers? Is the seller open to a 16% concession, seller financing, or rate buy-down credit?
- Why hasn't it sold? Are there any deal-killer items the seller is aware of (foundation, flood, title, zoning, code violations)?
- Is there a deadline driving the sale (1031 exchange, divorce, estate, relocation)? That informs how much negotiation room exists.
- Schools are B-rated — typically a magnet for longer-tenancy family renters. What's the average tenant stay here, and is there a school-zone premium baked into asking?
- Crime grade is F in this area — have there been break-ins, vandalism, or insurance claims at this property in the last 3 years? What carrier currently insures it and at what premium?
- The area grade is low — what's the realistic commute time and amenity access for the typical tenant pool here? Any planned neighborhood developments (good or bad) we should know about?
- What's the average days-on-market for RENTAL listings here right now (not sales)? A rising rental-DOM trend means longer vacancies and softer asking-rent achievability than the comps imply.
- What's the recent tenant-quality profile in this submarket — average credit score on applications, eviction rate, late-payment / NSF rate, and stable-employment percentage? A property-management company in the area should have these aggregated.
- How much new for-sale + rental construction is in the pipeline within 1–3 miles? Heavy new supply typically softens prices + rents 12–24 months out; constrained supply supports both.
Investment metrics
- 1% rule
- 0.84% ✗
- Cap rate
- 6.20%
- Cash-on-cash
- -0.33%
- DSCR
- 0.99
- GRM
- 10.0
CMA / ARV
- ARV (median comp)
- $231,887
- List price
- $170,000
- Delta
- -26.69%
- Verdict
- UNDERPRICED
- Comps
- 20 within 1.0 mi
Projected returns pro-forma
-3.0% appreciation · 2.22% rent growth · sell at horizon
- IRR
- -17.7%
- Equity multiple
- 0.38×
- Total profit
- $-29,484
- Equity at exit
- $25,348
- IRR
- -11.3%
- Equity multiple
- 0.34×
- Total profit
- $-31,220
- Equity at exit
- $14,698
Cash invested: $47,600 (down + closing). Projections, not guarantees.
Landlord ↔ Tenant lean methodology
- Overall (STATE)
- 18 Strongly Tenant-Friendly
- State California
- 18 Strongly Tenant-Friendly · D+13
- County
- — inherits STATE
- City
- — inherits STATE
ZIP-level market 93308
- Home prices YoY
- -0.5%
- Rents YoY
- 2.2%
- Active inventory
- 307
- Price-to-rent
- 10.0×
Monthly cashflow live
- Estimated rent
- $1,420 high interval (Pro) →
- Mortgage (P&I)
- −$891
- Tax from tax record
- −$173 /mo · $2,074/yr
- Insurance
- −$71
- HOA
- −$0
- Vacancy / Maint / Mgmt
- −$298
- Net cashflow
- $-13
Break-even live
UW: 25.0% down · 7.5% · 30yr · 1.5% tax · 5.0% vac · 8.0% maint · 8.0% mgmt
Financing live
Cash to close
- Down payment
- $42,500
- Closing costs
- $5,100
- Reserves months
- —
- Total cash needed
- —
Loan-product check · same deal, 3 products live
Conventional
25% down · 7.5% · 30yr
- Down + closing
- —
- Monthly P&I
- —
- Monthly cashflow
- —
- DSCR
- —
- Eligible?
- —
Personal DTI + credit; lowest rate.
DSCR
20% down · 8.5% · 30yr
- Down + closing
- —
- Monthly P&I
- —
- Monthly cashflow
- —
- DSCR
- —
- Eligible?
- —
No personal income docs; deal must DSCR.
Hard money
10% down · 12.0% · 12mo
- Down + closing
- —
- Monthly P&I
- —
- Monthly cashflow
- —
- DSCR
- —
- Eligible?
- —
Short-term bridge; refi at stabilization.
Rent comps 38 comps
| Address | Beds | Baths | Sqft | Rent | $/sqft | DOM | Units | Dist |
|---|---|---|---|---|---|---|---|---|
| 106 E Warren Ave Bakersfield, CA | 3.0 | 2.0 | 1169 | $1,400 | $1.20 | 10d | 1 | 0.16mi |
| 120 Harding Ave Unit D Bakersfield, CA | 1.0 | 1.0 | 1000 | $900 | $0.90 | 2d | 1 | 0.28mi |
| 214 E Belle Ave Unit A Bakersfield, CA | 1.0 | 1.0 | 875 | $1,250 | $1.43 | 2d | 1 | 0.33mi |
| 222 Harding Ave Unit B Bakersfield, CA | 3.0 | 2.0 | 1100 | $1,750 | $1.59 | 2d | 1 | 0.38mi |
| 222 Moneta Ave Unit 222 Bakersfield, CA | 3.0 | 2.0 | 1040 | $1,700 | $1.63 | 2d | 1 | 0.47mi |
| 419 Washington Ave Unit 417 Bakersfield, CA | 3.0 | 2.0 | 975 | $1,500 | $1.54 | 2d | 1 | 0.51mi |
| 327 McCord Ave Unit 6 Bakersfield, CA | 3.0 | 1.0 | 1000 | $1,500 | $1.50 | 2d | 1 | 0.72mi |
| 415 Arvin St Bakersfield, CA | 1.0 | 1.0 | 800 | $1,000 | $1.25 | 2d | 1 | 0.73mi |
| 213 Oildale Dr Unit A Bakersfield, CA | 2.0 | 2.0 | 928 | $1,195 | $1.29 | 2d | 1 | 0.76mi |
| 611 Wilson Ave Unit B Bakersfield, CA | 2.0 | 1.0 | 750 | $1,195 | $1.59 | 43d | 1 | 0.76mi |
| 1405 Yosemite Dr Unit 1405 Bakersfield, CA | 2.0 | 1.0 | 712 | $1,100 | $1.54 | 43d | 1 | 0.77mi |
| 210 Douglas St Unit B Bakersfield, CA | 2.0 | 1.5 | 1274 | $1,400 | $1.10 | 2d | 1 | 0.82mi |
| 1905 McCray St Bakersfield, CA | 2.0 | 1.0 | 736 | $1,450 | $1.97 | 2d | 1 | 0.84mi |
| 411 Highland Dr Bakersfield, CA | 2.0 | 1.0 | 1051 | $1,650 | $1.57 | 2d | 1 | 0.84mi |
| 2301 Olympic Dr Unit C Bakersfield, CA | 1.0 | 1.0 | 756 | $1,095 | $1.45 | 2d | 1 | 0.84mi |
| 2309 Manor St Bakersfield, CA | 3.0 | 1.0 | 1090 | $1,725 | $1.58 | 2d | 1 | 0.94mi |
| 2413 Ashby St Unit 1 Bakersfield, CA | 3.0 | 1.0 | 1230 | $1,750 | $1.42 | 14d | 1 | 0.98mi |
| 448 S Oildale Dr Bakersfield, CA | 3.0 | 2.0 | 1080 | $1,500 | $1.39 | 2d | 1 | 1.03mi |
| 709 Francis St Bakersfield, CA | 3.0 | 1.0 | 1300 | $1,400 | $1.08 | 43d | 1 | 1.03mi |
| 819 Washington Ave Bakersfield, CA | 2.0 | 1.0 | 767 | $1,295 | $1.69 | 2d | 1 | 1.04mi |
| 501 Belmont Ave Bakersfield, CA | 1.0 | 1.0 | 1000 | $625 | $0.62 | 43d | 1 | 1.05mi |
| 627 Beardsley Ave Bakersfield, CA | 3.0 | 1.0 | 967 | $1,575 | $1.63 | 43d | 1 | 1.05mi |
| 101 Star Ct Bakersfield, CA | 3.0 | 2.0 | 1040 | $2,145 | $2.06 | 43d | 1 | 1.06mi |
| 615 W China Grade Loop Bakersfield, CA | 1.0–2.0 | 1.0–2.0 | 875 | $1,850 | $2.11 | 2d | 6 | 1.10mi |
| 901 Castaic Ave Bakersfield, CA | 2.0 | 1.0 | 1076 | $1,700 | $1.58 | 2d | 1 | 1.12mi |
| 706 Huskey Dr Bakersfield, CA | 2.0 | 1.0 | 832 | $1,450 | $1.74 | 43d | 1 | 1.14mi |
| 627 Hood Dr Bakersfield, CA | 3.0 | 1.0 | 1140 | $1,795 | $1.57 | 2d | 1 | 1.16mi |
| 811 Beardsley Ave Bakersfield, CA | 2.0 | 1.0 | 800 | $1,295 | $1.62 | 2d | 1 | 1.20mi |
| 901 W Columbus St Unit 266 Bakersfield, CA | 2.0 | 1.0 | 864 | $1,325 | $1.53 | 21d | 1 | 1.27mi |
| 901 W Columbus St Apt 232 Bakersfield, CA | 2.0 | 1.0 | 864 | $1,165 | $1.35 | 21d | 1 | 1.29mi |
| 901 W Columbus St Bakersfield, CA | 1.0–2.0 | 1.0 | 807 | $1,425 | $1.77 | 2d | 12 | 1.30mi |
| 901 W Columbus St Unit 236 Bakersfield, CA | 2.0 | 1.0 | 864 | $1,325 | $1.53 | 43d | 1 | 1.30mi |
| 4504 Tierra Verde St Unit C Bakersfield, CA | 2.0 | 1.5 | 925 | $1,595 | $1.72 | 2d | 1 | 1.30mi |
| 2609 Violet Ct Bakersfield, CA | 3.0 | 2.0 | 1471 | $2,100 | $1.43 | 43d | 1 | 1.33mi |
| 2600 Park Meadows Dr Bakersfield, CA | 1.0–2.0 | 1.0–2.0 | 864 | $1,495 | $1.73 | 2d | 2 | 1.34mi |
| 1201 40th St Bakersfield, CA | 2.0–3.0 | 1.0–2.0 | 870 | $1,075 | $1.23 | 2d | 1 | 1.35mi |
| 3817 K St Unit A Bakersfield, CA | 2.0 | 1.0 | 763 | $1,285 | $1.68 | 2d | 1 | 1.37mi |
| 706 Orchid Dr Apt A Bakersfield, CA | 3.0 | 2.0 | 1233 | $1,900 | $1.54 | 2d | 1 | 1.43mi |
Listing history 34 events
-
2026-06-18days on market $170,000 Active 76 DOM
-
2026-06-17days on market $170,000 Active 75 DOM
-
2026-06-16days on market $170,000 Active 74 DOM
-
2026-06-15days on market $170,000 Active 73 DOM
-
2026-06-14pricedays on market $170,000 Active 71 DOM
-
2026-06-10days on market $175,000 Active 68 DOM
-
2026-06-09days on market $175,000 Active 67 DOM
-
2026-06-08days on market $175,000 Active 66 DOM
-
2026-06-07days on market $175,000 Active 65 DOM
-
2026-06-05days on market $175,000 Active 62 DOM
-
2026-06-03days on market $175,000 Active 61 DOM
-
2026-06-03days on market $175,000 Active 60 DOM
-
2026-06-01days on market $175,000 Active 59 DOM
-
2026-05-31days on market $175,000 Active 58 DOM
-
2026-04-03$175,000 Active 570-char remark
Show marketing remark (570 chars)
Great investment opportunity! This partially completed 600sq. ft. 2-bedroom, 1-bath home is over 60% finished and ready for the right buyer to bring it across the finish line. Major improvements are already completed, including new windows, new roof, electrical, and plumbing. The home also features a dedicated laundry room and sits on a large lot with plenty of room to expand. Even better, approved blueprints and permits are already in place, giving you a head start on completing the project. All that's left are the final touches to make this property truly shine.
-
2025-03-06status Active
-
2025-03-02status Pending
-
2024-11-10$250,000 Active
-
2024-03-26soldstatus $135,000 Sold
-
2024-03-26soldstatus $135,000
-
2024-03-26status Pending
-
2024-03-12$150,000 Active
-
2022-04-22price $69,000
-
2022-03-09price $79,900
-
2020-04-30price $31,000
-
2020-04-09price $35,000
-
2019-08-29price $26,000
-
2019-08-28soldstatus $26,000 Sold
-
2019-08-19status Pending
-
2019-08-18price $30,000
-
2019-08-16price $30,000
-
2019-07-31$35,000 Active
-
2005-12-23soldstatus $95,000
-
1989-06-22soldstatus $15,000
ⓘ Source: listings_history table (triggers on properties + properties_extension) + one-shot
backfill from property_details.listing_events for pre-trigger history.
Tax reassessment forecast CA · Resets to sale price
- Current annual tax
- $2,074 · $173/mo
- Projected year-2 tax
- $2,074 · $173/mo
- Expected delta
- $0/yr ($0/mo · 0.0%)
ⓘ Screening estimate from a state-policy table — verify with the county assessor before closing.
Climate risk First Street
- Flood 1/10 Low FEMA zone X (unshaded) · 0% chance over 30 yrs
- Wildfire 5/10 Major
- Heat 8/10 Severe 7 d/yr ≥105°F today · 17 d/yr by 30 yrs out
- Wind 1/10 Low
- Air quality 10/10 Extreme 39 unhealthy d/yr today · 45 by 30 yrs out
Nearby sold comps map
Loading sold comps map…
Walkable amenities ~0.75 mi
Loading nearby amenities…
Taxation est. · year 1
- Rental income
- $17,045
- − Mortgage interest
- −$9,523
- − Property taxes
- −$2,074
- − Insurance
- −$850
- − Repairs & maintenance
- −$1,364
- − Management
- −$1,364
- − Depreciation
- −$4,945
- Taxable loss
- −$3,074
- Est. tax savings @ 24.0%
- +$738
- After-tax cash flow
- $582/yr
For passive investors: Depreciation is non-cash, so a rental often shows a tax loss while cash-flowing — sheltering income. Rental losses are passive: they offset passive income freely, and up to $25,000/yr can offset ordinary (W-2) income if you actively participate and your MAGI is under $100k (phasing out to $0 by $150k); unused losses carry forward. On sale, claimed depreciation is recaptured at up to 25%, and gains may owe capital-gains tax (a 1031 exchange can defer both). Figures are a year-1 estimate at your 24.0% rate — not tax advice; consult a CPA.
Schools (NCES district)
- District
- Standard Elementary
- NCES district ID
- 0637890
- Math proficiency
- 16% ▬ 0.00%
- Reading proficiency
- 27% ▼ -3.00%
- Median HH income
- $40,574
- Composite
- 21.42/100
- National rank
- #13640
- State rank
- #1227 of 1400 in CA
Livability — Oildale
- Score
- 58/100
- State rank
- #680
- US rank
- #20848
Category grades
Schools grade is shown separately in the Schools card above.
Census & demographics
- Census place
- Oildale, CA
- County
- Kern County · 710,371 people
- Metro
- Bakersfield, CA
- Population (ZIP)
- 55,078
- Household income
- $62,445
- Rent vs Own
- Severe rent burden
- 2931.0
Population outlook (Kern County) Hauer SSP2
- Today (2025)
- 947,286 people
- By 2030
- 978,984 · +3.3%
- By 2040
- 1,045,018 · +10.3%
- By 2050
- 1,105,232 · +16.7%
- By 2075
- 1,229,538 · +29.8%
- By 2100
- 1,238,059 · +30.7%
Race, ethnicity, and origin ACS 2023
- Neighborhood character
- Diverse neighborhood (Simpson 0.57)
- Race & ethnicity
- White 57% Hispanic / Latino 32% Two or more races 15% Black 3% Asian 3% Native American 1%
- Hispanic origin (detail)
- Mexican 26%
- Common ancestry
- Slovak 3% Italian 1% Romanian 1%
- Foreign-born
- 8% · Canada, Vietnam
- Languages at home
- 80% English-only · Spanish 17%
Political lean MEDSL · Kern
- 2024 margin
- Strong R (+21.1) · D 38.2% · R 59.3% · Other 2.5%
- 2008→2024 swing
- -3.3pp toward R · 2008: -17.8pp · 2024: -21.1pp
- All cycles
- 2024: R+21.1 2020: R+10.2 2016: R+15.0 2012: R+20.9 2008: R+17.8
Not yet ingested
- Civics
- —
Market trends
- HPI YoY
- ▼ -4.52%
- Current HPI
- 825.65
- Rent YoY
- ▲ 2.22%
- Metro
- Bakersfield, CA
- State GDP YoY
- ▲ 3.21%
- F500 in state
- 116
Industry mix (Fortune 500 HQ in CA)
| Industry | F500 HQs | Revenue |
|---|---|---|
| Technology | 27 | $1,492B |
|
||
| Financial Services | 3 | $174B |
|
||
| Retail | 3 | $44B |
|
||
| Insurance | 3 | $26B |
|
||
| Media / Entertainment | 2 | $115B |
|
||
| Pharmaceuticals / Biotech | 2 | $62B |
|
||
Price history
+1066.7% since first listed20 events — show timeline
- 2026-04-03 Listed $175,000 GEMLS
- 2025-03-06 Relisted — GEMLS
- 2025-03-02 Pending — GEMLS
- 2024-11-10 Listed $250,000 GEMLS
- 2024-03-26 Sold (Public Records) $135,000 Public Records
- 2024-03-26 Sold (MLS) $135,000 GEMLS
- 2024-03-26 Pending — GEMLS
- 2024-03-12 Listed $150,000 GEMLS
- 2022-04-22 Price Changed $69,000 GEMLS
- 2022-03-09 Price Changed $79,900 GEMLS
- 2020-04-30 Price Changed $31,000 GEMLS
- 2020-04-09 Price Changed $35,000 GEMLS
- 2019-08-29 Price Changed $26,000 GEMLS
- 2019-08-28 Sold (MLS) $26,000 GEMLS
- 2019-08-19 Pending — GEMLS
- 2019-08-18 Price Changed $30,000 GEMLS
- 2019-08-16 Price Changed $30,000 GEMLS
- 2019-07-31 Listed $35,000 GEMLS
- 2005-12-23 Sold (Public Records) $95,000 Public Records
- 1989-06-22 Sold (Public Records) $15,000 Public Records
Property tax history
+21.8%/yrLatest (2025): $2,074 · +5.8% YoY. Source: county tax records.
Cash-flow waterfall
monthlySold comps — $/sqft
last 12 mo · ≤1 miLoading sold comps…