 Multi-family
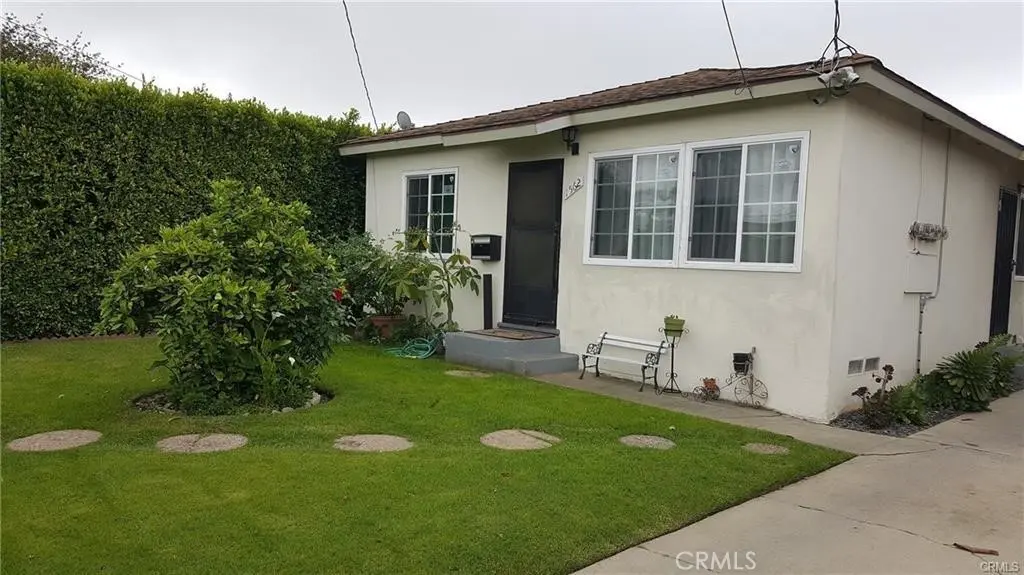
1562 W 226th · Los Angeles, CA
Flood risk 1/10 · Minimal
- FEMA flood zone
- X (unshaded)
- Chance of flooding over 30 yrs
- 0.0%
- Est. flood insurance / yr
- $507 – $1,088
Fire risk 1/10 · Minimal
- Est. fire insurance / yr
- $659 – $1,223
Heat risk 4/10 · Minor
- Hot days now (above 87°F)
- 7 days/yr
- Hot days in 30 yrs
- 22 days/yr
Wind risk 1/10 · Minimal
- Chance of severe wind over 30 yrs
- —
Air-quality risk 5/10 · Moderate
- Unhealthy air days now
- 7 days/yr
- Unhealthy air days in 30 yrs
- 7 days/yr
Risk factors via First Street. Map © Google.
Why this score? — see what drove the C grade
The composite is a weighted blend of 9 inputs, each scored 0–100. Each bar is that input's sub-score; the figure is the points it added to the 100-point composite (weight × sub-score).
- Cash flow +17.9/30.0
- ARV discount +15.0/15.0
- DSCR +5.6/10.0
- 1% rule +4.3/10.0
- Schools +3.6/10.0
- Livability +3.4/5.0
- Rent growth +3.3/5.0
- Condition / age +2.5/5.0
- Appreciation +0.0/10.0
$949,000
🖨 Deal sheet (PDF) 📄 Offer letter ✓ Due diligence
Multi-family units
County records classify this as Multi-Family (2-4 Unit). Listing-text estimate: 1 unit. estimate disagrees with records
Listing remarks MLS
Do not miss this 4 units all one bedrooms all occupied long term tenants in a very great location. New roof installed in year 2020 by Lowe's with warranty New windows , Highly updated 2 units, Plumbing line under the house to the street are new. 2 ADU's can be built in the back seller started 2 years ago but did not completed. All units consist of one bedroom, one bath, kitchen, living room and dining area. Short distance to 405 and 110 FWYS. Please do not disturb the tenants.
Key facts
- Great location
- New plumbing line
- 2 adus can be built
Tags
Neighborhood map
What this means for you Summary
Snapshot
- This is a 4-bed/4.0-bath multifamily listed at $949k.
Deal economics
- At list price, monthly cash flow is $802 ($10k/yr) — positive.
- The deal already cash-flows at list — no discount required.
- To meet the 1% rule (rent ≥ 1% of price), the offer needs to be $883k (7.0% below list).
- Recommended offer: $835k (12.0% below list) — sets the bar for market timing.
- Cap rate 7.3% vs local median 2.1% in Los Angeles — top-decile yield for the area; either an underpriced asset or a hidden risk that comps aren't pricing in. Stress-test before assuming the spread holds.
Location & tenants
- Location reads 68/100 on livability (#273 in CA) — a middle-class / working-renter tenant base. Strengths: amenities A+, commute A+, employment B; Watch: health & safety C-, crime F, cost of living F.
- Los Angeles Unified (urban): math 29% / reading 54% proficiency, ranked #223 of 517 in CA (top 43%) — families likely to look elsewhere, expect single-tenant / working-renter base with shorter leases; 67% free/reduced lunch — lower-income household profile, screen leases tightly.
- Zoned schools: Meyler Street Elementary (628 students, 92% FRL); Alexander Fleming Middle (1,085 students, 87% FRL); Nathaniel Narbonne Senior High (math 28% / reading 56%, grade F, #472 of 1,170 statewide, top 42%, 1,731 students, 84% FRL) — zoned schools average 87% FRL vs 67% district-wide (20 pts higher); higher-poverty schools than district average — tighter screening recommended.
- Market conditions: Rents rising (+3.2%/yr); 95 active listings in the ZIP; 13 comparable units currently listed for rent nearby; rentals at typical pace (median 17d on market — plan ~3-4 weeks tenant-placement turnaround); solid renter incomes; 19,697 units permitted in Los Angeles County in 2024 (9,426 in 5+ unit buildings).
- At $8,828/mo this rent would consume 114% of the median local household income ($93k/yr) (locally 1972% of renters already pay >50% of income on rent) — very limited rent-growth headroom before tenants either downsize or default.
Forward outlook
- Local home prices are declining (-3.0%/yr); year-one equity from $7k of loan paydown is wiped out by about $28k of value loss. Plan a longer hold.
- Los Angeles County population projected at +9% by 2050 — modest demand growth; plan on rents tracking national, not racing it.
Negotiation context
- It's been on market 152 days — a 12% lower offer ($835k) is reasonable based on typical stale-listing flexibility.
- 9 sale attempts since 32y ago; this cycle's ask has dropped $151k (14%) from the opening price — seller is motivated, your offer sets the floor, not the list.
- Current owner paid $630k; list at $949k implies a 51% gain — meaningful room to come down on a strong offer.
Risks & watch-outs
- Watch-outs: built in 1955 — expect roof / HVAC / electrical / plumbing capex.
Questions for the listing agent
- It's been on market 152 days. Have you received any prior offers? Is the seller open to a 12% concession, seller financing, or rate buy-down credit?
- Built in 1955 — when were the roof, HVAC, electrical panel, plumbing, and water heater last replaced?
- Why hasn't it sold? Are there any deal-killer items the seller is aware of (foundation, flood, title, zoning, code violations)?
- Is there a deadline driving the sale (1031 exchange, divorce, estate, relocation)? That informs how much negotiation room exists.
- Schools are D-rated, which usually means shorter tenancies and higher turnover. Who's the typical renter profile here, and what's been the actual vacancy rate?
- Crime grade is F in this area — have there been break-ins, vandalism, or insurance claims at this property in the last 3 years? What carrier currently insures it and at what premium?
- What's the average days-on-market for RENTAL listings here right now (not sales)? A rising rental-DOM trend means longer vacancies and softer asking-rent achievability than the comps imply.
- What's the recent tenant-quality profile in this submarket — average credit score on applications, eviction rate, late-payment / NSF rate, and stable-employment percentage? A property-management company in the area should have these aggregated.
- How much new apartment / multifamily construction is in the pipeline within 1–3 miles? Heavy new supply (>2% of stock underway) typically softens rents 12–24 months out; light construction supports rent growth.
Investment metrics
- 1% rule
- 0.93% ✗
- Cap rate
- 7.31%
- Cash-on-cash
- 3.62%
- DSCR
- 1.16
- GRM
- 9.0
CMA / ARV
- ARV (median comp)
- $1,212,294
- List price
- $949,000
- Delta
- -21.72%
- Verdict
- UNDERPRICED
- Comps
- 20 within 1.0 mi
Projected returns pro-forma
-3.0% appreciation · 3.25% rent growth · sell at horizon
- IRR
- -10.4%
- Equity multiple
- 0.62×
- Total profit
- $-100,581
- Equity at exit
- $141,499
- IRR
- -0.7%
- Equity multiple
- 0.95×
- Total profit
- $-13,057
- Equity at exit
- $82,052
Cash invested: $265,720 (down + closing). Projections, not guarantees.
Landlord ↔ Tenant lean methodology
- Overall (CITY)
- 0 Strongly Tenant-Friendly
- State California
- 18 Strongly Tenant-Friendly · D+13
- County
- — inherits STATE
- City Los Angeles
- 0 Strongly Tenant-Friendly · D+22
ZIP-level market 90501
- Rents YoY
- 3.2%
- Active inventory
- 95
- Price-to-rent
- 35.8×
Monthly cashflow live
- Estimated rent
- $8,828 high interval (Pro) →
- Mortgage (P&I)
- −$4,977
- Tax from tax record
- −$800 /mo · $9,601/yr
- Insurance
- −$395
- HOA
- −$0
- Vacancy / Maint / Mgmt
- −$1,854
- Net cashflow
- $802
Break-even live
Sensitivity live
| Price | -10% $1,339 | -5% $1,071 | +0% $802 | +5% $533 | +10% $265 |
|---|---|---|---|---|---|
| Rent | -10% $105 | -5% $453 | +0% $802 | +5% $1,151 | +10% $1,499 |
| Rate | -1.0pp $1,280 | -0.5pp $1,043 | base $802 | +0.5pp $556 | +1.0pp $306 |
4-unit breakdown (identical units grouped — click to expand)
| Units | Beds | Baths | Est. rent |
|---|---|---|---|
| 4× units | 1 | 1 | $8,828 |
| #1 | 1 | 1 | $2,207 |
| #2 | 1 | 1 | $2,207 |
| #3 | 1 | 1 | $2,207 |
| #4 | 1 | 1 | $2,207 |
| Total (4 units) | $8,828 | ||
UW: 25.0% down · 7.5% · 30yr · 1.5% tax · 5.0% vac · 8.0% maint · 8.0% mgmt
Financing live
Cash to close
- Down payment
- $237,250
- Closing costs
- $28,470
- Reserves months
- —
- Total cash needed
- —
Loan-product check · same deal, 3 products live
Conventional
25% down · 7.5% · 30yr
- Down + closing
- —
- Monthly P&I
- —
- Monthly cashflow
- —
- DSCR
- —
- Eligible?
- —
Personal DTI + credit; lowest rate.
DSCR
20% down · 8.5% · 30yr
- Down + closing
- —
- Monthly P&I
- —
- Monthly cashflow
- —
- DSCR
- —
- Eligible?
- —
No personal income docs; deal must DSCR.
Hard money
10% down · 12.0% · 12mo
- Down + closing
- —
- Monthly P&I
- —
- Monthly cashflow
- —
- DSCR
- —
- Eligible?
- —
Short-term bridge; refi at stabilization.
Rent comps 13 comps
| Address | Beds | Baths | Sqft | Rent | $/sqft | DOM | Units | Dist |
|---|---|---|---|---|---|---|---|---|
| 1309 Songbird Way Torrance, CA | 4.0 | 4.0 | 2016 | $4,650 | $2.31 | 16d | 1 | 0.36mi |
| 22919 Mariposa Ave #202 Torrance, CA | 3.0 | 4.0 | 1780 | $4,000 | $2.25 | 26d | 1 | 0.52mi |
| 22919 Mariposa Ave Torrance, CA | 2.0–3.0 | 2.5–4.0 | 1480 | $4,000 | $2.70 | 46d | 2 | 0.53mi |
| 22117 Normandie Ave Torrance, CA | 5.0 | 4.0 | 3008 | $5,750 | $1.91 | 0d | 1 | 0.54mi |
| 2125 W 236th Pl Torrance, CA | 4.0 | 3.0 | 2112 | $5,000 | $2.37 | 46d | 1 | 0.99mi |
| 23821 Stanhurst Ave Torrance, CA | 4.0 | 2.5 | 2260 | $5,200 | $2.30 | 15d | 1 | 1.02mi |
| 2124 W 238th St Torrance, CA | 5.0 | 5.0 | 3148 | $7,950 | $2.53 | 0d | 1 | 1.13mi |
| 22553 Firenze St Carson, CA | 3.0 | 2.5 | 2012 | $4,500 | $2.24 | 26d | 1 | 1.18mi |
| 1241 Ivy Ter Torrance, CA | 3.0 | 3.0 | 1822 | $4,100 | $2.25 | 46d | 1 | 1.34mi |
| 1361 Abraham Ter Harbor City, CA | 4.0 | 2.5 | 2018 | $4,300 | $2.13 | 16d | 1 | 1.39mi |
| 2067 Lomita Blvd Lomita, CA | 4.0 | 2.0 | 2070 | $4,950 | $2.39 | 7d | 1 | 1.41mi |
| 1611 W 208th St #3 Torrance, CA | 3.0 | 2.5 | 1860 | $4,300 | $2.31 | 46d | 1 | 1.46mi |
| 22839 Morro Dr Carson, CA | 4.0 | 3.0 | 2160 | $4,295 | $1.99 | 15d | 1 | 1.50mi |
Listing history 45 events
-
2026-06-22days on market $949,000 Active 152 DOM
-
2026-06-21days on market $949,000 Active 151 DOM
-
2026-06-18days on market $949,000 Active 148 DOM
-
2026-06-17days on market $949,000 Active 147 DOM
-
2026-06-16days on market $949,000 Active 146 DOM
-
2026-06-15days on market $949,000 Active 145 DOM
-
2026-06-13remarks 517-char remark
-
2026-06-13days on market $949,000 Active 143 DOM
-
2026-06-09days on market $949,000 Active 139 DOM
-
2026-06-08days on market $949,000 Active 138 DOM
-
2026-06-07days on market $949,000 Active 137 DOM
-
2026-06-04days on market $949,000 Active 134 DOM
-
2026-06-03days on market $949,000 Active 133 DOM
-
2026-06-02days on market $949,000 Active 132 DOM
-
2026-06-02price $949,000 Active 131 DOM
-
2026-06-01days on market $999,500 Active 131 DOM
-
2026-05-31days on market $999,500 Active 130 DOM
-
2026-03-05price $999,500 483-char remark
Show marketing remark (483 chars)
Do not miss this 4 units all one bedrooms all occupied long term tenants in a very great location. New roof installed in year 2020 by Lowe's with warranty New windows , Highly updated 2 units, Plumbing line under the house to the street are new. 2 ADU's can be built in the back seller started 2 years ago but did not completed. All units consist of one bedroom, one bath, kitchen, living room and dining area. Short distance to 405 and 110 FWYS. Please do not disturb the tenants.
-
2026-01-21$1,100,000 Active 483-char remark
Show marketing remark (483 chars)
Do not miss this 4 units all one bedrooms all occupied long term tenants in a very great location. New roof installed in year 2020 by Lowe's with warranty New windows , Highly updated 2 units, Plumbing line under the house to the street are new. 2 ADU's can be built in the back seller started 2 years ago but did not completed. All units consist of one bedroom, one bath, kitchen, living room and dining area. Short distance to 405 and 110 FWYS. Please do not disturb the tenants.
-
2017-02-01soldstatus $630,000 Closed Sale 319-char remark
Show marketing remark (319 chars)
Don't let this pass out! Excellent opportunity for owner occupied or investor. These four units had been recently upgraded and generates good income. Every unit consists of one bedroom and one bath, kitchen, formal dining room and living room. Near shopping center, public transportation and close to 405fwy and 110fwy.
-
2017-02-01soldstatus $630,000
Show marketing remark (319 chars)
Don't let this pass out! Excellent opportunity for owner occupied or investor. These four units had been recently upgraded and generates good income. Every unit consists of one bedroom and one bath, kitchen, formal dining room and living room. Near shopping center, public transportation and close to 405fwy and 110fwy.
-
2017-02-01soldstatus $623,000
Show marketing remark (319 chars)
Don't let this pass out! Excellent opportunity for owner occupied or investor. These four units had been recently upgraded and generates good income. Every unit consists of one bedroom and one bath, kitchen, formal dining room and living room. Near shopping center, public transportation and close to 405fwy and 110fwy.
-
2016-12-21status Pending Sale 319-char remark
Show marketing remark (319 chars)
Don't let this pass out! Excellent opportunity for owner occupied or investor. These four units had been recently upgraded and generates good income. Every unit consists of one bedroom and one bath, kitchen, formal dining room and living room. Near shopping center, public transportation and close to 405fwy and 110fwy.
-
2016-12-21price $629,999 319-char remark
Show marketing remark (319 chars)
Don't let this pass out! Excellent opportunity for owner occupied or investor. These four units had been recently upgraded and generates good income. Every unit consists of one bedroom and one bath, kitchen, formal dining room and living room. Near shopping center, public transportation and close to 405fwy and 110fwy.
-
2016-12-16$599,999 Active 319-char remark
Show marketing remark (319 chars)
Don't let this pass out! Excellent opportunity for owner occupied or investor. These four units had been recently upgraded and generates good income. Every unit consists of one bedroom and one bath, kitchen, formal dining room and living room. Near shopping center, public transportation and close to 405fwy and 110fwy.
-
2016-12-16$629,999
Show marketing remark (319 chars)
Don't let this pass out! Excellent opportunity for owner occupied or investor. These four units had been recently upgraded and generates good income. Every unit consists of one bedroom and one bath, kitchen, formal dining room and living room. Near shopping center, public transportation and close to 405fwy and 110fwy.
-
2009-07-28soldstatus $410,000 Closed
-
2009-07-28soldstatus $410,000
-
2009-05-16historical
-
2009-03-18$395,000
-
2009-02-06soldstatus $260,000 Closed
-
2008-12-25historical
-
2008-12-05price $285,000
-
2008-12-03$289,900
-
2007-01-01historical
-
2006-12-01$569,999
-
2006-11-24historical
-
2006-05-23$725,000
-
2006-03-07soldstatus $667,500
-
2005-08-10soldstatus $545,000
-
2005-07-08soldstatus $545,000
-
2005-05-17$540,000
-
1994-11-30soldstatus $150,000
-
1994-11-30soldstatus $150,000
-
1994-09-16$157,500
ⓘ Source: listings_history table (triggers on properties + properties_extension) + one-shot
backfill from property_details.listing_events for pre-trigger history.
Tax reassessment forecast CA · Resets to sale price
- Current annual tax
- $9,601 · $800/mo
- Projected year-2 tax
- $9,601 · $800/mo
- Expected delta
- $0/yr ($0/mo · 0.0%)
ⓘ Screening estimate from a state-policy table — verify with the county assessor before closing.
Climate risk First Street
- Flood 1/10 Low FEMA zone X (unshaded) · 0% chance over 30 yrs
- Wildfire 1/10 Low
- Heat 4/10 Moderate 7 d/yr ≥87°F today · 22 d/yr by 30 yrs out
- Wind 1/10 Low
- Air quality 5/10 Major 7 unhealthy d/yr today · 7 by 30 yrs out
Nearby sold comps map
Loading sold comps map…
Walkable amenities ~0.75 mi
Loading nearby amenities…
Taxation est. · year 1
- Rental income
- $105,936
- − Mortgage interest
- −$53,159
- − Property taxes
- −$9,601
- − Insurance
- −$4,745
- − Repairs & maintenance
- −$8,475
- − Management
- −$8,475
- − Depreciation
- −$27,607
- Taxable loss
- −$6,126
- Est. tax savings @ 24.0%
- +$1,470
- After-tax cash flow
- $11,094/yr
For passive investors: Depreciation is non-cash, so a rental often shows a tax loss while cash-flowing — sheltering income. Rental losses are passive: they offset passive income freely, and up to $25,000/yr can offset ordinary (W-2) income if you actively participate and your MAGI is under $100k (phasing out to $0 by $150k); unused losses carry forward. On sale, claimed depreciation is recaptured at up to 25%, and gains may owe capital-gains tax (a 1031 exchange can defer both). Figures are a year-1 estimate at your 24.0% rate — not tax advice; consult a CPA.
Schools (NCES district)
- District
- Los Angeles Unified
- NCES district ID
- 0622710
- Math proficiency
- 29% ▼ -4.00%
- Reading proficiency
- 54% ▲ 10.00%
- Median HH income
- $50,403
- Composite
- 35.67/100
- National rank
- #4875
- State rank
- #223 of 517 in CA
Livability — Los Angeles
- Score
- 68/100
- State rank
- #273
- US rank
- #9237
Category grades
Schools grade is shown separately in the Schools card above.
Census & demographics
- Census place
- Los Angeles, CA
- County
- Los Angeles County · 9,444,647 people
- City population
- 3,838,149
- Metro
- Los Angeles-Long Beach-Anaheim, CA
- Population (ZIP)
- 41,787
- Household income
- $92,923
- Rent vs Own
- Severe rent burden
- 1972.0
Population outlook (Los Angeles County) Hauer SSP2
- Today (2025)
- 10,940,515 people
- By 2030
- 11,256,481 · +2.9%
- By 2040
- 11,729,929 · +7.2%
- By 2050
- 11,948,407 · +9.2%
- By 2075
- 11,818,114 · +8.0%
- By 2100
- 10,842,928 · -0.9%
Race, ethnicity, and origin ACS 2023
- Neighborhood character
- Diverse neighborhood (Simpson 0.70)
- Race & ethnicity
- Hispanic / Latino 43% Asian 27% White 20% Two or more races 15% Black 5%
- Hispanic origin (detail)
- Mexican 34%
- Common ancestry
- Slovak 1% Lithuanian 1% British 1%
- Foreign-born
- 33% · Canada, South Korea, China
- Languages at home
- 46% English-only · Spanish 32% Other Asian/Pacific 5% Korean 5%
Political lean MEDSL · Los Angeles
- 2024 margin
- Solid D (+32.9) · D 64.8% · R 31.9% · Other 3.3%
- 2008→2024 swing
- -7.4pp toward R · 2008: 40.4pp · 2024: 32.9pp
- All cycles
- 2024: D+32.9 2020: D+44.2 2016: D+48.0 2012: D+40.0 2008: D+40.4
Not yet ingested
- Civics
- —
Market trends
- HPI YoY
- ▼ -755.95%
- Current HPI
- 334.9041
- Rent YoY
- ▲ 3.25%
- Metro
- Los Angeles-Long Beach-Anaheim, CA
- State GDP YoY
- ▲ 3.21%
- F500 in state
- 116
Industry mix (Fortune 500 HQ in CA)
| Industry | F500 HQs | Revenue |
|---|---|---|
| Technology | 27 | $1,492B |
|
||
| Financial Services | 3 | $174B |
|
||
| Retail | 3 | $44B |
|
||
| Insurance | 3 | $26B |
|
||
| Media / Entertainment | 2 | $115B |
|
||
| Pharmaceuticals / Biotech | 2 | $62B |
|
||
Price history
+534.6% since first listed28 events — show timeline
- 2026-03-05 Price Changed $999,500 CRMLS
- 2026-01-21 Listed $1,100,000 CRMLS
- 2017-02-01 Sold (Public Records) $623,000 Public Records
- 2017-02-01 Sold (MLS) $630,000 SDMLS
- 2017-02-01 Sold (MLS) $630,000 CRMLS
- 2016-12-21 Pending — CRMLS
- 2016-12-21 Price Changed $629,999 CRMLS
- 2016-12-16 Listed $599,999 CRMLS
- 2016-12-16 Listed $629,999 SDMLS
- 2009-07-28 Sold (Public Records) $410,000 Public Records
- 2009-07-28 Sold (MLS) $410,000 TheMLS
- 2009-05-16 Delisted — TheMLS
- 2009-03-18 Listed $395,000 TheMLS
- 2009-02-06 Sold (MLS) $260,000 TheMLS
- 2008-12-25 Delisted — TheMLS
- 2008-12-05 Price Changed $285,000 TheMLS
- 2008-12-03 Listed $289,900 TheMLS
- 2007-01-01 Listing Removed — CRMLS
- 2006-12-01 Listed $569,999 CRMLS
- 2006-11-24 Listing Removed — CRMLS
- 2006-05-23 Listed $725,000 CRMLS
- 2006-03-07 Sold (Public Records) $667,500 Public Records
- 2005-08-10 Sold (Public Records) $545,000 Public Records
- 2005-07-08 Sold (MLS) $545,000 CRMLS
- 2005-05-17 Listed $540,000 CRMLS
- 1994-11-30 Sold (Public Records) $150,000 Public Records
- 1994-11-30 Sold (MLS) $150,000 CRMLS
- 1994-09-16 Listed $157,500 CRMLS
Property tax history
+0.3%/yrLatest (2025): $9,601 · +1.4% YoY. Source: county tax records.
Cash-flow waterfall
monthlySold comps — $/sqft
last 12 mo · ≤1 miLoading sold comps…