18146 Evening Star Ave · Garden Grove, FL
Flood risk 1/10 · Minimal
- FEMA flood zone
- X (unshaded)
- Chance of flooding over 30 yrs
- 0.0%
- Est. flood insurance / yr
- $507 – $1,088
Fire risk 5/10 · Moderate
- Est. fire insurance / yr
- $947 – $1,759
Heat risk 9/10 · Severe
- Hot days now (above 109°F)
- 7 days/yr
- Hot days in 30 yrs
- 25 days/yr
Wind risk 10/10 · Severe
- Chance of severe wind over 30 yrs
- 99.0%
Air-quality risk 2/10 · Minimal
- Unhealthy air days now
- 1 days/yr
- Unhealthy air days in 30 yrs
- 1 days/yr
Risk factors via First Street. Map © Google.
Why this score? — see what drove the B grade
The composite is a weighted blend of 9 inputs, each scored 0–100. Each bar is that input's sub-score; the figure is the points it added to the 100-point composite (weight × sub-score).
- Cash flow +30.0/30.0
- 1% rule +10.0/10.0
- DSCR +10.0/10.0
- ARV discount +7.5/15.0
- Schools +4.2/10.0
- Livability +3.2/5.0
- Rent growth +2.9/5.0
- Condition / age +2.5/5.0
- Appreciation +0.0/10.0
$79,000
🖨 Deal sheet 📄 Offer letter ✓ Due diligence
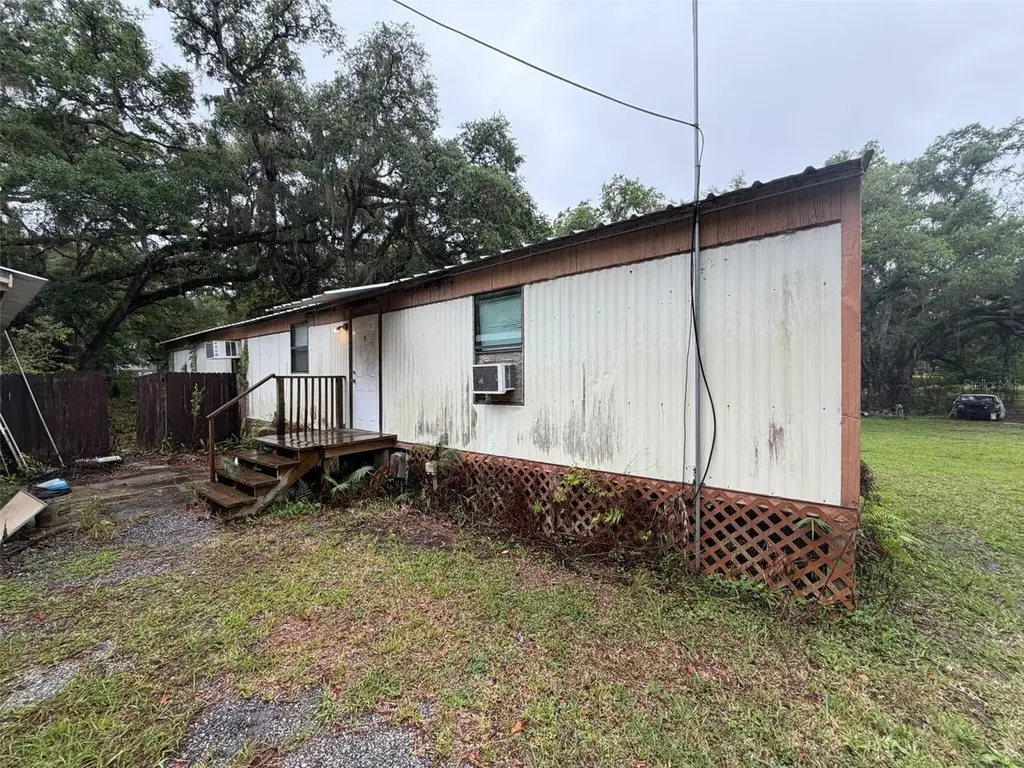
Listing remarks
Great value on this 2-bedroom, 2-bath mobile home located in Brooksville. The property needs work but provides strong upside potential for the right buyer. Quiet neighborhood, functional floorplan, and low entry price make this a great opportunity!
Key facts
- 9,750 sq ft lot
- Garage
- Built 1988
Property features AI
Finance
- Other: Partially furnished; Lot about 0.2 acre; Living area about 896 square feet
- HOA & community: No association; Pets allowed
Exterior
- Parking: 1-car garage
- Utilities: Well water; Septic tank; Electricity connected; Private utilities; Water connected
- Home design: Manufactured home (single wide); Residential property; One level; East-facing
- Construction: Vinyl siding; Metal roof; Pillar/post/pier foundation; Completed condition
- Exterior features: Other exterior features; Paved road access
Interior
- Kitchen: Range; Refrigerator
- Bedrooms: 2 bedrooms
- Flooring: Carpet; Linoleum
- Bathrooms: 2 full bathrooms
- Heating & cooling: Electric heating; Wall/window air conditioning units
- Interior features: Other interior features
- Laundry & utility: Laundry: Other
Neighborhood map
What this means for you Summary
Snapshot
- This is a 3-bed/2.0-bath manufactured listed at $79k.
Deal economics
- At list price, monthly cash flow is $883 ($11k/yr) — positive.
- The deal already cash-flows at list — no discount required.
- Meets the 1% rule at list price ($2k rent vs $79k).
- Recommended offer: $77k (3.0% below list) — sets the bar for market timing.
Location & tenants
- Location reads 64/100 on livability (#667 in FL) — a middle-class / working-renter tenant base. Strengths: crime A+, cost of living A+, housing A+; Watch: health & safety C-, employment D, schools F.
- Hernando (suburban): math 50% / reading 50% proficiency, ranked #38 of 73 in FL (top 52%) — acceptable for families but not a draw, mixed tenant base, ~2y average lease.
- Market conditions: Rents rising (+1.6%/yr); 196 active listings in the ZIP; 1 comparable units currently listed for rent nearby; solid renter incomes; 2,505 units permitted in Hernando County in 2024 (318 in 5+ unit buildings).
Forward outlook
- Local home prices are declining (-3.0%/yr); year-one equity from $546 of loan paydown is wiped out by about $2k of value loss. Plan a longer hold.
- Hernando County population projected at +11% by 2050 — modest demand growth; plan on rents tracking national, not racing it.
- At projected returns (-3.0% appreciation + 1.6% rent growth), your $22k cash investment doubles in ~3 years — after that, you're playing with house money.
Negotiation context
- It's been on market 42 days — a 3% lower offer ($77k) is reasonable based on typical stale-listing flexibility.
- Current owner paid $15k; list at $79k implies a 427% gain — meaningful room to come down on a strong offer.
Risks & watch-outs
- Climate carrying-cost: severe wind risk, 99% chance of damaging wind over 30y; moderate wildfire risk; extreme-heat days projected 7→25/yr by 2055 (HVAC capex compounding) — expect insurance premiums to compound above CPI over the hold.
Questions for the listing agent
- It's been on market 42 days. Have you received any prior offers? Is the seller open to a 3% concession, seller financing, or rate buy-down credit?
- Is there a deadline driving the sale (1031 exchange, divorce, estate, relocation)? That informs how much negotiation room exists.
- Schools are F-rated, which usually means shorter tenancies and higher turnover. Who's the typical renter profile here, and what's been the actual vacancy rate?
- What's the average days-on-market for RENTAL listings here right now (not sales)? A rising rental-DOM trend means longer vacancies and softer asking-rent achievability than the comps imply.
- What's the recent tenant-quality profile in this submarket — average credit score on applications, eviction rate, late-payment / NSF rate, and stable-employment percentage? A property-management company in the area should have these aggregated.
- How much new for-sale + rental construction is in the pipeline within 1–3 miles? Heavy new supply typically softens prices + rents 12–24 months out; constrained supply supports both.
Investment metrics
- 1% rule
- 2.28% ✓
- Cap rate
- 19.71%
- Cash-on-cash
- 47.91%
- DSCR
- 3.13
- GRM
- 3.7
CMA / ARV
- ARV (on-the-fly)
- $163,072
- Comps found
- 5
Show comp detail 5 sales within ~0.75 mi
| Address | Dist | Beds/Ba | Sqft | Sold | Price | $/sf | Match |
|---|---|---|---|---|---|---|---|
| 18048 Evening Star Ave | 0.19mi | 3/2.0 | 920 (+3%) | 3mo | $210,000 | $228 | 84 |
| 18178 Evening Star Ave | 0.07mi | 2/2.0 (-1) | 924 (+3%) | 15mo | $100,000 | $108 | 74 |
| 18100 Celia Ave | 0.21mi | 2/2.0 (-1) | 828 (-8%) | 3mo | $160,000 | $193 | 70 |
| 2821 Kingswood Cir | 0.62mi | 2/2.0 (-1) | 972 (+8%) | 13mo | $145,000 | $149 | 41 |
| 2861 Kingswood Cir | 0.67mi | 2/2.0 (-1) | 960 (+7%) | 16mo | $175,000 | $182 | 39 |
Match score weights: distance 35% · size 25% · config 20% · recency 20%. Top-matched comps best support the ARV.
Projected returns pro-forma
-3.0% appreciation · 1.61% rent growth · sell at horizon
- IRR
- 43.8%
- Equity multiple
- 2.85×
- Total profit
- $40,988
- Equity at exit
- $11,779
- IRR
- 49.2%
- Equity multiple
- 5.44×
- Total profit
- $98,310
- Equity at exit
- $6,830
Cash invested: $22,120 (down + closing). Projections, not guarantees.
Landlord ↔ Tenant lean methodology
- Overall (STATE)
- 87 Strongly Landlord-Friendly
- State Florida
- 87 Strongly Landlord-Friendly · R+3
- County
- — inherits STATE
- City
- — inherits STATE
ZIP-level market 34604
- Home prices YoY
- -23.4%
- Rents YoY
- 1.6%
- Active inventory
- 196
- Price-to-rent
- 3.7×
Monthly cashflow live
- Estimated rent
- $1,799 medium interval (Pro) →
- Mortgage (P&I)
- −$414
- Tax from tax record
- −$90 /mo · $1,086/yr
- Insurance
- −$33
- HOA
- −$0
- Vacancy / Maint / Mgmt
- −$378
- Net cashflow
- $883
Break-even live
UW: 25.0% down · 7.5% · 30yr · 1.5% tax · 5.0% vac · 8.0% maint · 8.0% mgmt
Financing live
Cash to close
- Down payment
- $19,750
- Closing costs
- $2,370
- Reserves months
- —
- Total cash needed
- —
Loan-product check · same deal, 3 products live
Conventional
25% down · 7.5% · 30yr
- Down + closing
- —
- Monthly P&I
- —
- Monthly cashflow
- —
- DSCR
- —
- Eligible?
- —
Personal DTI + credit; lowest rate.
DSCR
20% down · 8.5% · 30yr
- Down + closing
- —
- Monthly P&I
- —
- Monthly cashflow
- —
- DSCR
- —
- Eligible?
- —
No personal income docs; deal must DSCR.
Hard money
10% down · 12.0% · 12mo
- Down + closing
- —
- Monthly P&I
- —
- Monthly cashflow
- —
- DSCR
- —
- Eligible?
- —
Short-term bridge; refi at stabilization.
Rent comps 1 comps
| Address | Beds | Baths | Sqft | Rent | $/sqft | DOM | Units | Dist |
|---|---|---|---|---|---|---|---|---|
| 286 Cherry Birch LN Masaryktown, FL | 3.0 | 1.0–2.0 | 964 | $1,884 | $1.95 | 1d | 44 | 1.46mi |
Listing history 21 events
-
2026-06-18price $79,000 Active 42 DOM
-
2026-06-18days on market $79,999 Active 42 DOM
-
2026-06-17days on market $79,999 Active 41 DOM
-
2026-06-16days on market $79,999 Active 40 DOM
-
2026-06-15days on market $79,999 Active 39 DOM
-
2026-06-13pricedays on market $79,999 Active 37 DOM
-
2026-06-13days on market $82,999 Active 36 DOM
-
2026-06-09days on market $82,999 Active 33 DOM
-
2026-06-08pricedays on market $82,999 Active 32 DOM
-
2026-06-07days on market $84,999 Active 31 DOM
-
2026-06-04days on market $84,999 Active 28 DOM
-
2026-06-03days on market $84,999 Active 27 DOM
-
2026-06-02pricedays on market $84,999 Active 26 DOM
-
2026-06-01days on market $89,000 Active 25 DOM
-
2026-05-31days on market $89,000 Active 24 DOM
-
2026-05-18price $89,999
-
2026-05-07$94,999 Active
-
2002-06-05soldstatus $15,000
-
2000-02-10soldstatus $15,000
-
1998-09-01soldstatus $8,500
-
1996-08-09soldstatus $12,000
ⓘ Source: listings_history table (triggers on properties + properties_extension) + one-shot
backfill from property_details.listing_events for pre-trigger history.
Tax reassessment forecast FL · Resets to sale price
- Current annual tax
- $1,086 · $90/mo
- Projected year-2 tax
- $1,086 · $90/mo
- Expected delta
- $0/yr ($0/mo · 0.0%)
ⓘ Screening estimate from a state-policy table — verify with the county assessor before closing.
Climate risk First Street
- Flood 1/10 Low FEMA zone X (unshaded) · 0% chance over 30 yrs
- Wildfire 5/10 Major
- Heat 9/10 Extreme 7 d/yr ≥109°F today · 25 d/yr by 30 yrs out
- Wind 10/10 Extreme 99% chance of damaging wind over 30 yrs
- Air quality 2/10 Low 1 unhealthy d/yr today · 1 by 30 yrs out
Nearby sold comps map
Loading sold comps map…
Walkable amenities ~0.75 mi
Loading nearby amenities…
Taxation est. · year 1
- Rental income
- $21,582
- − Mortgage interest
- −$4,425
- − Property taxes
- −$1,086
- − Insurance
- −$395
- − Repairs & maintenance
- −$1,727
- − Management
- −$1,727
- − Depreciation
- −$2,298
- Taxable income
- $9,925
- Est. tax owed @ 24.0%
- −$2,382
- After-tax cash flow
- $8,216/yr
For passive investors: Depreciation is non-cash, so a rental often shows a tax loss while cash-flowing — sheltering income. Rental losses are passive: they offset passive income freely, and up to $25,000/yr can offset ordinary (W-2) income if you actively participate and your MAGI is under $100k (phasing out to $0 by $150k); unused losses carry forward. On sale, claimed depreciation is recaptured at up to 25%, and gains may owe capital-gains tax (a 1031 exchange can defer both). Figures are a year-1 estimate at your 24.0% rate — not tax advice; consult a CPA.
Schools (NCES district)
- District
- Hernando
- NCES district ID
- 1200810
- Math proficiency
- 50% ▼ -8.00%
- Reading proficiency
- 50% ▼ -4.00%
- Median HH income
- $41,985
- Composite
- 42.03/100
- National rank
- #3329
- State rank
- #38 of 73 in FL
Livability — Garden Grove
- Score
- 64/100
- State rank
- #667
- US rank
- #13693
Category grades
Schools grade is shown separately in the Schools card above.
Census & demographics
- Census place
- Garden Grove, FL
- County
- Hernando County · 169,677 people
- City population
- 13,964
- Metro
- Tampa-St. Petersburg-Clearwater, FL
- Population (ZIP)
- 13,642
- Household income
- $84,833
- Rent vs Own
- Severe rent burden
- 142.0
Population outlook (Hernando County) Hauer SSP2
- Today (2025)
- 189,218 people
- By 2030
- 194,367 · +2.7%
- By 2040
- 203,398 · +7.5%
- By 2050
- 209,589 · +10.8%
- By 2075
- 218,452 · +15.4%
- By 2100
- 205,923 · +8.8%
Race, ethnicity, and origin ACS 2023
- Neighborhood character
- Predominantly White (74%)
- Race & ethnicity
- White 74% Hispanic / Latino 16% Two or more races 10% Black 3% Asian 2%
- Hispanic origin (detail)
- Mexican 1% Puerto Rican 10% Cuban 3%
- Common ancestry
- Romanian 3% Lithuanian 2% Scotch-Irish 2%
- Foreign-born
- 4% · Canada
- Languages at home
- 89% English-only · Spanish 8% Other Indo-European 1% Russian/Polish/Slavic 1%
Political lean MEDSL · Hernando
- 2024 margin
- Solid R (+37.0) · D 31.1% · R 68.2%
- 2008→2024 swing
- -33.5pp toward R · 2008: -3.6pp · 2024: -37.0pp
- All cycles
- 2024: R+37.0 2020: R+30.2 2016: R+29.0 2012: R+8.5 2008: R+3.6
Not yet ingested
- Civics
- —
Market trends
- HPI YoY
- ▼ -84.38%
- Current HPI
- 276.4751
- Rent YoY
- ▲ 1.61%
- Metro
- Tampa-St. Petersburg-Clearwater, FL
- State GDP YoY
- ▲ 3.28%
- F500 in state
- 36
Industry mix (Fortune 500 HQ in FL)
| Industry | F500 HQs | Revenue |
|---|---|---|
| Industrial Technology | 2 | $29B |
|
||
| Insurance | 2 | $17B |
|
||
| Retail | 1 | $60B |
|
||
| Technology Distribution | 1 | $58B |
|
||
| Homebuilding | 1 | $35B |
|
||
| Technology Manufacturing | 1 | $35B |
|
||
Price history
+650.0% since first listed6 events — show timeline
- 2026-05-18 Price Changed $89,999 Stellar MLS as Distributed by MLS Grid
- 2026-05-07 Listed $94,999 Stellar MLS as Distributed by MLS Grid
- 2002-06-05 Sold (Public Records) $15,000 Public Records
- 2000-02-10 Sold (Public Records) $15,000 Public Records
- 1998-09-01 Sold (Public Records) $8,500 Public Records
- 1996-08-09 Sold (Public Records) $12,000 Public Records
Property tax history
+6.7%/yrLatest (2025): $1,086 · -0.7% YoY. Source: county tax records.
Cash-flow waterfall
monthlySold comps — $/sqft
last 12 mo · ≤1 miLoading sold comps…