17-19 Limekiln Rd · Phillipsburg, NJ
Flood risk 8/10 · Major
- FEMA flood zone
- X (unshaded)
- Chance of flooding over 30 yrs
- 0.78%
- Est. flood insurance / yr
- $507 – $1,088
Fire risk 2/10 · Minimal
- Est. fire insurance / yr
- $526 – $976
Heat risk 5/10 · Moderate
- Hot days now (above 100°F)
- 7 days/yr
- Hot days in 30 yrs
- 16 days/yr
Wind risk 4/10 · Minor
- Chance of severe wind over 30 yrs
- 19.0%
Air-quality risk 3/10 · Minor
- Unhealthy air days now
- 3 days/yr
- Unhealthy air days in 30 yrs
- 5 days/yr
Risk factors via First Street. Map © Google.
Why this score? — see what drove the C+ grade
The composite is a weighted blend of 9 inputs, each scored 0–100. Each bar is that input's sub-score; the figure is the points it added to the 100-point composite (weight × sub-score).
- Cash flow +21.7/30.0
- ARV discount +15.0/15.0
- DSCR +6.9/10.0
- 1% rule +5.7/10.0
- Condition / age +4.0/5.0
- Livability +3.8/5.0
- Rent growth +3.6/5.0
- Schools +2.3/10.0
- Appreciation +0.0/10.0
$269,999
🖨 Deal sheet 📄 Offer letter ✓ Due diligence
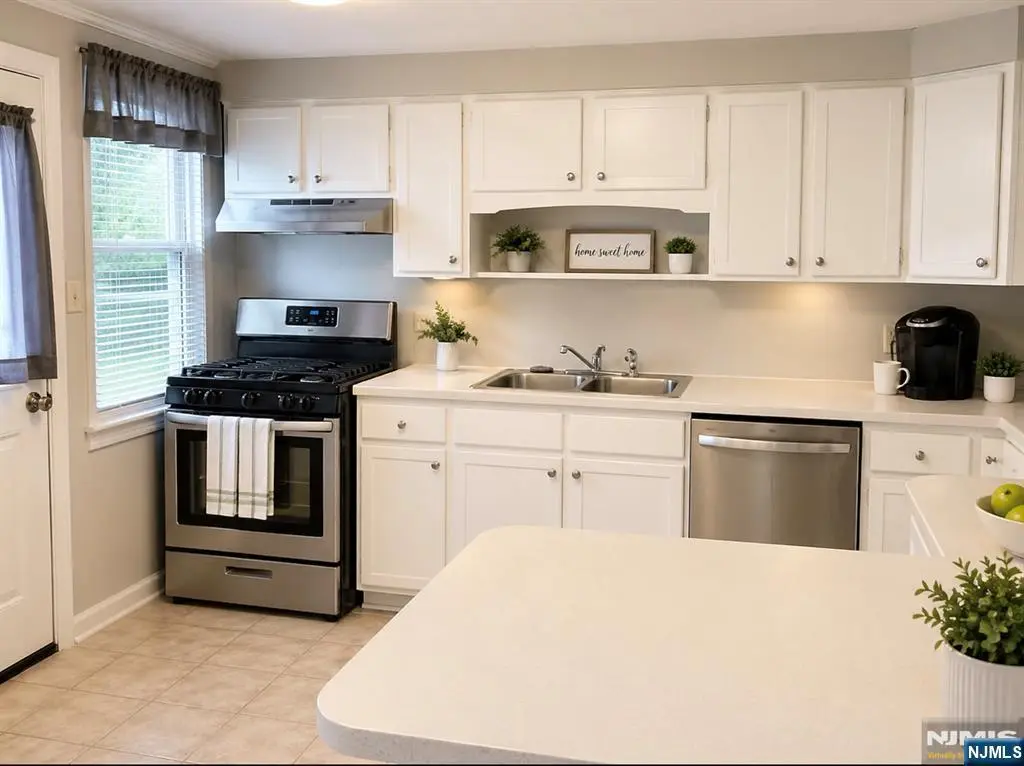
Listing remarks
Customer Remarks: Well-maintained 3-bedroom, 1-bath duplex located in a desirable residential area of Phillipsburg. This property offers a functional layout with spacious living areas, comfortable bedrooms, and plenty of natural light throughout. Ideal for owner-occupants or investors, the home provides a great opportunity for steady rental income or multi-generational living. Conveniently situated near major commuting routes including Interstate 78, making travel to surrounding areas simple and efficient. Located within a well-regarded school district and close to local shopping, dining, and everyday conveniences. A solid value with strong potential in a growing area.
Key facts
- Natural light
- Well maintained
- Functional layout
Tags
Property features AI
Finance
- Financial info: Annual tax amount reported
Exterior
- Home design: Duplex (residential income property)
- Construction: Built with other/unspecified construction materials
- Exterior features: No pool
Interior
- Bathrooms: 1 full bathroom
- Heating & cooling: Natural gas heating with forced air; Additional heating details listed in remarks; Window air conditioning units
- Interior features: Partially finished basement; 7 total rooms
Neighborhood map
What this means for you Summary
Snapshot
- This is a 6-bed/2.0-bath single-family listed at $270k. Condition is rated good.
Deal economics
- At list price, monthly cash flow is $351 ($4k/yr) — positive.
- The deal already cash-flows at list — no discount required.
- Meets the 1% rule at list price ($3k rent vs $270k).
- Recommended offer: $262k (3.0% below list) — sets the bar for market timing.
- Cap rate 8.1% vs local median 4.9% in Phillipsburg — top-decile yield for the area; either an underpriced asset or a hidden risk that comps aren't pricing in. Stress-test before assuming the spread holds.
Location & tenants
- Location reads 76/100 on livability (#135 in NJ, #3,552 nationally) — a middle-class / working-renter tenant base. Strengths: housing A+, health & safety A+, cost of living A; Watch: commute F.
- Phillipsburg School District (suburban): math 17% / reading 37% proficiency, ranked #381 of 472 in NJ (top 81%) — low school quality limits family demand, transient renter base, plan for 1-2y turnover.
- Zoned schools: Phillipsburg Elementary School (math 10% / reading 26%, grade F, #1,049 of 1,303 statewide, top 81%, 595 students, 75% FRL); Phillipsburg High School (math 27% / reading 51%, grade F, #197 of 399 statewide, top 51%, 1,794 students, 32% FRL) — zoned schools at 54% FRL track the district average.
- Market conditions: Rents rising fast (+4.4%/yr); 24 active listings in the ZIP; 1 comparable units currently listed for rent nearby; solid renter incomes; 630 units permitted in Warren County in 2024 (315 in 5+ unit buildings).
- This rent runs 43% of the median local income ($80k/yr) — at the standard rent-burdened threshold; future hikes will face affordability resistance.
Forward outlook
- Local home prices are declining (-3.0%/yr); year-one equity from $2k of loan paydown is wiped out by about $8k of value loss. Plan a longer hold.
- Warren County population projected at -10% by 2050 — secular population decline; favor cash flow + early exit over multi-decade hold.
Negotiation context
- It's been on market 45 days — a 3% lower offer ($262k) is reasonable based on typical stale-listing flexibility.
- 2 sale attempts since 3y ago with the ask held roughly flat each time — persistent listings suggest the price (not the market) is what's stuck; bring a comps-based counter.
- Current owner paid $205k; 32% above their basis — modest negotiation headroom, anchor on the comps not their cost.
Risks & watch-outs
- Watch-outs: flood insurance adds $66/mo.
- Climate carrying-cost: severe flood risk; extreme-heat days projected 7→16/yr by 2055 (HVAC capex compounding) — expect insurance premiums to compound above CPI over the hold.
Questions for the listing agent
- It's been on market 45 days. Have you received any prior offers? Is the seller open to a 3% concession, seller financing, or rate buy-down credit?
- What's the actual annual flood-insurance premium (NFIP or private), and is the property in a SFHA with mandatory coverage?
- Is there a deadline driving the sale (1031 exchange, divorce, estate, relocation)? That informs how much negotiation room exists.
- What's the average days-on-market for RENTAL listings here right now (not sales)? A rising rental-DOM trend means longer vacancies and softer asking-rent achievability than the comps imply.
- What's the recent tenant-quality profile in this submarket — average credit score on applications, eviction rate, late-payment / NSF rate, and stable-employment percentage? A property-management company in the area should have these aggregated.
- How much new for-sale + rental construction is in the pipeline within 1–3 miles? Heavy new supply typically softens prices + rents 12–24 months out; constrained supply supports both.
Investment metrics
- 1% rule
- 1.07% ✓
- Cap rate
- 8.15%
- Cash-on-cash
- 6.62%
- DSCR
- 1.29
- GRM
- 7.8
CMA / ARV
- ARV (median comp)
- $447,497
- List price
- $269,999
- Delta
- -39.66%
- Verdict
- UNDERPRICED
- Comps
- 13 within 2.0 mi
Show comp detail 7 sales within ~0.75 mi
| Address | Dist | Beds/Ba | Sqft | Sold | Price | $/sf | Match |
|---|---|---|---|---|---|---|---|
| 288 Mercer St | 0.39mi | 6/2.0 | — | 3mo | $280,000 | — | 67 |
| 601 S Main St | 0.26mi | 5/2.5 (-1) | — | 5mo | $305,000 | — | 64 |
| 903 Carhart St | 0.45mi | 6/3.5 | — | 7mo | $460,000 | — | 55 |
| 833 Culkin St | 0.52mi | 5/2.0 (-1) | — | 6mo | $406,500 | — | 53 |
| 857 Columbus Ave | 0.48mi | 5/1.5 (-1) | 1,494 | 18mo | $275,000 | $184 | 43 |
| 521 Parkwood Ct | 0.68mi | 5/3.0 (-1) | — | 9mo | $549,900 | — | 39 |
| 5 Colby Pl | 0.69mi | 5/2.0 (-1) | — | 23mo | $320,000 | — | 31 |
Match score weights: distance 35% · size 25% · config 20% · recency 20%. Top-matched comps best support the ARV.
Projected returns pro-forma
-3.0% appreciation · 4.41% rent growth · sell at horizon
- IRR
- -6.0%
- Equity multiple
- 0.77×
- Total profit
- $-17,170
- Equity at exit
- $40,258
- IRR
- 5.3%
- Equity multiple
- 1.42×
- Total profit
- $31,715
- Equity at exit
- $23,345
Cash invested: $75,600 (down + closing). Projections, not guarantees.
Landlord ↔ Tenant lean methodology
- Overall (STATE)
- 21 Tenant-Leaning
- State New Jersey
- 21 Tenant-Leaning · D+6
- County
- — inherits STATE
- City
- — inherits STATE
ZIP-level market 08865
- Rents YoY
- 4.4%
- Active inventory
- 24
- Price-to-rent
- 7.8×
Monthly cashflow live
- Estimated rent
- $2,890 medium interval (Pro) →
- Mortgage (P&I)
- −$1,416
- Tax est. 1.5%
- −$337 /mo · $4,050/yr
- Insurance
- −$112
- Flood insurance flood zone
- −$66 /mo · $798/yr
- HOA
- −$0
- Vacancy / Maint / Mgmt
- −$607
- Net cashflow
- $351
Break-even live
UW: 25.0% down · 7.5% · 30yr · 1.5% tax · 5.0% vac · 8.0% maint · 8.0% mgmt
Financing live
Cash to close
- Down payment
- $67,500
- Closing costs
- $8,100
- Reserves months
- —
- Total cash needed
- —
Loan-product check · same deal, 3 products live
Conventional
25% down · 7.5% · 30yr
- Down + closing
- —
- Monthly P&I
- —
- Monthly cashflow
- —
- DSCR
- —
- Eligible?
- —
Personal DTI + credit; lowest rate.
DSCR
20% down · 8.5% · 30yr
- Down + closing
- —
- Monthly P&I
- —
- Monthly cashflow
- —
- DSCR
- —
- Eligible?
- —
No personal income docs; deal must DSCR.
Hard money
10% down · 12.0% · 12mo
- Down + closing
- —
- Monthly P&I
- —
- Monthly cashflow
- —
- DSCR
- —
- Eligible?
- —
Short-term bridge; refi at stabilization.
Rent comps 1 comps
| Address | Beds | Baths | Sqft | Rent | $/sqft | DOM | Units | Dist |
|---|---|---|---|---|---|---|---|---|
| 786 S Main St Unit 2 Phillipsburg, NJ | 5.0 | 2.0 | — | $2,700 | — | 43d | 1 | 0.16mi |
Listing history 21 events
-
2026-06-18days on market $269,999 Active 45 DOM
-
2026-06-17days on market $269,999 Active 44 DOM
-
2026-06-16days on market $269,999 Active 43 DOM
-
2026-06-15days on market $269,999 Active 42 DOM
-
2026-06-14days on market $269,999 Active 40 DOM
-
2026-06-13days on market $269,999 Active 39 DOM
-
2026-06-10days on market $269,999 Active 37 DOM
-
2026-06-09days on market $269,999 Active 36 DOM
-
2026-06-08days on market $269,999 Active 35 DOM
-
2026-06-07days on market $269,999 Active 34 DOM
-
2026-06-05days on market $269,999 Active 31 DOM
-
2026-06-03days on market $269,999 Active 30 DOM
-
2026-06-02days on market $269,999 Active 29 DOM
-
2026-06-01days on market $269,999 Active 28 DOM
-
2026-05-31days on market $269,999 Active 27 DOM
-
2026-05-31days on market $269,999 Active 26 DOM
-
2026-05-04$269,999 Active 677-char remark
-
2023-09-20soldstatus $205,000 Sold
-
2023-08-21status Under Contract
-
2023-08-07$189,900 Active
-
2023-08-06historical $189,900
ⓘ Source: listings_history table (triggers on properties + properties_extension) + one-shot
backfill from property_details.listing_events for pre-trigger history.
Climate risk First Street
- Flood 8/10 Severe FEMA zone X (unshaded) · 78% chance over 30 yrs
- Wildfire 2/10 Low
- Heat 5/10 Major 7 d/yr ≥100°F today · 16 d/yr by 30 yrs out
- Wind 4/10 Moderate 19% chance of damaging wind over 30 yrs
- Air quality 3/10 Moderate 3 unhealthy d/yr today · 5 by 30 yrs out
Nearby sold comps map
Loading sold comps map…
Walkable amenities ~0.75 mi
Loading nearby amenities…
Taxation est. · year 1
- Rental income
- $34,680
- − Mortgage interest
- −$15,124
- − Property taxes
- −$4,050
- − Insurance
- −$2,147
- − Repairs & maintenance
- −$2,774
- − Management
- −$2,774
- − Depreciation
- −$7,855
- Taxable loss
- −$45
- Est. tax savings @ 24.0%
- +$11
- After-tax cash flow
- $4,220/yr
For passive investors: Depreciation is non-cash, so a rental often shows a tax loss while cash-flowing — sheltering income. Rental losses are passive: they offset passive income freely, and up to $25,000/yr can offset ordinary (W-2) income if you actively participate and your MAGI is under $100k (phasing out to $0 by $150k); unused losses carry forward. On sale, claimed depreciation is recaptured at up to 25%, and gains may owe capital-gains tax (a 1031 exchange can defer both). Figures are a year-1 estimate at your 24.0% rate — not tax advice; consult a CPA.
Condition & rehab AI · 12 photos
A well-maintained, move-in-ready home with good condition and potential for further improvements.
Value-add opportunities
- Both Paint the exterior siding — Enhances curb appeal and value
- Both Replace window treatments — Improves energy efficiency and aesthetics
- Both Install a smart thermostat — Saves energy and improves comfort
- Both Add a smart lock — Enhances security and convenience
Renovation cost estimate screening
Value-add ROI direction
- Both Paint the exterior siding — Enhances curb appeal and value ↑
- Both Replace window treatments — Improves energy efficiency and aesthetics ↑
- Both Install a smart thermostat — Saves energy and improves comfort ↑
- Both Add a smart lock — Enhances security and convenience ↑
ⓘ Cost ranges are severity-bucket heuristics (US national rule-of-thumb). Get contractor quotes + a written scope before underwriting a rehab budget.
Schools (NCES district)
- District
- Phillipsburg School District
- NCES district ID
- 3412960
- Math proficiency
- 17% ▼ -15.00%
- Reading proficiency
- 37% ▼ -9.00%
- Median HH income
- $45,364
- Composite
- 23.2/100
- National rank
- #7943
- State rank
- #381 of 472 in NJ
Livability — Phillipsburg
- Score
- 76/100
- State rank
- #135
- US rank
- #3552
Category grades
Schools grade is shown separately in the Schools card above.
Census & demographics
- Census place
- Phillipsburg, NJ
- County
- Warren County · 63,532 people
- City population
- 31,427
- Metro
- Allentown-Bethlehem-Easton, PA-NJ
- Population (ZIP)
- 31,427
- Household income
- $79,949
- Rent vs Own
- Severe rent burden
- 1284.0
Population outlook (Warren County) Hauer SSP2
- Today (2025)
- 105,498 people
- By 2030
- 103,974 · -1.4%
- By 2040
- 99,748 · -5.5%
- By 2050
- 94,535 · -10.4%
- By 2075
- 87,220 · -17.3%
- By 2100
- 80,421 · -23.8%
Race, ethnicity, and origin ACS 2023
- Neighborhood character
- Predominantly White (70%)
- Race & ethnicity
- White 70% Hispanic / Latino 13% Black 10% Two or more races 9% Asian 3% Native American 1%
- Hispanic origin (detail)
- Mexican 1% Puerto Rican 5%
- Common ancestry
- Romanian 5% Iranian 2% Slovak 2%
- Foreign-born
- 10% · Canada, Jamaica, China
- Languages at home
- 86% English-only · Spanish 7% Other Indo-European 2% Russian/Polish/Slavic 1%
Political lean MEDSL · Warren
- 2024 margin
- Strong R (+20.7) · D 38.8% · R 59.5% · Other 1.8%
- 2008→2024 swing
- -6.7pp toward R · 2008: -14.0pp · 2024: -20.7pp
- All cycles
- 2024: R+20.7 2020: R+16.2 2016: R+25.6 2012: R+15.8 2008: R+14.0
Not yet ingested
- Civics
- —
Market trends
- HPI YoY
- ▼ -240.76%
- Current HPI
- 238.2423
- Rent YoY
- ▲ 4.41%
- Metro
- Allentown-Bethlehem-Easton, PA-NJ
- State GDP YoY
- ▲ 2.05%
- F500 in state
- 34
Industry mix (Fortune 500 HQ in NJ)
| Industry | F500 HQs | Revenue |
|---|---|---|
| Consumer Goods | 3 | $31B |
|
||
| Pharmaceuticals | 2 | $153B |
|
||
| Technology | 2 | $21B |
|
||
| Insurance | 2 | $20B |
|
||
| Healthcare | 2 | $19B |
|
||
| Financial Services | 1 | $70B |
|
||
Price history
+42.2% since first listed5 events — show timeline
- 2026-05-04 Listed $269,999 NJMLS
- 2023-09-20 Sold (MLS) $205,000 GSMLS
- 2023-08-21 Pending — GSMLS
- 2023-08-07 Listed $189,900 GSMLS
- 2023-08-06 Coming Soon $189,900 GSMLS
Cash-flow waterfall
monthlySold comps — $/sqft
last 12 mo · ≤1 miLoading sold comps…