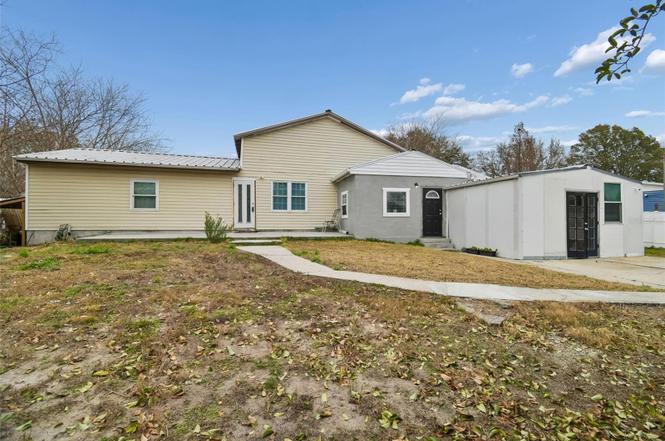
5723 Cherry Tree Dr · Medulla, FL
Flood risk 1/10 · Minimal
- FEMA flood zone
- X (unshaded)
- Chance of flooding over 30 yrs
- 0.0%
- Est. flood insurance / yr
- $507 – $1,088
Fire risk 2/10 · Minimal
- Est. fire insurance / yr
- $947 – $1,759
Heat risk 9/10 · Severe
- Hot days now (above 108°F)
- 7 days/yr
- Hot days in 30 yrs
- 25 days/yr
Wind risk 9/10 · Severe
- Chance of severe wind over 30 yrs
- 99.0%
Air-quality risk 2/10 · Minimal
- Unhealthy air days now
- 1 days/yr
- Unhealthy air days in 30 yrs
- 2 days/yr
Risk factors via First Street. Map © Google.
Why this score? — see what drove the B- grade
The composite is a weighted blend of 9 inputs, each scored 0–100. Each bar is that input's sub-score; the figure is the points it added to the 100-point composite (weight × sub-score).
- Cash flow +30.0/30.0
- 1% rule +10.0/10.0
- DSCR +10.0/10.0
- ARV discount +7.5/15.0
- Schools +3.5/10.0
- Livability +3.3/5.0
- Rent growth +2.5/5.0
- Condition / age +2.5/5.0
- Appreciation +0.0/10.0
$100,000
🖨 Deal sheet 📄 Offer letter ✓ Due diligence
Listing remarks
Under contract-accepting backup offers. CALLING ALL INVESTORS AND VISIONARIES! This creative fixer-upper is a choose-your-own-adventure property with THREE SEPARATE LIVING SPACES, all under one roof. Possible In Law Quarters. UNLIMITED POTENTIAL. DOOR NUMBER ONE: A stylish, cozy 1-bedroom with full kitchen, bath, and living area. Completely remodeled, move-in-ready, and honestly. .. CUTE AS A BUTTON. DOOR NUMBER TWO: Renovation is underway but waiting for its final glow-up. This space features a dramatic living room with soaring ceilings, a full kitchen and bath, plus a huge bedroom you step down into, complete with its OWN PRIVATE ENTRANCE. Big bones, big possibilities. DOOR NUMBER THREE
Key facts
- Dramatic living room
- Completely remodeled
- Studio style space
Tags
Property features AI
Finance
- Other: Property classified as residential manufactured home; Unfurnished; No CDD; No homestead indicated; Universal property identifier available
- HOA & community: No association reported
Exterior
- Utilities: Public sewer; Water connected; Sewer connected; Cable available; Fire hydrant nearby; No water source listed
- Home design: Manufactured single-wide home; One story; North-facing
- Construction: Metal siding; Metal roof; Crawlspace foundation; Estimated building area listed
- Exterior features: Asphalt road access; Lot dimensions approximately 85 x 125; Lot size about 0.24 acres
Interior
- Kitchen: Range; Refrigerator
- Bedrooms: 3 bedrooms
- Flooring: Ceramic tile; Laminate; Vinyl
- Bathrooms: 3 full bathrooms
- Heating & cooling: Central heating; Central air conditioning
- Interior features: Cathedral ceilings; High ceilings; Vaulted ceilings; Living room/dining room combo; Split bedroom floorplan
- Laundry & utility: Dedicated laundry room; Washer; Dryer
Neighborhood map
What this means for you Summary
Snapshot
- This is a 3-bed/3.0-bath manufactured listed at $100k.
Deal economics
- At list price, monthly cash flow is $752 ($9k/yr) — positive.
- The deal already cash-flows at list — no discount required.
- Meets the 1% rule at list price ($2k rent vs $100k).
- Recommended offer: $94k (6.0% below list) — sets the bar for market timing.
Location & tenants
- Location reads 66/100 on livability (#601 in FL) — a middle-class / working-renter tenant base. Strengths: housing A+, cost of living A-, crime B+; Watch: amenities F, commute F, health & safety D-.
- Polk (suburban): math 39% / reading 43% proficiency, ranked #62 of 73 in FL (top 85%) — families likely to look elsewhere, expect single-tenant / working-renter base with shorter leases.
- Zoned schools: Medulla Elementary School (math 41% / reading 42%, grade F, #1,437 of 2,144 statewide, top 68%, 515 students, 59% FRL); George W. Jenkins Senior High (math 25% / reading 49%, grade F, #340 of 667 statewide, top 52%, 2,451 students, 37% FRL).
- Market conditions: Rents soft (-0.2%/yr); 360 active listings in the ZIP; 8 comparable units currently listed for rent nearby; rentals leasing fast (median 3d on market — plan ~1-2 weeks tenant-placement turnaround); solid renter incomes; 10,384 units permitted in Polk County in 2024 (1,716 in 5+ unit buildings).
Forward outlook
- Local home prices are declining (-3.0%/yr); year-one equity from $691 of loan paydown is wiped out by about $3k of value loss. Plan a longer hold.
- Polk County population projected at +33% by 2050 — long-run rental-demand tailwind backs the buy-and-hold thesis.
- At projected returns (-3.0% appreciation + 0.0% rent growth), your $28k cash investment doubles in ~5 years — after that, you're playing with house money.
Negotiation context
- It's been on market 62 days — a 6% lower offer ($94k) is reasonable based on typical stale-listing flexibility.
- 2 sale attempts; this cycle's ask has dropped $75k (43%) from the opening price — seller is motivated, your offer sets the floor, not the list.
- Current owner paid $12k; list at $100k implies a 700% gain — meaningful room to come down on a strong offer.
Risks & watch-outs
- Climate carrying-cost: severe wind risk, 99% chance of damaging wind over 30y; extreme-heat days projected 7→25/yr by 2055 (HVAC capex compounding) — expect insurance premiums to compound above CPI over the hold.
Questions for the listing agent
- It's been on market 62 days. Have you received any prior offers? Is the seller open to a 6% concession, seller financing, or rate buy-down credit?
- Why hasn't it sold? Are there any deal-killer items the seller is aware of (foundation, flood, title, zoning, code violations)?
- Is there a deadline driving the sale (1031 exchange, divorce, estate, relocation)? That informs how much negotiation room exists.
- Schools are D-rated, which usually means shorter tenancies and higher turnover. Who's the typical renter profile here, and what's been the actual vacancy rate?
- What's the average days-on-market for RENTAL listings here right now (not sales)? A rising rental-DOM trend means longer vacancies and softer asking-rent achievability than the comps imply.
- What's the recent tenant-quality profile in this submarket — average credit score on applications, eviction rate, late-payment / NSF rate, and stable-employment percentage? A property-management company in the area should have these aggregated.
- How much new for-sale + rental construction is in the pipeline within 1–3 miles? Heavy new supply typically softens prices + rents 12–24 months out; constrained supply supports both.
Investment metrics
- 1% rule
- 1.75% ✓
- Cap rate
- 15.32%
- Cash-on-cash
- 32.22%
- DSCR
- 2.43
- GRM
- 4.8
CMA / ARV
No comps found within radius.
Projected returns pro-forma
-3.0% appreciation · 0.0% rent growth · sell at horizon
- IRR
- 23.9%
- Equity multiple
- 1.95×
- Total profit
- $26,548
- Equity at exit
- $14,910
- IRR
- 29.9%
- Equity multiple
- 3.32×
- Total profit
- $64,930
- Equity at exit
- $8,646
Cash invested: $28,000 (down + closing). Projections, not guarantees.
Landlord ↔ Tenant lean methodology
- Overall (STATE)
- 87 Strongly Landlord-Friendly
- State Florida
- 87 Strongly Landlord-Friendly · R+3
- County
- — inherits STATE
- City
- — inherits STATE
ZIP-level market 33811
- Home prices YoY
- -26.2%
- Rents YoY
- -0.2%
- Active inventory
- 360
- Price-to-rent
- 4.8×
Monthly cashflow live
- Estimated rent
- $1,748 high interval (Pro) →
- Mortgage (P&I)
- −$524
- Tax from tax record
- −$63 /mo · $760/yr
- Insurance
- −$42
- HOA
- −$0
- Vacancy / Maint / Mgmt
- −$367
- Net cashflow
- $752
Break-even live
UW: 25.0% down · 7.5% · 30yr · 1.5% tax · 5.0% vac · 8.0% maint · 8.0% mgmt
Financing live
Cash to close
- Down payment
- $25,000
- Closing costs
- $3,000
- Reserves months
- —
- Total cash needed
- —
Loan-product check · same deal, 3 products live
Conventional
25% down · 7.5% · 30yr
- Down + closing
- —
- Monthly P&I
- —
- Monthly cashflow
- —
- DSCR
- —
- Eligible?
- —
Personal DTI + credit; lowest rate.
DSCR
20% down · 8.5% · 30yr
- Down + closing
- —
- Monthly P&I
- —
- Monthly cashflow
- —
- DSCR
- —
- Eligible?
- —
No personal income docs; deal must DSCR.
Hard money
10% down · 12.0% · 12mo
- Down + closing
- —
- Monthly P&I
- —
- Monthly cashflow
- —
- DSCR
- —
- Eligible?
- —
Short-term bridge; refi at stabilization.
Rent comps 8 comps
| Address | Beds | Baths | Sqft | Rent | $/sqft | DOM | Units | Dist |
|---|---|---|---|---|---|---|---|---|
| 1089 Old South Dr Lakeland, FL | 2.0 | 1.0 | 764 | $1,225 | $1.60 | 3d | 1 | 0.19mi |
| 5527 Gaur Ln Lakeland, FL | 2.0 | 2.0 | 942 | $1,550 | $1.65 | 23d | 1 | 0.27mi |
| 1143 Old South Dr Lakeland, FL | 2.0 | 2.0 | 1008 | $1,299 | $1.29 | 3d | 1 | 0.29mi |
| 5133 Old Road 37 Mulberry, FL | 2.0 | 2.0 | 1050 | $1,565 | $1.49 | 3d | 1 | 0.82mi |
| 4917 Malibu Ct Lakeland, FL | 2.0 | 1.0 | 822 | $1,195 | $1.45 | 3d | 1 | 1.01mi |
| 1448 Marigold Dr Lakeland, FL | 3.0 | 2.0 | 1055 | $1,055 | $1.00 | 3d | 1 | 1.35mi |
| 6720 S Florida Ave Lakeland, FL | 1.0–3.0 | 1.0–2.0 | 1108 | $1,964 | $1.77 | 3d | 8 | 1.37mi |
| 1028 Harden Ct Lakeland, FL | 2.0 | 2.0 | 891 | $1,200 | $1.35 | 23d | 1 | 1.38mi |
Listing history 9 events
-
2026-05-07status Pending
-
2026-05-01price $100,000
-
2026-04-02status Active
-
2026-03-24status Pending
-
2026-03-20price $120,000
-
2026-03-14price $150,000
-
2026-02-25$175,000 Active
-
1998-06-23soldstatus $12,500
-
1998-06-23soldstatus $13,500
ⓘ Source: listings_history table (triggers on properties + properties_extension) + one-shot
backfill from property_details.listing_events for pre-trigger history.
Tax reassessment forecast FL · Resets to sale price
- Current annual tax
- $760 · $63/mo
- Projected year-2 tax
- $830 · $69/mo
- Expected delta
- +$70/yr (+$6/mo · 9.2%)
ⓘ Screening estimate from a state-policy table — verify with the county assessor before closing.
Climate risk First Street
- Flood 1/10 Low FEMA zone X (unshaded) · 0% chance over 30 yrs
- Wildfire 2/10 Low
- Heat 9/10 Extreme 7 d/yr ≥108°F today · 25 d/yr by 30 yrs out
- Wind 9/10 Extreme 99% chance of damaging wind over 30 yrs
- Air quality 2/10 Low 1 unhealthy d/yr today · 2 by 30 yrs out
Nearby sold comps map
Loading sold comps map…
Walkable amenities ~0.75 mi
Loading nearby amenities…
Taxation est. · year 1
- Rental income
- $20,982
- − Mortgage interest
- −$5,602
- − Property taxes
- −$760
- − Insurance
- −$500
- − Repairs & maintenance
- −$1,679
- − Management
- −$1,679
- − Depreciation
- −$2,909
- Taxable income
- $7,854
- Est. tax owed @ 24.0%
- −$1,885
- After-tax cash flow
- $7,138/yr
For passive investors: Depreciation is non-cash, so a rental often shows a tax loss while cash-flowing — sheltering income. Rental losses are passive: they offset passive income freely, and up to $25,000/yr can offset ordinary (W-2) income if you actively participate and your MAGI is under $100k (phasing out to $0 by $150k); unused losses carry forward. On sale, claimed depreciation is recaptured at up to 25%, and gains may owe capital-gains tax (a 1031 exchange can defer both). Figures are a year-1 estimate at your 24.0% rate — not tax advice; consult a CPA.
Schools (NCES district)
- District
- Polk
- NCES district ID
- 1201590
- Math proficiency
- 39% ▼ -11.00%
- Reading proficiency
- 43% ▼ -4.00%
- Median HH income
- $43,979
- Composite
- 34.74/100
- National rank
- #5132
- State rank
- #62 of 73 in FL
Livability — Medulla
- Score
- 66/100
- State rank
- #601
- US rank
- #11528
Category grades
Schools grade is shown separately in the Schools card above.
Census & demographics
- Census place
- Medulla, FL
- County
- Polk County · 740,051 people
- Metro
- Lakeland-Winter Haven, FL
- Population (ZIP)
- 29,472
- Household income
- $90,263
- Rent vs Own
- Severe rent burden
- 477.0
Population outlook (Polk County) Hauer SSP2
- Today (2025)
- 752,975 people
- By 2030
- 804,621 · +6.9%
- By 2040
- 906,117 · +20.3%
- By 2050
- 1,000,476 · +32.9%
- By 2075
- 1,197,520 · +59.0%
- By 2100
- 1,271,518 · +68.9%
Race, ethnicity, and origin ACS 2023
- Neighborhood character
- Majority White (63%)
- Race & ethnicity
- White 63% Hispanic / Latino 23% Two or more races 14% Black 8% Asian 1%
- Hispanic origin (detail)
- Mexican 6% Puerto Rican 5% Cuban 4%
- Common ancestry
- Italian 3% Lithuanian 2% Slovak 2%
- Foreign-born
- 8% · Canada, Jamaica
- Languages at home
- 83% English-only · Spanish 14% French/Haitian/Cajun 1% Tagalog/Filipino 1%
Political lean MEDSL · Polk
- 2024 margin
- Strong R (+20.7) · D 39.2% · R 59.9%
- 2008→2024 swing
- -14.6pp toward R · 2008: -6.1pp · 2024: -20.7pp
- All cycles
- 2024: R+20.7 2020: R+14.4 2016: R+14.1 2012: R+6.8 2008: R+6.1
Not yet ingested
- Civics
- —
Market trends
- HPI YoY
- ▼ -109.57%
- Current HPI
- 309.0061
- Rent YoY
- ▼ -0.19%
- Metro
- Lakeland-Winter Haven, FL
- State GDP YoY
- ▲ 3.28%
- F500 in state
- 36
Industry mix (Fortune 500 HQ in FL)
| Industry | F500 HQs | Revenue |
|---|---|---|
| Industrial Technology | 2 | $29B |
|
||
| Insurance | 2 | $17B |
|
||
| Retail | 1 | $60B |
|
||
| Technology Distribution | 1 | $58B |
|
||
| Homebuilding | 1 | $35B |
|
||
| Technology Manufacturing | 1 | $35B |
|
||
Price history
+700.0% since first listed9 events — show timeline
- 2026-05-07 Pending — Stellar MLS as Distributed by MLS Grid
- 2026-05-01 Price Changed $100,000 Stellar MLS as Distributed by MLS Grid
- 2026-04-02 Relisted — Stellar MLS as Distributed by MLS Grid
- 2026-03-24 Pending — Stellar MLS as Distributed by MLS Grid
- 2026-03-20 Price Changed $120,000 Stellar MLS as Distributed by MLS Grid
- 2026-03-14 Price Changed $150,000 Stellar MLS as Distributed by MLS Grid
- 2026-02-25 Listed $175,000 Stellar MLS as Distributed by MLS Grid
- 1998-06-23 Sold (Public Records) $13,500 Public Records
- 1998-06-23 Sold (Public Records) $12,500 Public Records
Property tax history
+7.4%/yrLatest (2025): $760 · +19.8% YoY. Source: county tax records.
Cash-flow waterfall
monthlySold comps — $/sqft
last 12 mo · ≤1 miLoading sold comps…