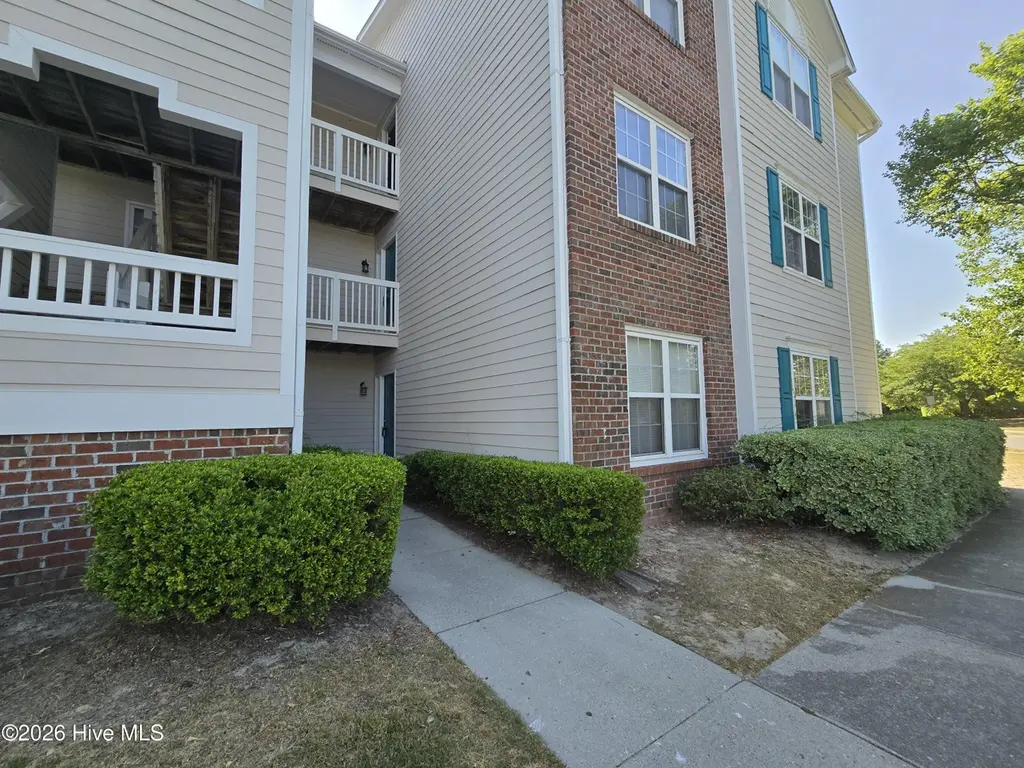
802 Bryce Ct Unit D · Wilmington, NC
Flood risk 1/10 · Minimal
- FEMA flood zone
- X (unshaded)
- Chance of flooding over 30 yrs
- 0.0%
- Est. flood insurance / yr
- $507 – $1,088
Fire risk 4/10 · Minor
- Est. fire insurance / yr
- $906 – $1,684
Heat risk 9/10 · Severe
- Hot days now (above 104°F)
- 7 days/yr
- Hot days in 30 yrs
- 19 days/yr
Wind risk 8/10 · Major
- Chance of severe wind over 30 yrs
- 99.0%
Air-quality risk 2/10 · Minimal
- Unhealthy air days now
- 1 days/yr
- Unhealthy air days in 30 yrs
- 2 days/yr
Risk factors via First Street. Map © Google.
Why this score? — see what drove the D grade
The composite is a weighted blend of 9 inputs, each scored 0–100. Each bar is that input's sub-score; the figure is the points it added to the 100-point composite (weight × sub-score).
- Cash flow +11.9/30.0
- ARV discount +7.5/15.0
- Schools +4.3/10.0
- 1% rule +4.1/10.0
- DSCR +3.5/10.0
- Rent growth +3.5/5.0
- Livability +3.5/5.0
- Condition / age +2.5/5.0
- Appreciation +0.0/10.0
$203,000
🖨 Deal sheet (PDF) 📄 Offer letter ✓ Due diligence
Listing remarks MLS
Looking for a refreshed first floor 3 bedroom condo? This spacious unit checks all the boxes as a perfect investment, second home, or full-time home with low maintenance. This end unit offers additional privacy. The unit has been freshly painted, and new blinds plus LVP flooring installed. The open living and dining room have windows only an end unit would afford. Head out the French doors to to a patio for outdoor enjoyment. A storage closet provides space for beach toys and holiday decorations. The owners suite offers a walk-in closet plus en suite bath with a jetted tub and separate shower. Two additional bedrooms and a full bathroom add flexibility. There is a newer water heater, microwave oven, and disposal. The seller is also offering a Choice Ultimate Home Warranty. An interior sprinkler system, alarm panel, and night watchman are all included. The HOA covers cable/wifi, trash, master insurance, and all exterior maintenance. Relax for the day and enjoy the community pool, volleyball, tennis, and grilling area. A car wash station and assigned parking are an added bonus. Situated midway between the beach and ILM airport, Cape Cottages community location gives easy access to I-40 /I-140 and MLK Parkway. Less than 10 minutes to the UNCW campus. Target, Costco, restaurants, and shopping are just right around the corner.
Key facts
- Soaking tub
- Private patio
- Walk in closet
Tags
Property features AI
Finance
- Other: Zoning: MD-17; Directions: South on Market St, right onto Lennon Dr, right onto Bryce Ct; first building on your right
- HOA & community: Homeowners association with annual fee of $3,300 ($275/month equivalent); Community pool; Tennis courts; Barbecue amenities; Sidewalks; Subdivision: Cape Cottages
Exterior
- Parking: Assigned parking; Paved parking
- Utilities: Public water; Sewer connected; Water connected
- Home design: Residential condominium; One-level entry; One level (unit); Total of 3 stories in building
- Construction: Vinyl siding with frame construction; Slab foundation; Built with shingle roof
- Exterior features: Covered porch; Porch; No fencing; Shingle roof; Property has a view; Paved road access
Interior
- Kitchen: Electric oven; Dishwasher; Microwave; Refrigerator; Electric water heater
- Bedrooms: Total rooms: 6
- Bathrooms: 2 full bathrooms
- Heating & cooling: Heat pump heating; Electric heating; Central air conditioning
- Interior features: Walk-in closets; Ceiling fans; Unfurnished
- Laundry & utility: Washer; Dryer; Laundry closet
Neighborhood map
What this means for you Summary
Snapshot
- This is a 3-bed/2.0-bath condo listed at $203k.
Deal economics
- At list price, monthly cash flow is $-52 ($-622/yr) — negative.
- To cash-flow at today's rent, offer at most $194k (4.5% below list).
- To meet the 1% rule (rent ≥ 1% of price), the offer needs to be $185k (8.9% below list).
- Recommended offer: $185k (8.9% below list) — sets the bar for 1% rule.
- Cap rate 6.0% vs local median 2.6% in Wilmington — top-decile yield for the area; either an underpriced asset or a hidden risk that comps aren't pricing in. Stress-test before assuming the spread holds.
Location & tenants
- Location reads 70/100 on livability (#142 in NC) — a middle-class / working-renter tenant base. Strengths: health & safety A+, cost of living B+, housing B+; Watch: amenities C-, employment C-, crime F.
- New Hanover County Schools (urban): math 48% / reading 53% proficiency, ranked #61 of 178 in NC (top 34%) — acceptable for families but not a draw, mixed tenant base, ~2y average lease.
- Zoned schools: College Park Elementary (math 23% / reading 33%, grade F, #1,022 of 1,410 statewide, top 73%, 457 students, 99% FRL); M C S Noble Middle (math 57% / reading 62%, grade B, #48 of 475 statewide, top 11%, 652 students, 32% FRL); New Hanover High (math 60% / reading 53%, grade C, #261 of 535 statewide, top 49%, 1,466 students, 100% FRL) — zoned schools average 77% FRL vs 42% district-wide (36 pts higher); higher-poverty schools than district average — tighter screening recommended.
- Market conditions: Rents rising (+3.9%/yr); 191 active listings in the ZIP; 21 comparable units currently listed for rent nearby; rentals at typical pace (median 23d on market — plan ~3-4 weeks tenant-placement turnaround); 2,581 units permitted in New Hanover County in 2024 (1,185 in 5+ unit buildings).
- This rent runs 32% of the median local income ($70k/yr) — at the standard rent-burdened threshold; future hikes will face affordability resistance.
Forward outlook
- Local home prices are declining (-3.0%/yr); year-one equity from $1k of loan paydown is wiped out by about $6k of value loss. Plan a longer hold.
- New Hanover County population projected at +37% by 2050 — long-run rental-demand tailwind backs the buy-and-hold thesis.
Negotiation context
- It's been on market 24 days — a 2% lower offer ($200k) is reasonable based on typical stale-listing flexibility.
- 5 sale attempts since 24y ago; this cycle's ask has dropped $12k (6%) from the opening price — seller is motivated, your offer sets the floor, not the list.
- Current owner paid $165k; 23% above their basis — modest negotiation headroom, anchor on the comps not their cost.
Risks & watch-outs
- Climate carrying-cost: severe wind risk, 99% chance of damaging wind over 30y; extreme-heat days projected 7→19/yr by 2055 (HVAC capex compounding) — expect insurance premiums to compound above CPI over the hold.
Questions for the listing agent
- What do current leases actually rent for vs. the listed asking? Can we see a recent rent roll and the last 12 months of T-12 income?
- What does the HOA fee cover, when was the last increase, and are there any pending special assessments or reserve-fund shortfalls?
- Any open or pending special assessments — roof, HVAC, plumbing, elevator, façade? What's the per-unit balance and payoff schedule, and is the seller paying it off at close or rolling it to the buyer?
- Is there a deadline driving the sale (1031 exchange, divorce, estate, relocation)? That informs how much negotiation room exists.
- Crime grade is F in this area — have there been break-ins, vandalism, or insurance claims at this property in the last 3 years? What carrier currently insures it and at what premium?
- The area grade is low — what's the realistic commute time and amenity access for the typical tenant pool here? Any planned neighborhood developments (good or bad) we should know about?
- What's the average days-on-market for RENTAL listings here right now (not sales)? A rising rental-DOM trend means longer vacancies and softer asking-rent achievability than the comps imply.
- What's the recent tenant-quality profile in this submarket — average credit score on applications, eviction rate, late-payment / NSF rate, and stable-employment percentage? A property-management company in the area should have these aggregated.
- How much new apartment / multifamily construction is in the pipeline within 1–3 miles? Heavy new supply (>2% of stock underway) typically softens rents 12–24 months out; light construction supports rent growth.
Investment metrics
- 1% rule
- 0.91% ✗
- Cap rate
- 5.99%
- Cash-on-cash
- -1.09%
- DSCR
- 0.95
- GRM
- 9.2
CMA / ARV
No comps found within radius.
Projected returns pro-forma
-3.0% appreciation · 3.9% rent growth · sell at horizon
- IRR
- -17.0%
- Equity multiple
- 0.39×
- Total profit
- $-34,412
- Equity at exit
- $30,268
- IRR
- -7.1%
- Equity multiple
- 0.53×
- Total profit
- $-26,771
- Equity at exit
- $17,552
Cash invested: $56,840 (down + closing). Projections, not guarantees.
Landlord ↔ Tenant lean methodology
- Overall (STATE)
- 85 Strongly Landlord-Friendly
- State North Carolina
- 85 Strongly Landlord-Friendly · R+3
- County
- — inherits STATE
- City
- — inherits STATE
ZIP-level market 28405
- Rents YoY
- 3.9%
- Active inventory
- 191
- Price-to-rent
- 9.2×
Monthly cashflow live
- Estimated rent
- $1,849 high interval (Pro) →
- Mortgage (P&I)
- −$1,065
- Tax from tax record
- −$88 /mo · $1,058/yr
- Insurance
- −$85
- HOA
- −$275
- Vacancy / Maint / Mgmt
- −$388
- Net cashflow
- $-52
Break-even live
Sensitivity live
| Price | -10% $63 | -5% $6 | +0% $-52 | +5% $-109 | +10% $-167 |
|---|---|---|---|---|---|
| Rent | -10% $-198 | -5% $-125 | +0% $-52 | +5% $21 | +10% $94 |
| Rate | -1.0pp $50 | -0.5pp $0 | base $-52 | +0.5pp $-104 | +1.0pp $-158 |
UW: 25.0% down · 7.5% · 30yr · 1.5% tax · 5.0% vac · 8.0% maint · 8.0% mgmt
Financing live
Cash to close
- Down payment
- $50,750
- Closing costs
- $6,090
- Reserves months
- —
- Total cash needed
- —
Loan-product check · same deal, 3 products live
Conventional
25% down · 7.5% · 30yr
- Down + closing
- —
- Monthly P&I
- —
- Monthly cashflow
- —
- DSCR
- —
- Eligible?
- —
Personal DTI + credit; lowest rate.
DSCR
20% down · 8.5% · 30yr
- Down + closing
- —
- Monthly P&I
- —
- Monthly cashflow
- —
- DSCR
- —
- Eligible?
- —
No personal income docs; deal must DSCR.
Hard money
10% down · 12.0% · 12mo
- Down + closing
- —
- Monthly P&I
- —
- Monthly cashflow
- —
- DSCR
- —
- Eligible?
- —
Short-term bridge; refi at stabilization.
Rent comps 21 comps
| Address | Beds | Baths | Sqft | Rent | $/sqft | DOM | Units | Dist |
|---|---|---|---|---|---|---|---|---|
| 803 Bryce Ct Unit 803-K Wilmington, NC | 3.0 | 2.0 | 1364 | $1,700 | $1.25 | 23d | 1 | 0.04mi |
| 719 Melba Ct Unit 719-I Wilmington, NC | 3.0 | 2.0 | 1300 | $1,800 | $1.38 | 23d | 1 | 0.09mi |
| 901 Litchfield Way Unit 901-K Wilmington, NC | 2.0 | 2.0 | 1234 | $1,500 | $1.22 | 23d | 1 | 0.14mi |
| 909 Litchfield Way Unit 909-H Wilmington, NC | 3.0 | 2.0 | 1364 | $1,800 | $1.32 | 23d | 1 | 0.17mi |
| 5002 Hunters Trl Unit 5002-10 Wilmington, NC | 2.0 | 2.0 | 1297 | $1,600 | $1.23 | 23d | 1 | 0.31mi |
| 5208 Ringo Dr Wilmington, NC | 1.0–2.0 | 1.0–2.0 | 700 | $1,475 | $2.11 | 23d | 15 | 0.35mi |
| 4711 Azalea Landing Dr Wilmington, NC | 3.0 | 1.0–2.0 | 1188 | $2,744 | $2.31 | 15d | 28 | 0.42mi |
| 4633 Crawdad Ct Wilmington, NC | 2.0 | 2.0 | 1383 | $1,795 | $1.30 | 15d | 1 | 0.68mi |
| 511 Cobblestone Dr Wilmington, NC | 1.0–3.0 | 1.0–3.0 | 875 | $1,650 | $1.89 | 15d | 14 | 0.69mi |
| 4615 McClelland Dr Wilmington, NC | 2.0 | 2.0 | 1029 | $1,350 | $1.31 | 23d | 1 | 0.73mi |
| 5034 Hunt Club Rd Wilmington, NC | 1.0–2.0 | 1.0–1.5 | 845 | $1,175 | $1.39 | 23d | 1 | 0.84mi |
| 417 N Crestwood Dr Wilmington, NC | 4.0 | 3.0 | 1600 | $3,600 | $2.25 | 23d | 1 | 0.90mi |
| 417 N Crestwood Dr Unit Na Wilmington, NC | 4.0 | 3.0 | 1600 | $3,600 | $2.25 | 15d | 1 | 0.90mi |
| 703 Grathwol Dr Wilmington, NC | 1.0–2.0 | 1.0–2.0 | 726 | $1,433 | $1.97 | 15d | 15 | 0.92mi |
| 137 Dapple Ct Wilmington, NC | 1.0–2.0 | 1.5–2.0 | 775 | $1,575 | $2.03 | 15d | 14 | 1.04mi |
| 700 Indica Ct #302 Wilmington, NC | 3.0 | 2.0 | 1300 | $1,400 | $1.08 | 23d | 1 | 1.05mi |
| 245 S Kerr Ave Wilmington, NC | 2.0 | 1.0–2.0 | 825 | $1,399 | $1.69 | 23d | 1 | 1.31mi |
| 5300 New Centre Dr Wilmington, NC | 1.0–3.0 | 1.0–3.0 | 953 | $2,379 | $2.50 | 15d | 49 | 1.33mi |
| 4901 Randall Pkwy Wilmington, NC | 1.0–2.0 | 1.0 | 737 | $1,375 | $1.86 | 23d | 1 | 1.41mi |
| 4801 Kubeck Ct Unit 4849 Wilmington, NC | 2.0 | 2.0 | 900 | $1,150 | $1.28 | 23d | 1 | 1.42mi |
| 4861 College Acres Dr Wilmington, NC | 1.0–2.0 | 1.0–2.0 | 900 | $1,447 | $1.61 | 15d | 10 | 1.48mi |
HOA detail condo
- Monthly dues
- $275 · $3,300/yr
- Likely covers
- watertrashinternetcableexterior maint.insurancepoolparking
- Assessments
- None detected in remarks — confirm with the listing agent.
Listing history 12 events
-
2026-06-15status $203,000 Pending 24 DOM
-
2026-06-15days on market $203,000 Active 24 DOM
-
2026-06-14days on market $203,000 Active 22 DOM
-
2026-06-13days on market $203,000 Active 21 DOM
-
2026-06-10days on market $203,000 Active 19 DOM
-
2026-06-09days on market $203,000 Active 18 DOM
-
2026-06-08days on market $203,000 Active 17 DOM
-
2026-06-07days on market $203,000 Active 16 DOM
-
2026-06-05days on market $203,000 Active 13 DOM
-
2026-06-03days on market $203,000 Active 12 DOM
-
2026-06-03remarks 699-char remark
-
2026-06-03$203,000 Active 11 DOM
ⓘ Source: listings_history table (triggers on properties + properties_extension) + one-shot
backfill from property_details.listing_events for pre-trigger history.
Tax reassessment forecast NC · Resets to sale price
- Current annual tax
- $1,058 · $88/mo
- Projected year-2 tax
- $1,665 · $139/mo
- Expected delta
- +$607/yr (+$51/mo · 57.3%)
ⓘ Screening estimate from a state-policy table — verify with the county assessor before closing.
Climate risk First Street
- Flood 1/10 Low FEMA zone X (unshaded) · 0% chance over 30 yrs
- Wildfire 4/10 Moderate
- Heat 9/10 Extreme 7 d/yr ≥104°F today · 19 d/yr by 30 yrs out
- Wind 8/10 Severe 99% chance of damaging wind over 30 yrs
- Air quality 2/10 Low 1 unhealthy d/yr today · 2 by 30 yrs out
Nearby sold comps map
Loading sold comps map…
Walkable amenities ~0.75 mi
Loading nearby amenities…
Taxation est. · year 1
- Rental income
- $22,184
- − Mortgage interest
- −$11,371
- − Property taxes
- −$1,058
- − Insurance
- −$1,015
- − Repairs & maintenance
- −$1,775
- − Management
- −$1,775
- − HOA
- −$3,300
- − Depreciation
- −$5,905
- Taxable loss
- −$4,015
- Est. tax savings @ 24.0%
- +$964
- After-tax cash flow
- $342/yr
For passive investors: Depreciation is non-cash, so a rental often shows a tax loss while cash-flowing — sheltering income. Rental losses are passive: they offset passive income freely, and up to $25,000/yr can offset ordinary (W-2) income if you actively participate and your MAGI is under $100k (phasing out to $0 by $150k); unused losses carry forward. On sale, claimed depreciation is recaptured at up to 25%, and gains may owe capital-gains tax (a 1031 exchange can defer both). Figures are a year-1 estimate at your 24.0% rate — not tax advice; consult a CPA.
Schools (NCES district)
- District
- New Hanover County Schools
- NCES district ID
- 3703330
- Math proficiency
- 48% ▼ -3.00%
- Reading proficiency
- 53% ▬ 0.00%
- Median HH income
- $49,406
- Composite
- 43.13/100
- National rank
- #3081
- State rank
- #61 of 178 in NC
Livability — Wilmington
- Score
- 70/100
- State rank
- #142
- US rank
- #8131
Category grades
Schools grade is shown separately in the Schools card above.
Census & demographics
- Census place
- Wilmington, NC
- County
- New Hanover County · 232,153 people
- City population
- 215,355
- Metro
- Wilmington, NC
- Population (ZIP)
- 35,467
- Household income
- $70,274
- Rent vs Own
- Severe rent burden
- 2089.0
Population outlook (New Hanover County) Hauer SSP2
- Today (2025)
- 259,517 people
- By 2030
- 279,586 · +7.7%
- By 2040
- 318,223 · +22.6%
- By 2050
- 354,831 · +36.7%
- By 2075
- 437,158 · +68.5%
- By 2100
- 486,769 · +87.6%
Race, ethnicity, and origin ACS 2023
- Neighborhood character
- Predominantly White (69%)
- Race & ethnicity
- White 69% Black 17% Hispanic / Latino 9% Two or more races 4% Asian 1%
- Hispanic origin (detail)
- Mexican 3% Puerto Rican 2%
- Common ancestry
- Slovak 3% Romanian 2% Italian 2%
- Foreign-born
- 8% · Canada, South Korea
- Languages at home
- 90% English-only · Spanish 7% Other Indo-European 2%
Political lean MEDSL · New Hanover
- 2024 margin
- Toss-up / Even · D 49.8% · R 49.1% · Other 1.1%
- 2008→2024 swing
- +2.0pp toward D · 2008: -1.4pp · 2024: 0.6pp
- All cycles
- 2024: D+0.6 2020: D+2.1 2016: R+4.1 2012: R+4.7 2008: R+1.4
Not yet ingested
- Civics
- —
Market trends
- HPI YoY
- ▼ -446.45%
- Current HPI
- 232.4987
- Rent YoY
- ▲ 3.90%
- Metro
- Wilmington, NC
- State GDP YoY
- ▲ 3.28%
- F500 in state
- 26
Industry mix (Fortune 500 HQ in NC)
| Industry | F500 HQs | Revenue |
|---|---|---|
| Financial Services | 2 | $213B |
|
||
| Retail | 2 | $95B |
|
||
| Industrial Conglomerate | 1 | $38B |
|
||
| Metals / Steel | 1 | $35B |
|
||
| Utilities | 1 | $30B |
|
||
| Industrial Machinery | 1 | $19B |
|
||
Price history
+91.7% since first listed15 events — show timeline
- 2026-06-01 Relisted — Hive MLS
- 2026-06-01 Price Changed $203,000 Hive MLS
- 2026-05-04 Contingent — Hive MLS
- 2026-05-04 Listing Removed — Hive MLS
- 2026-05-03 Price Changed $222,000 Hive MLS
- 2026-04-24 Listed $215,000 Hive MLS
- 2021-06-10 Sold (Public Records) $165,000 Public Records
- 2021-06-10 Sold (MLS) $165,000 Hive MLS
- 2021-04-13 Listed $163,000 Hive MLS
- 2005-08-02 Sold (Public Records) $119,500 Public Records
- 2003-06-01 Sold (Public Records) $105,000 Public Records
- 2003-05-12 Listing Removed — Hive MLS
- 2002-12-31 Listing Removed — Hive MLS
- 2002-12-19 Listed $105,900 Hive MLS
- 2002-07-14 Listed $105,900 Hive MLS
Property tax history
+0.4%/yrLatest (2025): $1,058 · -21.6% YoY. Source: county tax records.
Cash-flow waterfall
monthlySold comps — $/sqft
last 12 mo · ≤1 miLoading sold comps…