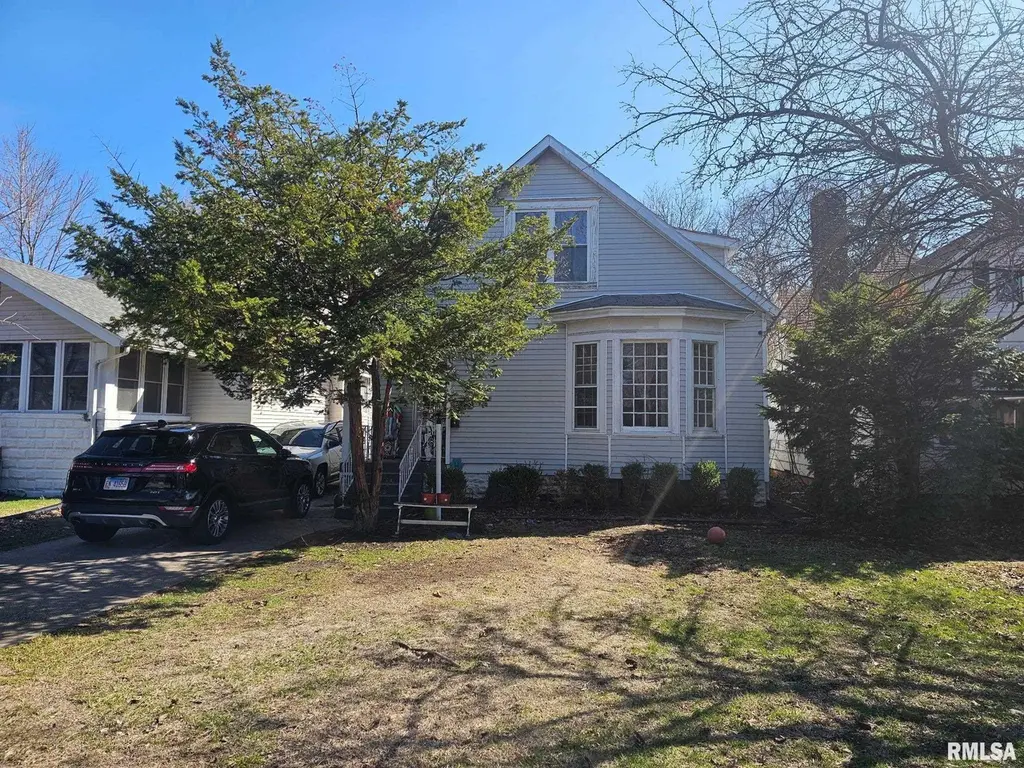
1324 N Underhill St · Peoria, IL
Flood risk 3/10 · Minor
- FEMA flood zone
- X
- Chance of flooding over 30 yrs
- 0.2%
- Est. flood insurance / yr
- $473 – $860
Fire risk 1/10 · Minimal
- Est. fire insurance / yr
- $804 – $1,492
Heat risk 3/10 · Minor
- Hot days now (above 105°F)
- 7 days/yr
- Hot days in 30 yrs
- 18 days/yr
Wind risk 2/10 · Minimal
- Chance of severe wind over 30 yrs
- 1.0%
Air-quality risk 3/10 · Minor
- Unhealthy air days now
- 1 days/yr
- Unhealthy air days in 30 yrs
- 3 days/yr
Risk factors via First Street. Map © Google.
Why this score? — see what drove the B grade
The composite is a weighted blend of 9 inputs, each scored 0–100. Each bar is that input's sub-score; the figure is the points it added to the 100-point composite (weight × sub-score).
- Cash flow +30.0/30.0
- ARV discount +15.0/15.0
- 1% rule +10.0/10.0
- DSCR +10.0/10.0
- Livability +3.7/5.0
- Rent growth +2.5/5.0
- Condition / age +2.5/5.0
- Schools +1.1/10.0
- Appreciation +0.0/10.0
$49,000
🖨 Deal sheet 📄 Offer letter ✓ Due diligence
Listing remarks MLS
This home is sold as is. This home SOLD AS A PACKAGE with 1817 New York Ave, 1822 N Missouri Ave, 2226 N Ellis St, 1906 Missouri.
Key facts
- 2,220 sq ft lot
- 2 garage spots
- Built 1920
Neighborhood map
What this means for you Summary
Snapshot
- This is a 3-bed/1.0-bath single-family listed at $49k.
Deal economics
- At list price, monthly cash flow is $733 ($9k/yr) — positive.
- The deal already cash-flows at list — no discount required.
- Meets the 1% rule at list price ($1k rent vs $49k).
- Recommended offer: $46k (6.0% below list) — sets the bar for market timing.
- Cap rate 24.3% vs local median 5.6% in Peoria — top-decile yield for the area; either an underpriced asset or a hidden risk that comps aren't pricing in. Stress-test before assuming the spread holds.
Location & tenants
- Location reads 73/100 on livability (#270 in IL) — a middle-class / working-renter tenant base. Strengths: commute A+, cost of living A+, housing A+; Watch: employment D+, schools F, crime F.
- Peoria SD 150 (urban): math 11% / reading 14% proficiency, ranked #554 of 620 in IL (top 89%) — low school quality limits family demand, transient renter base, plan for 1-2y turnover; 70% free/reduced lunch — lower-income household profile, screen leases tightly.
- Market conditions: 33 active listings in the ZIP; 26 comparable units currently listed for rent nearby; rentals at typical pace (median 21d on market — plan ~3-4 weeks tenant-placement turnaround); 42% of comp listings sitting > 30 days — soft ceiling on asking rent; lower-income renter base — watch delinquency; 73 units permitted in Peoria County in 2024 (0 in 5+ unit buildings).
- This rent runs 44% of the median local income ($39k/yr) — at the standard rent-burdened threshold; future hikes will face affordability resistance.
Forward outlook
- Local home prices are declining (-3.0%/yr); year-one equity from $339 of loan paydown is wiped out by about $1k of value loss. Plan a longer hold.
- Peoria County population projected at -11% by 2050 — secular population decline; favor cash flow + early exit over multi-decade hold.
- At projected returns (-3.0% appreciation + 3.0% rent growth), your $14k cash investment doubles in ~2 years — after that, you're playing with house money.
Negotiation context
- It's been on market 87 days — a 6% lower offer ($46k) is reasonable based on typical stale-listing flexibility.
- 4 sale attempts since 20y ago; this cycle's ask has dropped $16k (25%) from the opening price — seller is motivated, your offer sets the floor, not the list.
- Current owner paid $33k; 48% above their basis — modest negotiation headroom, anchor on the comps not their cost.
Risks & watch-outs
- Watch-outs: property tax is 3.2% of price; built in 1920 — expect roof / HVAC / electrical / plumbing capex.
Questions for the listing agent
- It's been on market 87 days. Have you received any prior offers? Is the seller open to a 6% concession, seller financing, or rate buy-down credit?
- Built in 1920 — when were the roof, HVAC, electrical panel, plumbing, and water heater last replaced?
- Property tax is high relative to price — has the assessment been appealed recently, and will the sale trigger a re-assessment?
- Why hasn't it sold? Are there any deal-killer items the seller is aware of (foundation, flood, title, zoning, code violations)?
- Is there a deadline driving the sale (1031 exchange, divorce, estate, relocation)? That informs how much negotiation room exists.
- Schools are F-rated, which usually means shorter tenancies and higher turnover. Who's the typical renter profile here, and what's been the actual vacancy rate?
- Crime grade is F in this area — have there been break-ins, vandalism, or insurance claims at this property in the last 3 years? What carrier currently insures it and at what premium?
- What's the average days-on-market for RENTAL listings here right now (not sales)? A rising rental-DOM trend means longer vacancies and softer asking-rent achievability than the comps imply.
- What's the recent tenant-quality profile in this submarket — average credit score on applications, eviction rate, late-payment / NSF rate, and stable-employment percentage? A property-management company in the area should have these aggregated.
- How much new for-sale + rental construction is in the pipeline within 1–3 miles? Heavy new supply typically softens prices + rents 12–24 months out; constrained supply supports both.
Investment metrics
- 1% rule
- 2.95% ✓
- Cap rate
- 24.25%
- Cash-on-cash
- 64.14%
- DSCR
- 3.85
- GRM
- 2.8
CMA / ARV
- ARV (median comp)
- $86,357
- List price
- $49,000
- Delta
- -43.26%
- Verdict
- UNDERPRICED
- Comps
- 20 within 1.0 mi
Show comp detail 12 sales within ~0.75 mi
| Address | Dist | Beds/Ba | Sqft | Sold | Price | $/sf | Match |
|---|---|---|---|---|---|---|---|
| 1328 N Broadway St | 0.23mi | 4/1.0 (+1) | 1,596 (+7%) | 1mo | $120,000 | $75 | 73 |
| 816 W Columbia Ter | 0.29mi | 3/1.0 | 1,347 (-10%) | 3mo | $38,000 | $28 | 67 |
| 1009 W Armstrong Ave | 0.12mi | 3/2.0 | 1,310 (-12%) | 4mo | $47,500 | $36 | 66 |
| 1219 Sheridan Rd | 0.40mi | 3/1.5 | 1,632 (+9%) | 0mo | $114,000 | $70 | 64 |
| 1313 N Ellis St | 0.48mi | 3/2.0 | 1,402 (-6%) | 3mo | $45,000 | $32 | 61 |
| 1420 N Douglas St | 0.36mi | 3/1.0 | 1,336 (-11%) | 8mo | $18,000 | $13 | 58 |
| 809 W Eleanor Pl | 0.62mi | 3/1.5 | 1,339 (-11%) | 5mo | $138,000 | $103 | 48 |
| 310 W Armstrong Ave | 0.70mi | 3/1.5 | 1,668 (+11%) | 7mo | $165,900 | $99 | 41 |
| 905 N Orange St | 0.48mi | 4/1.5 (+1) | 1,276 (-15%) | 6mo | $111,000 | $87 | 41 |
| 2115 N Bourland Ave | 0.60mi | 4/1.0 (+1) | 1,281 (-14%) | 5mo | $65,500 | $51 | 39 |
| 1001 W Brons Ave | 0.71mi | 3/1.0 | 1,284 (-14%) | 7mo | $72,100 | $56 | 37 |
| 725 W Spring Hollow Ln | 0.73mi | 3/2.0 | 1,714 (+14%) | 4mo | $169,500 | $99 | 34 |
Match score weights: distance 35% · size 25% · config 20% · recency 20%. Top-matched comps best support the ARV.
Projected returns pro-forma
-3.0% appreciation · 3.0% rent growth · sell at horizon
- IRR
- 63.3%
- Equity multiple
- 3.83×
- Total profit
- $38,830
- Equity at exit
- $7,306
- IRR
- 67.7%
- Equity multiple
- 7.87×
- Total profit
- $94,215
- Equity at exit
- $4,237
Cash invested: $13,720 (down + closing). Projections, not guarantees.
Landlord ↔ Tenant lean methodology
- Overall (STATE)
- 43 Moderately Tenant-Leaning
- State Illinois
- 43 Moderately Tenant-Leaning · D+7
- County
- — inherits STATE
- City
- — inherits STATE
ZIP-level market 61606
- Home prices YoY
- -34.0%
- Active inventory
- 33
- Price-to-rent
- 2.8×
Monthly cashflow live
- Estimated rent
- $1,445 high interval (Pro) →
- Mortgage (P&I)
- −$257
- Tax from tax record
- −$130 /mo · $1,566/yr
- Insurance
- −$20
- HOA
- −$0
- Vacancy / Maint / Mgmt
- −$303
- Net cashflow
- $733
Break-even live
UW: 25.0% down · 7.5% · 30yr · 1.5% tax · 5.0% vac · 8.0% maint · 8.0% mgmt
Financing live
Cash to close
- Down payment
- $12,250
- Closing costs
- $1,470
- Reserves months
- —
- Total cash needed
- —
Loan-product check · same deal, 3 products live
Conventional
25% down · 7.5% · 30yr
- Down + closing
- —
- Monthly P&I
- —
- Monthly cashflow
- —
- DSCR
- —
- Eligible?
- —
Personal DTI + credit; lowest rate.
DSCR
20% down · 8.5% · 30yr
- Down + closing
- —
- Monthly P&I
- —
- Monthly cashflow
- —
- DSCR
- —
- Eligible?
- —
No personal income docs; deal must DSCR.
Hard money
10% down · 12.0% · 12mo
- Down + closing
- —
- Monthly P&I
- —
- Monthly cashflow
- —
- DSCR
- —
- Eligible?
- —
Short-term bridge; refi at stabilization.
Rent comps 26 comps
| Address | Beds | Baths | Sqft | Rent | $/sqft | DOM | Units | Dist |
|---|---|---|---|---|---|---|---|---|
| 501 W Columbia Ter Unit 3 Peoria, IL | 3.0 | 1.0 | 1500 | $1,400 | $0.93 | 44d | 1 | 0.54mi |
| 1019 N Farmington Rd Unit 1017 Peoria, IL | 3.0 | 1.0 | 1304 | $1,600 | $1.23 | 44d | 1 | 0.59mi |
| 2023 N Underhill St Peoria, IL | 3.0 | 1.0 | 1050 | $1,200 | $1.14 | 13d | 1 | 0.60mi |
| 818 W Moss Ave Peoria, IL | 2.0 | 2.0 | 1580 | $1,800 | $1.14 | 13d | 1 | 0.61mi |
| 416 W Main St Unit A Peoria, IL | 2.0 | 1.0 | 1050 | $950 | $0.90 | 44d | 1 | 0.66mi |
| 903 W Brons Ave Peoria, IL | 3.0 | 1.0 | 971 | $995 | $1.02 | 44d | 1 | 0.75mi |
| 1723 W Fredonia Ave Peoria, IL | 4.0 | 2.5 | 1219 | $2,100 | $1.72 | 13d | 1 | 0.79mi |
| 1816 W Callender Ave Peoria, IL | 3.0 | 2.0 | 1628 | $1,650 | $1.01 | 44d | 1 | 0.94mi |
| 814 W McClure Ave Peoria, IL | 3.0 | 1.0 | 1148 | $1,100 | $0.96 | 44d | 1 | 0.98mi |
| 913 W McClure Ave Peoria, IL | 3.0 | 1.0 | 1400 | $1,200 | $0.86 | 21d | 1 | 0.98mi |
| 1401 W Adrian G Hinton Ave Peoria, IL | 2.0 | 1.0 | 1100 | $775 | $0.70 | 44d | 1 | 1.02mi |
| 1806 N Peoria Ave Peoria, IL | 4.0 | 1.5 | 1668 | $894 | $0.54 | 13d | 1 | 1.09mi |
| 2210 Knoxville Ave #2212 Peoria, IL | 2.0 | 1.0 | 1284 | $950 | $0.74 | 44d | 1 | 1.19mi |
| 123 SW Jefferson Ave Unit E16 NE Peoria, IL | 2.0 | 2.0 | 1199 | $2,250 | $1.88 | 21d | 1 | 1.25mi |
| 123 SW Jefferson Ave Unit E15SW Peoria, IL | 2.0 | 2.0 | 1100 | $1,750 | $1.59 | 13d | 1 | 1.25mi |
| 901 NE Glen Oak Ave Unit 2 Peoria, IL | 3.0 | 1.0 | 1120 | $1,200 | $1.07 | 21d | 1 | 1.27mi |
| 2523 W Nebraska Ave Peoria, IL | 3.0 | 2.0 | 1600 | $1,450 | $0.91 | 21d | 1 | 1.28mi |
| 102 N Cedar Ave West Peoria, IL | 4.0 | 1.0 | 1272 | $995 | $0.78 | 44d | 1 | 1.28mi |
| 1413 W Gilbert Ave Peoria, IL | 2.0 | 2.0 | 1428 | $1,500 | $1.05 | 13d | 1 | 1.29mi |
| 2601 W Kenwood Ave West Peoria, IL | 3.0 | 1.5 | 1405 | $1,500 | $1.07 | 13d | 1 | 1.32mi |
| 308 E Archer Ave Peoria, IL | 3.0 | 1.0 | 1444 | $950 | $0.66 | 13d | 1 | 1.35mi |
| 1540 W Kettelle St Peoria, IL | 3.0 | 1.0 | 1001 | $748 | $0.75 | 13d | 1 | 1.38mi |
| 1214 W Butler St Peoria, IL | 4.0 | 1.0 | 1440 | $795 | $0.55 | 44d | 1 | 1.39mi |
| 1801 N Gentry Ln West Peoria, IL | 3.0 | 1.0 | 1000 | $1,650 | $1.65 | 13d | 1 | 1.42mi |
| 3108 N Parish Ave Peoria, IL | 3.0 | 1.5 | 967 | $1,750 | $1.81 | 44d | 1 | 1.48mi |
| 2610 N Renwood Ave Peoria, IL | 2.0 | 1.0 | 904 | $1,300 | $1.44 | 13d | 1 | 1.49mi |
Listing history 27 events
-
2026-06-19days on market $49,000 Active 87 DOM
-
2026-06-18days on market $49,000 Active 86 DOM
-
2026-06-17days on market $49,000 Active 85 DOM
-
2026-06-16days on market $49,000 Active 84 DOM
-
2026-06-15days on market $49,000 Active 83 DOM
-
2026-06-14days on market $49,000 Active 81 DOM
-
2026-06-13days on market $49,000 Active 80 DOM
-
2026-06-10days on market $49,000 Active 78 DOM
-
2026-06-09days on market $49,000 Active 77 DOM
-
2026-06-08days on market $49,000 Active 76 DOM
-
2026-06-07days on market $49,000 Active 75 DOM
-
2026-06-03days on market $49,000 Active 71 DOM
-
2026-06-02days on market $49,000 Active 70 DOM
-
2026-06-01days on market $49,000 Active 69 DOM
-
2026-05-31days on market $49,000 Active 68 DOM
-
2026-05-30days on market $49,000 Active 67 DOM
-
2026-03-24$65,000 Active 130-char remark
Show marketing remark (130 chars)
This home is sold as is. This home SOLD AS A PACKAGE with 1817 New York Ave, 1822 N Missouri Ave, 2226 N Ellis St, 1906 Missouri.
-
2023-08-18soldstatus $33,000 Closed 237-char remark
Show marketing remark (237 chars)
3 bedroom, 1 bathroom home for sale in the heart of Peoria. Being sold AS IS. This listing can be purchased as part of a package of 9 properties. All data is deemed credible but not guaranteed. Contact your agent for more information.
-
2023-07-20status Pending 237-char remark
Show marketing remark (237 chars)
3 bedroom, 1 bathroom home for sale in the heart of Peoria. Being sold AS IS. This listing can be purchased as part of a package of 9 properties. All data is deemed credible but not guaranteed. Contact your agent for more information.
-
2023-07-14$35,000 Active 237-char remark
Show marketing remark (237 chars)
3 bedroom, 1 bathroom home for sale in the heart of Peoria. Being sold AS IS. This listing can be purchased as part of a package of 9 properties. All data is deemed credible but not guaranteed. Contact your agent for more information.
-
2021-08-06historical
-
2018-10-04soldstatus $276,000
-
2011-08-22soldstatus $24,900
-
2011-06-27$24,900
-
2006-11-02soldstatus $63,000
-
2006-10-31soldstatus $62,900
-
2006-09-01$65,000
ⓘ Source: listings_history table (triggers on properties + properties_extension) + one-shot
backfill from property_details.listing_events for pre-trigger history.
Tax reassessment forecast IL · Partial reset (capped growth)
- Current annual tax
- $1,566 · $130/mo
- Projected year-2 tax
- $1,566 · $130/mo
- Expected delta
- $0/yr ($0/mo · 0.0%)
ⓘ Screening estimate from a state-policy table — verify with the county assessor before closing.
Climate risk First Street
- Flood 3/10 Moderate FEMA zone X · 20% chance over 30 yrs
- Wildfire 1/10 Low
- Heat 3/10 Moderate 7 d/yr ≥105°F today · 18 d/yr by 30 yrs out
- Wind 2/10 Low 100% chance of damaging wind over 30 yrs
- Air quality 3/10 Moderate 1 unhealthy d/yr today · 3 by 30 yrs out
Nearby sold comps map
Loading sold comps map…
Walkable amenities ~0.75 mi
Loading nearby amenities…
Taxation est. · year 1
- Rental income
- $17,334
- − Mortgage interest
- −$2,745
- − Property taxes
- −$1,566
- − Insurance
- −$245
- − Repairs & maintenance
- −$1,387
- − Management
- −$1,387
- − Depreciation
- −$1,425
- Taxable income
- $8,580
- Est. tax owed @ 24.0%
- −$2,059
- After-tax cash flow
- $6,741/yr
For passive investors: Depreciation is non-cash, so a rental often shows a tax loss while cash-flowing — sheltering income. Rental losses are passive: they offset passive income freely, and up to $25,000/yr can offset ordinary (W-2) income if you actively participate and your MAGI is under $100k (phasing out to $0 by $150k); unused losses carry forward. On sale, claimed depreciation is recaptured at up to 25%, and gains may owe capital-gains tax (a 1031 exchange can defer both). Figures are a year-1 estimate at your 24.0% rate — not tax advice; consult a CPA.
Schools (NCES district)
- District
- Peoria SD 150
- NCES district ID
- 1731230
- Math proficiency
- 11% ▼ -5.00%
- Reading proficiency
- 14% ▼ -4.00%
- Median HH income
- $41,951
- Composite
- 10.92/100
- National rank
- #9751
- State rank
- #554 of 620 in IL
Livability — Peoria
- Score
- 73/100
- State rank
- #270
- US rank
- #5096
Category grades
Schools grade is shown separately in the Schools card above.
Census & demographics
- Census place
- Peoria, IL
- County
- Peoria County · 120,495 people
- City population
- 114,670
- Metro
- Peoria, IL
- Population (ZIP)
- 6,684
- Household income
- $39,196
- Rent vs Own
- Severe rent burden
- 620.0
Population outlook (Peoria County) Hauer SSP2
- Today (2025)
- 183,007 people
- By 2030
- 179,643 · -1.8%
- By 2040
- 171,782 · -6.1%
- By 2050
- 163,508 · -10.7%
- By 2075
- 140,178 · -23.4%
- By 2100
- 114,493 · -37.4%
Race, ethnicity, and origin ACS 2023
- Neighborhood character
- Predominantly White (66%)
- Race & ethnicity
- White 66% Black 17% Two or more races 9% Hispanic / Latino 8% Asian 3%
- Hispanic origin (detail)
- Mexican 6%
- Common ancestry
- Romanian 4% Slovak 2% Lithuanian 2%
- Foreign-born
- 4% · Vietnam, Canada
- Languages at home
- 94% English-only · Spanish 3% Other Indo-European 1% Chinese 1%
Political lean MEDSL · Peoria
- 2024 margin
- Toss-up / Even · D 51.5% · R 46.9% · Other 1.6%
- 2008→2024 swing
- -9.2pp toward R · 2008: 13.9pp · 2024: 4.7pp
- All cycles
- 2024: D+4.7 2020: D+6.3 2016: D+2.8 2012: D+4.4 2008: D+13.9
Not yet ingested
- Civics
- —
Market trends
- HPI YoY
- ▼ -85.67%
- Current HPI
- 166.329
- Rent YoY
- —
- Metro
- Peoria, IL
- State GDP YoY
- ▲ 1.59%
- F500 in state
- 60
Industry mix (Fortune 500 HQ in IL)
| Industry | F500 HQs | Revenue |
|---|---|---|
| Insurance | 4 | $201B |
|
||
| Consumer Goods | 4 | $87B |
|
||
| Industrial Machinery | 3 | $64B |
|
||
| Healthcare | 2 | $55B |
|
||
| Retail / Pharmacy | 1 | $148B |
|
||
| Agriculture / Food | 1 | $86B |
|
||
Price history
+0.0% since first listed11 events — show timeline
- 2026-03-24 Listed $65,000 RMLSA as Distributed by MLS Grid
- 2023-08-18 Sold (MLS) $33,000 RMLSA as Distributed by MLS Grid
- 2023-07-20 Pending — RMLSA as Distributed by MLS Grid
- 2023-07-14 Listed $35,000 RMLSA as Distributed by MLS Grid
- 2021-08-06 Listing Removed — RMLSA as Distributed by MLS Grid
- 2018-10-04 Sold (Public Records) $276,000 Public Records
- 2011-08-22 Sold (MLS) $24,900 RMLSA as Distributed by MLS Grid
- 2011-06-27 Listed $24,900 RMLSA as Distributed by MLS Grid
- 2006-11-02 Sold (Public Records) $63,000 Public Records
- 2006-10-31 Sold (MLS) $62,900 RMLSA as Distributed by MLS Grid
- 2006-09-01 Listed $65,000 RMLSA as Distributed by MLS Grid
Property tax history
+1.0%/yrLatest (2024): $1,566 · +4.8% YoY. Source: county tax records.
Cash-flow waterfall
monthlySold comps — $/sqft
last 12 mo · ≤1 miLoading sold comps…