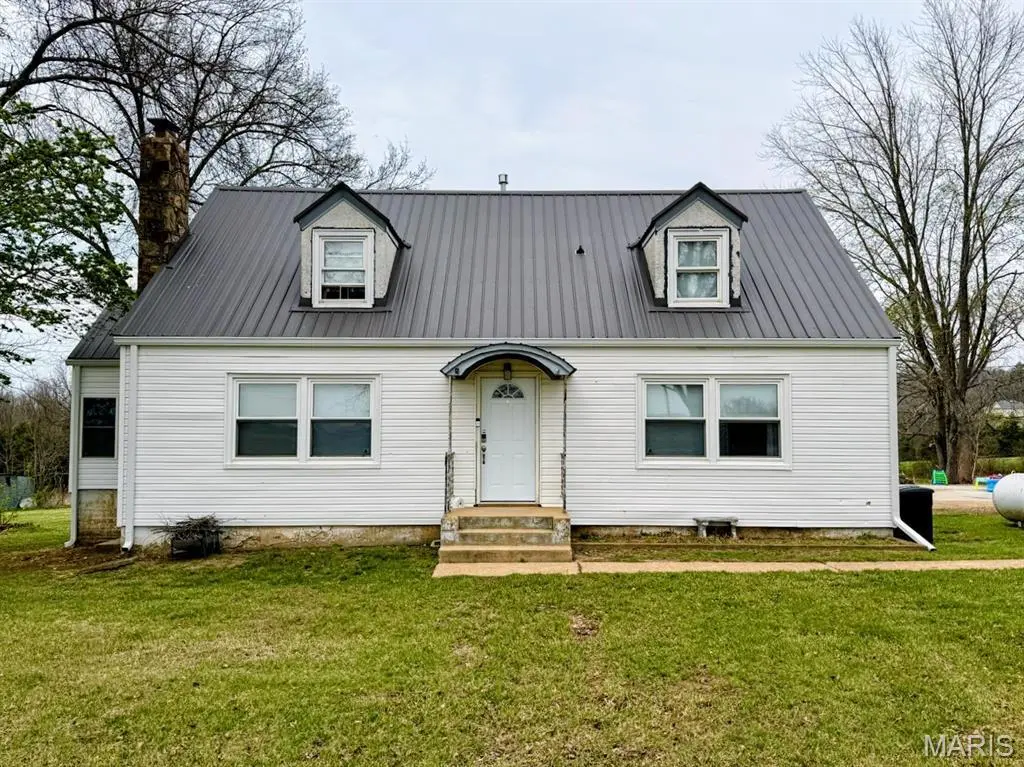
10739 Highway 32 · Plato, MO
Flood risk 1/10 · Minimal
- FEMA flood zone
- —
- Chance of flooding over 30 yrs
- 0.0%
- Est. flood insurance / yr
- —
Fire risk 5/10 · Moderate
- Est. fire insurance / yr
- $1,054 – $1,958
Heat risk 5/10 · Moderate
- Hot days now (above 105°F)
- 7 days/yr
- Hot days in 30 yrs
- 20 days/yr
Wind risk 2/10 · Minimal
- Chance of severe wind over 30 yrs
- 1.0%
Air-quality risk 2/10 · Minimal
- Unhealthy air days now
- 0 days/yr
- Unhealthy air days in 30 yrs
- 1 days/yr
Risk factors via First Street. Map © Google.
Why this score? — see what drove the D+ grade
The composite is a weighted blend of 9 inputs, each scored 0–100. Each bar is that input's sub-score; the figure is the points it added to the 100-point composite (weight × sub-score).
- Cash flow +14.8/30.0
- ARV discount +7.5/15.0
- Appreciation +7.0/10.0
- DSCR +4.5/10.0
- Schools +3.1/10.0
- Livability +3.1/5.0
- 1% rule +2.8/10.0
- Rent growth +2.5/5.0
- Condition / age +2.5/5.0
$179,000
🖨 Deal sheet (PDF) 📄 Offer letter ✓ Due diligence
Listing remarks MLS
2005, 3 bedroom, 2 bath double wide on 1ac m/l. This 28x66 mobile is very spacious with a large living room and kitchen. The master bedroom features a walk-in closet and master bath with a garden tub. Nice size yard with some fencing for horses and a storage building.
Key facts
- New furnace
- Metal roof
- New siding
Tags
Property features AI
Exterior
- Utilities: Public water; Public sewer; Electricity connected
- Home design: Single family residence; Residential property; Private ownership; Three or more levels
- Construction: Vinyl siding; Metal roof; Built area and above-grade living area per assessor; Basement present
- Exterior features: Deck; Private yard; Partial fencing; Barn(s); Agricultural/farm-friendly lot with pasture and backyard
Interior
- Kitchen: Stainless steel appliance(s)
- Bedrooms: 3 bedrooms total (1 on the main level, 2 on the upper level)
- Bathrooms: 1 full bathroom; 1 half bathroom
- Heating & cooling: Propane heating; Central air conditioning
- Interior features: Stainless steel appliances; Pellet stove fireplace; Full, unfinished basement
- Laundry & utility: 220 Volt electrical service
Neighborhood map
What this means for you Summary
Snapshot
- This is a 4-bed/1.5-bath other listed at $179k.
Deal economics
- At list price, monthly cash flow is $48 ($571/yr) — positive.
- The deal already cash-flows at list — no discount required.
- To meet the 1% rule (rent ≥ 1% of price), the offer needs to be $140k (22.0% below list).
- Recommended offer: $140k (22.0% below list) — sets the bar for 1% rule.
- Cap rate 6.6% vs local median 3.0% in Plato — top-decile yield for the area; either an underpriced asset or a hidden risk that comps aren't pricing in. Stress-test before assuming the spread holds.
Location & tenants
- Location reads 61/100 on livability (#424 in MO) — a middle-class / working-renter tenant base. Strengths: cost of living A+, housing A+; Watch: crime F, amenities F, commute F.
- Plato R-V (rural): math 30% / reading 42% proficiency, ranked #198 of 324 in MO (top 61%) — families likely to look elsewhere, expect single-tenant / working-renter base with shorter leases.
- Zoned schools: Plato Elem. (math 42% / reading 47%, grade F, #413 of 1,115 statewide, top 42%, 255 students, 44% FRL); Plato High (math 22% / reading 37%, grade F, #382 of 521 statewide, top 78%, 282 students, 46% FRL) — zoned schools average 45% FRL vs 29% district-wide (16 pts higher); higher-poverty schools than district average — tighter screening recommended.
- Market conditions: 23 active listings in the ZIP; 10 units permitted in Texas County in 2024 (5 in 5+ unit buildings).
Forward outlook
- In year one you build about $8k of equity ($1k loan paydown + $7k appreciation (4.0% local appreciation)).
- Texas County population projected at -11% by 2050 — secular population decline; favor cash flow + early exit over multi-decade hold.
- At projected returns (4.0% appreciation + 3.0% rent growth), your $50k cash investment doubles in ~5 years — after that, you're playing with house money.
- By year 5, paydown + projected appreciation supports a ~$36k cash-out refi (75% LTV) — recoverable capital for the next deal without selling this one.
Negotiation context
- It's been on market 35 days — a 3% lower offer ($174k) is reasonable based on typical stale-listing flexibility.
- 6 sale attempts since 3y ago with the ask held roughly flat each time — persistent listings suggest the price (not the market) is what's stuck; bring a comps-based counter.
Risks & watch-outs
- Watch-outs: built in 1946 — expect roof / HVAC / electrical / plumbing capex.
- Climate carrying-cost: moderate wildfire risk; extreme-heat days projected 7→20/yr by 2055 (HVAC capex compounding) — expect insurance premiums to compound above CPI over the hold.
Questions for the listing agent
- It's been on market 35 days. Have you received any prior offers? Is the seller open to a 22% concession, seller financing, or rate buy-down credit?
- Built in 1946 — when were the roof, HVAC, electrical panel, plumbing, and water heater last replaced?
- Is there a deadline driving the sale (1031 exchange, divorce, estate, relocation)? That informs how much negotiation room exists.
- Crime grade is F in this area — have there been break-ins, vandalism, or insurance claims at this property in the last 3 years? What carrier currently insures it and at what premium?
- The area grade is low — what's the realistic commute time and amenity access for the typical tenant pool here? Any planned neighborhood developments (good or bad) we should know about?
- What's the average days-on-market for RENTAL listings here right now (not sales)? A rising rental-DOM trend means longer vacancies and softer asking-rent achievability than the comps imply.
- What's the recent tenant-quality profile in this submarket — average credit score on applications, eviction rate, late-payment / NSF rate, and stable-employment percentage? A property-management company in the area should have these aggregated.
- How much new for-sale + rental construction is in the pipeline within 1–3 miles? Heavy new supply typically softens prices + rents 12–24 months out; constrained supply supports both.
Investment metrics
- 1% rule
- 0.78% ✗
- Cap rate
- 6.61%
- Cash-on-cash
- 1.14%
- DSCR
- 1.05
- GRM
- 10.7
CMA / ARV
No comps found within radius.
Projected returns pro-forma
3.99% appreciation · 3.0% rent growth · sell at horizon
- IRR
- 11.2%
- Equity multiple
- 1.68×
- Total profit
- $34,082
- Equity at exit
- $90,677
- IRR
- 12.9%
- Equity multiple
- 3.11×
- Total profit
- $105,640
- Equity at exit
- $148,248
Cash invested: $50,120 (down + closing). Projections, not guarantees.
Landlord ↔ Tenant lean methodology
- Overall (STATE)
- 81 Strongly Landlord-Friendly
- State Missouri
- 81 Strongly Landlord-Friendly · R+10
- County
- — inherits STATE
- City
- — inherits STATE
ZIP-level market 65552
- Home prices YoY
- 2.2%
- Active inventory
- 23
- Price-to-rent
- 10.7×
Monthly cashflow live
- Estimated rent
- $1,396 medium interval (Pro) →
- Mortgage (P&I)
- −$939
- Tax from tax record
- −$42 /mo · $508/yr
- Insurance
- −$75
- HOA
- −$0
- Vacancy / Maint / Mgmt
- −$293
- Net cashflow
- $48
Break-even live
Sensitivity live
| Price | -10% $149 | -5% $98 | +0% $48 | +5% $-3 | +10% $-54 |
|---|---|---|---|---|---|
| Rent | -10% $-63 | -5% $-8 | +0% $48 | +5% $103 | +10% $158 |
| Rate | -1.0pp $138 | -0.5pp $93 | base $48 | +0.5pp $1 | +1.0pp $-46 |
UW: 25.0% down · 7.5% · 30yr · 1.5% tax · 5.0% vac · 8.0% maint · 8.0% mgmt
Financing live
Cash to close
- Down payment
- $44,750
- Closing costs
- $5,370
- Reserves months
- —
- Total cash needed
- —
Loan-product check · same deal, 3 products live
Conventional
25% down · 7.5% · 30yr
- Down + closing
- —
- Monthly P&I
- —
- Monthly cashflow
- —
- DSCR
- —
- Eligible?
- —
Personal DTI + credit; lowest rate.
DSCR
20% down · 8.5% · 30yr
- Down + closing
- —
- Monthly P&I
- —
- Monthly cashflow
- —
- DSCR
- —
- Eligible?
- —
No personal income docs; deal must DSCR.
Hard money
10% down · 12.0% · 12mo
- Down + closing
- —
- Monthly P&I
- —
- Monthly cashflow
- —
- DSCR
- —
- Eligible?
- —
Short-term bridge; refi at stabilization.
Listing history 18 events
-
2026-05-07status Pending
-
2026-04-28historical Active Under Contract
-
2026-04-28status Pending
-
2026-04-01$179,000 Active
-
2025-04-26historical
-
2025-03-21status Active
-
2025-03-12historical
-
2025-03-11status Active
-
2025-03-11historical
-
2024-10-10price $145,000
-
2024-09-12$149,000 Active
-
2023-11-07soldstatus Closed 268-char remark
Show marketing remark (268 chars)
2005, 3 bedroom, 2 bath double wide on 1ac m/l. This 28x66 mobile is very spacious with a large living room and kitchen. The master bedroom features a walk-in closet and master bath with a garden tub. Nice size yard with some fencing for horses and a storage building.
-
2023-11-07soldstatus Closed
Show marketing remark (268 chars)
2005, 3 bedroom, 2 bath double wide on 1ac m/l. This 28x66 mobile is very spacious with a large living room and kitchen. The master bedroom features a walk-in closet and master bath with a garden tub. Nice size yard with some fencing for horses and a storage building.
-
2023-09-28status Pending
-
2023-08-30historical Active Under Contract
-
2023-08-28$50,000 Active
-
2023-08-26status Pending 268-char remark
Show marketing remark (268 chars)
2005, 3 bedroom, 2 bath double wide on 1ac m/l. This 28x66 mobile is very spacious with a large living room and kitchen. The master bedroom features a walk-in closet and master bath with a garden tub. Nice size yard with some fencing for horses and a storage building.
-
2023-08-23$50,000 Active 268-char remark
Show marketing remark (268 chars)
2005, 3 bedroom, 2 bath double wide on 1ac m/l. This 28x66 mobile is very spacious with a large living room and kitchen. The master bedroom features a walk-in closet and master bath with a garden tub. Nice size yard with some fencing for horses and a storage building.
ⓘ Source: listings_history table (triggers on properties + properties_extension) + one-shot
backfill from property_details.listing_events for pre-trigger history.
Tax reassessment forecast MO · Resets to sale price
- Current annual tax
- $508 · $42/mo
- Projected year-2 tax
- $1,736 · $145/mo
- Expected delta
- +$1,229/yr (+$102/mo · 242.0%)
ⓘ Screening estimate from a state-policy table — verify with the county assessor before closing.
Climate risk First Street
- Flood 1/10 Low 0% chance over 30 yrs
- Wildfire 5/10 Major
- Heat 5/10 Major 7 d/yr ≥105°F today · 20 d/yr by 30 yrs out
- Wind 2/10 Low 100% chance of damaging wind over 30 yrs
- Air quality 2/10 Low 0 unhealthy d/yr today · 1 by 30 yrs out
Nearby sold comps map
Loading sold comps map…
Walkable amenities ~0.75 mi
Loading nearby amenities…
Taxation est. · year 1
- Rental income
- $16,757
- − Mortgage interest
- −$10,027
- − Property taxes
- −$508
- − Insurance
- −$895
- − Repairs & maintenance
- −$1,341
- − Management
- −$1,341
- − Depreciation
- −$5,207
- Taxable loss
- −$2,561
- Est. tax savings @ 24.0%
- +$615
- After-tax cash flow
- $1,185/yr
For passive investors: Depreciation is non-cash, so a rental often shows a tax loss while cash-flowing — sheltering income. Rental losses are passive: they offset passive income freely, and up to $25,000/yr can offset ordinary (W-2) income if you actively participate and your MAGI is under $100k (phasing out to $0 by $150k); unused losses carry forward. On sale, claimed depreciation is recaptured at up to 25%, and gains may owe capital-gains tax (a 1031 exchange can defer both). Figures are a year-1 estimate at your 24.0% rate — not tax advice; consult a CPA.
Schools (NCES district)
- District
- Plato R-V
- NCES district ID
- 2925210
- Math proficiency
- 30% ▼ -4.00%
- Reading proficiency
- 42% ▼ -1.00%
- Median HH income
- $48,961
- Composite
- 31.04/100
- National rank
- #6085
- State rank
- #198 of 324 in MO
Livability — Plato
- Score
- 61/100
- State rank
- #424
- US rank
- #17568
Category grades
Schools grade is shown separately in the Schools card above.
Census & demographics
- Census place
- Plato, MO
- Population (ZIP)
- 2,259
Population outlook (Texas County) Hauer SSP2
- Today (2025)
- 24,648 people
- By 2030
- 23,981 · -2.7%
- By 2040
- 22,840 · -7.3%
- By 2050
- 21,832 · -11.4%
- By 2075
- 19,481 · -21.0%
- By 2100
- 16,634 · -32.5%
Race, ethnicity, and origin ACS 2023
- Neighborhood character
- Predominantly White (86%)
- Race & ethnicity
- White 86% Two or more races 12% Black 2%
- Common ancestry
- Serbian 2% Lithuanian 2% Portuguese 1%
Political lean MEDSL · Texas
- 2024 margin
- Solid R (+71.7) · D 13.8% · R 85.5%
- 2008→2024 swing
- -36.7pp toward R · 2008: -35.1pp · 2024: -71.7pp
- All cycles
- 2024: R+71.7 2020: R+68.6 2016: R+65.4 2012: R+44.1 2008: R+35.1
Not yet ingested
- Civics
- —
Market trends
- HPI YoY
- ▲ 3.99%
- Current HPI
- 184.3328
- Rent YoY
- —
- Metro
- —
- State GDP YoY
- ▲ 1.84%
- F500 in state
- 20
Industry mix (Fortune 500 HQ in MO)
| Industry | F500 HQs | Revenue |
|---|---|---|
| Healthcare | 1 | $163B |
|
||
| Insurance | 1 | $21B |
|
||
| Industrial Technology | 1 | $17B |
|
||
| Retail | 1 | $16B |
|
||
| Industrial Distribution | 1 | $10B |
|
||
| Utilities | 1 | $9B |
|
||
Price history
+258.0% since first listed18 events — show timeline
- 2026-05-07 Pending — MARIS as Distributed by MLS Grid
- 2026-04-28 Contingent — MARIS as Distributed by MLS Grid
- 2026-04-28 Pending — MARIS as Distributed by MLS Grid
- 2026-04-01 Listed $179,000 MARIS as Distributed by MLS Grid
- 2025-04-26 Delisted — MARIS as Distributed by MLS Grid
- 2025-03-21 Relisted — MARIS as Distributed by MLS Grid
- 2025-03-12 Delisted — MARIS as Distributed by MLS Grid
- 2025-03-11 Relisted — MARIS as Distributed by MLS Grid
- 2025-03-11 Delisted — MARIS as Distributed by MLS Grid
- 2024-10-10 Price Changed $145,000 MARIS as Distributed by MLS Grid
- 2024-09-12 Listed $149,000 MARIS as Distributed by MLS Grid
- 2023-11-07 Sold (MLS) — MARIS as Distributed by MLS Grid
- 2023-11-07 Sold (MLS) — SOMO
- 2023-09-28 Pending — MARIS as Distributed by MLS Grid
- 2023-08-30 Contingent — MARIS as Distributed by MLS Grid
- 2023-08-28 Listed $50,000 MARIS as Distributed by MLS Grid
- 2023-08-26 Pending — SOMO
- 2023-08-23 Listed $50,000 SOMO
Property tax history
-3.0%/yrLatest (2025): $508 · -1.0% YoY. Source: county tax records.
Cash-flow waterfall
monthlySold comps — $/sqft
last 12 mo · ≤1 miLoading sold comps…