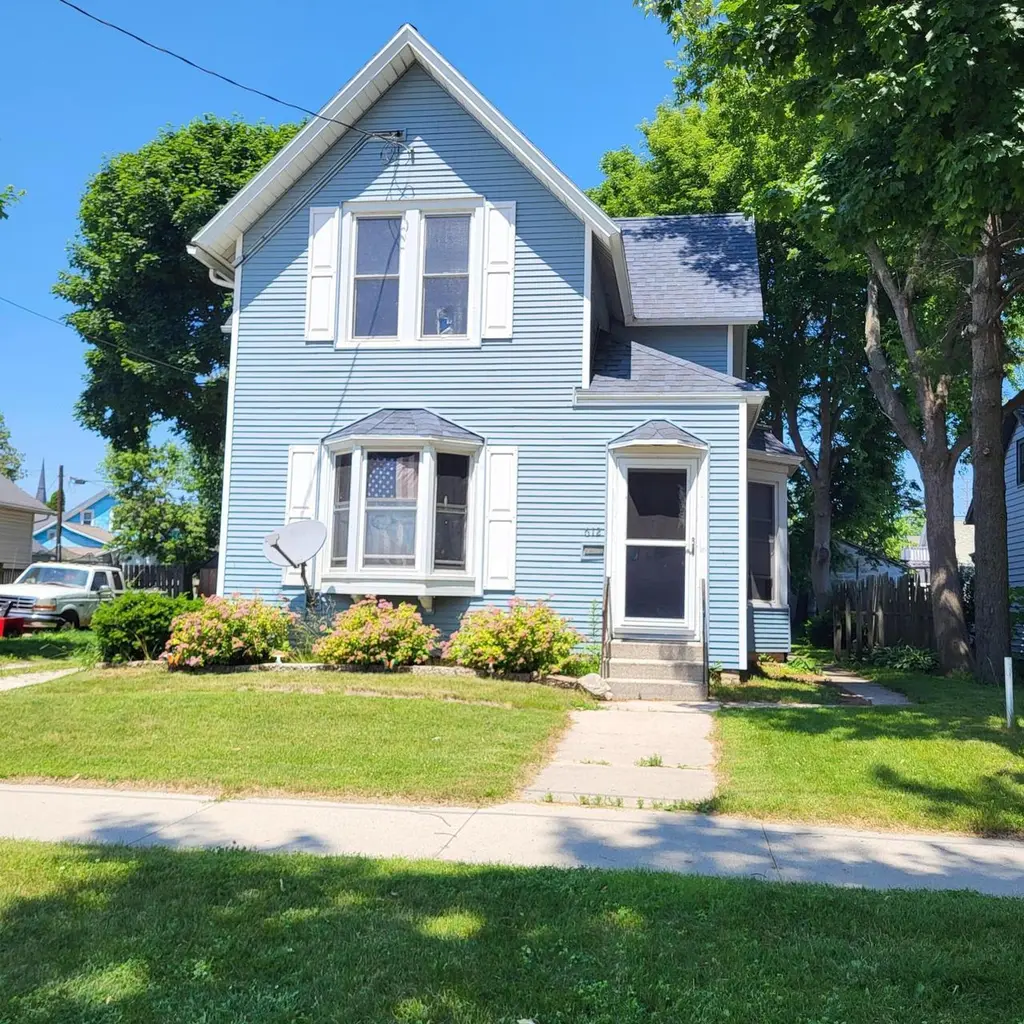
612 Buffalo St · Manitowoc, WI
Flood risk 1/10 · Minimal
- FEMA flood zone
- X (unshaded)
- Chance of flooding over 30 yrs
- 0.0%
- Est. flood insurance / yr
- $473 – $860
Fire risk 1/10 · Minimal
- Est. fire insurance / yr
- $636 – $1,182
Heat risk 1/10 · Minimal
- Hot days now (above 91°F)
- 7 days/yr
- Hot days in 30 yrs
- 14 days/yr
Wind risk 1/10 · Minimal
- Chance of severe wind over 30 yrs
- —
Air-quality risk 2/10 · Minimal
- Unhealthy air days now
- 1 days/yr
- Unhealthy air days in 30 yrs
- 2 days/yr
Risk factors via First Street. Map © Google.
Why this score? — see what drove the C- grade
The composite is a weighted blend of 9 inputs, each scored 0–100. Each bar is that input's sub-score; the figure is the points it added to the 100-point composite (weight × sub-score).
- Cash flow +17.0/30.0
- ARV discount +13.2/15.0
- DSCR +5.3/10.0
- 1% rule +4.3/10.0
- Livability +4.0/5.0
- Rent growth +2.5/5.0
- Condition / age +2.5/5.0
- Schools +2.3/10.0
- Appreciation +0.0/10.0
$165,000
🖨 Deal sheet 📄 Offer letter ✓ Due diligence
Listing remarks MLS
Room to grow, work, and play -- this 5 bedroom 2-bath home offers flexible living, a manageable yard, and endless potential. Rare value for this much space -- bring your ideas and make it yours!Being sold as is!
Key facts
- 5,662 sq ft lot
- 2 garage spots
- Built 1898
Neighborhood map
What this means for you Summary
Snapshot
- This is a 5-bed/2.0-bath single-family listed at $165k.
Deal economics
- At list price, monthly cash flow is $112 ($1k/yr) — positive.
- The deal already cash-flows at list — no discount required.
- To meet the 1% rule (rent ≥ 1% of price), the offer needs to be $153k (7.0% below list).
- Recommended offer: $145k (12.0% below list) — sets the bar for market timing.
- Cap rate 7.1% vs local median 2.6% in Manitowoc — top-decile yield for the area; either an underpriced asset or a hidden risk that comps aren't pricing in. Stress-test before assuming the spread holds.
Location & tenants
- Location reads 81/100 on livability (#56 in WI, #1,555 nationally) — a professional / high-income tenant draw. Strengths: commute A+, cost of living A+, housing A+; Watch: schools D, amenities F.
- Manitowoc School District (town): math 23% / reading 30% proficiency, ranked #304 of 342 in WI (top 89%) — low school quality limits family demand, transient renter base, plan for 1-2y turnover.
- Market conditions: 99 active listings in the ZIP; 100 units permitted in Manitowoc County in 2024 (0 in 5+ unit buildings).
Forward outlook
- Local home prices are declining (-3.0%/yr); year-one equity from $1k of loan paydown is wiped out by about $5k of value loss. Plan a longer hold.
- Manitowoc County population projected at -21% by 2050 — secular population decline; favor cash flow + early exit over multi-decade hold.
Negotiation context
- It's been on market 306 days — a 12% lower offer ($145k) is reasonable based on typical stale-listing flexibility.
- 4 sale attempts since 13y ago; this cycle's ask has dropped $25k (13%) from the opening price — seller is motivated, your offer sets the floor, not the list.
- Current owner paid $78k; list at $165k implies a 112% gain — meaningful room to come down on a strong offer.
Risks & watch-outs
- Watch-outs: built in 1898 — expect roof / HVAC / electrical / plumbing capex.
Questions for the listing agent
- It's been on market 306 days. Have you received any prior offers? Is the seller open to a 12% concession, seller financing, or rate buy-down credit?
- Built in 1898 — when were the roof, HVAC, electrical panel, plumbing, and water heater last replaced?
- Why hasn't it sold? Are there any deal-killer items the seller is aware of (foundation, flood, title, zoning, code violations)?
- Is there a deadline driving the sale (1031 exchange, divorce, estate, relocation)? That informs how much negotiation room exists.
- Schools are D-rated, which usually means shorter tenancies and higher turnover. Who's the typical renter profile here, and what's been the actual vacancy rate?
- What's the average days-on-market for RENTAL listings here right now (not sales)? A rising rental-DOM trend means longer vacancies and softer asking-rent achievability than the comps imply.
- What's the recent tenant-quality profile in this submarket — average credit score on applications, eviction rate, late-payment / NSF rate, and stable-employment percentage? A property-management company in the area should have these aggregated.
- How much new for-sale + rental construction is in the pipeline within 1–3 miles? Heavy new supply typically softens prices + rents 12–24 months out; constrained supply supports both.
Investment metrics
- 1% rule
- 0.93% ✗
- Cap rate
- 7.11%
- Cash-on-cash
- 2.90%
- DSCR
- 1.13
- GRM
- 9.0
CMA / ARV
- ARV (median comp)
- $188,859
- List price
- $165,000
- Delta
- -12.63%
- Verdict
- UNDERPRICED
- Comps
- 20 within 1.0 mi
Show comp detail 10 sales within ~0.75 mi
| Address | Dist | Beds/Ba | Sqft | Sold | Price | $/sf | Match |
|---|---|---|---|---|---|---|---|
| 612 Buffalo St | 0.00mi | 5/2.5 | 1,771 (+6%) | 1mo | $140,000 | $79 | 87 |
| 617 N 7th St | 0.34mi | 4/1.5 (-1) | 1,843 (+11%) | 5mo | $189,000 | $103 | 55 |
| 1207 Huron St | 0.64mi | 4/1.0 (-1) | 1,684 (+1%) | 9mo | $190,000 | $113 | 52 |
| 631 N Water St | 0.46mi | 4/2.0 (-1) | 1,838 (+10%) | 7mo | $266,000 | $145 | 50 |
| 851 N 10th St | 0.70mi | 4/2.5 (-1) | 1,576 (-5%) | 4mo | $162,500 | $103 | 48 |
| 701 N 7th St | 0.41mi | 4/1.5 (-1) | 1,844 (+11%) | 10mo | $182,500 | $99 | 48 |
| 851 N 8th St | 0.67mi | 5/2.0 | 1,759 (+6%) | 14mo | $130,000 | $74 | 48 |
| 866 N 10th St | 0.73mi | 4/2.5 (-1) | 1,728 (+4%) | 9mo | $233,000 | $135 | 45 |
| 845 N 8th St | 0.65mi | 4/1.5 (-1) | 1,800 (+8%) | 7mo | $220,000 | $122 | 43 |
| 827 N 10th St | 0.65mi | 4/2.0 (-1) | 1,464 (-12%) | 18mo | $195,000 | $133 | 30 |
Match score weights: distance 35% · size 25% · config 20% · recency 20%. Top-matched comps best support the ARV.
Projected returns pro-forma
-3.0% appreciation · 3.0% rent growth · sell at horizon
- IRR
- -11.7%
- Equity multiple
- 0.58×
- Total profit
- $-19,627
- Equity at exit
- $24,602
- IRR
- -2.5%
- Equity multiple
- 0.83×
- Total profit
- $-7,938
- Equity at exit
- $14,266
Cash invested: $46,200 (down + closing). Projections, not guarantees.
Landlord ↔ Tenant lean methodology
- Overall (STATE)
- 73 Landlord-Friendly
- State Wisconsin
- 73 Landlord-Friendly · R+2
- County
- — inherits STATE
- City
- — inherits STATE
ZIP-level market 54220
- Home prices YoY
- -25.5%
- Active inventory
- 99
- Price-to-rent
- 9.0×
Monthly cashflow live
- Estimated rent
- $1,534 medium interval (Pro) →
- Mortgage (P&I)
- −$865
- Tax from tax record
- −$167 /mo · $1,998/yr
- Insurance
- −$69
- HOA
- −$0
- Vacancy / Maint / Mgmt
- −$322
- Net cashflow
- $112
Break-even live
UW: 25.0% down · 7.5% · 30yr · 1.5% tax · 5.0% vac · 8.0% maint · 8.0% mgmt
Financing live
Cash to close
- Down payment
- $41,250
- Closing costs
- $4,950
- Reserves months
- —
- Total cash needed
- —
Loan-product check · same deal, 3 products live
Conventional
25% down · 7.5% · 30yr
- Down + closing
- —
- Monthly P&I
- —
- Monthly cashflow
- —
- DSCR
- —
- Eligible?
- —
Personal DTI + credit; lowest rate.
DSCR
20% down · 8.5% · 30yr
- Down + closing
- —
- Monthly P&I
- —
- Monthly cashflow
- —
- DSCR
- —
- Eligible?
- —
No personal income docs; deal must DSCR.
Hard money
10% down · 12.0% · 12mo
- Down + closing
- —
- Monthly P&I
- —
- Monthly cashflow
- —
- DSCR
- —
- Eligible?
- —
Short-term bridge; refi at stabilization.
Listing history 13 events
-
2026-01-19price $165,000 211-char remark
Show marketing remark (211 chars)
Room to grow, work, and play -- this 5 bedroom 2-bath home offers flexible living, a manageable yard, and endless potential. Rare value for this much space -- bring your ideas and make it yours!Being sold as is!
-
2025-12-30status Active 211-char remark
Show marketing remark (211 chars)
Room to grow, work, and play -- this 5 bedroom 2-bath home offers flexible living, a manageable yard, and endless potential. Rare value for this much space -- bring your ideas and make it yours!Being sold as is!
-
2025-12-30historical Contingent 211-char remark
Show marketing remark (211 chars)
Room to grow, work, and play -- this 5 bedroom 2-bath home offers flexible living, a manageable yard, and endless potential. Rare value for this much space -- bring your ideas and make it yours!Being sold as is!
-
2025-10-02price $175,000 211-char remark
Show marketing remark (211 chars)
Room to grow, work, and play -- this 5 bedroom 2-bath home offers flexible living, a manageable yard, and endless potential. Rare value for this much space -- bring your ideas and make it yours!Being sold as is!
-
2025-08-20price $180,000 211-char remark
Show marketing remark (211 chars)
Room to grow, work, and play -- this 5 bedroom 2-bath home offers flexible living, a manageable yard, and endless potential. Rare value for this much space -- bring your ideas and make it yours!Being sold as is!
-
2025-07-23$190,000 Active 211-char remark
Show marketing remark (211 chars)
Room to grow, work, and play -- this 5 bedroom 2-bath home offers flexible living, a manageable yard, and endless potential. Rare value for this much space -- bring your ideas and make it yours!Being sold as is!
-
2025-07-03historical $190,000 211-char remark
Show marketing remark (211 chars)
Room to grow, work, and play -- this 5 bedroom 2-bath home offers flexible living, a manageable yard, and endless potential. Rare value for this much space -- bring your ideas and make it yours!Being sold as is!
-
2025-07-03historical
Show marketing remark (211 chars)
Room to grow, work, and play -- this 5 bedroom 2-bath home offers flexible living, a manageable yard, and endless potential. Rare value for this much space -- bring your ideas and make it yours!Being sold as is!
-
2025-07-02$190,000 Active
-
2013-09-23$88,800
-
2013-09-23historical
-
2007-11-05soldstatus $78,000
-
2007-11-02soldstatus $78,000
ⓘ Source: listings_history table (triggers on properties + properties_extension) + one-shot
backfill from property_details.listing_events for pre-trigger history.
Tax reassessment forecast WI · Partial reset (capped growth)
- Current annual tax
- $1,998 · $167/mo
- Projected year-2 tax
- $2,525 · $210/mo
- Expected delta
- +$527/yr (+$44/mo · 26.4%)
ⓘ Screening estimate from a state-policy table — verify with the county assessor before closing.
Climate risk First Street
- Flood 1/10 Low FEMA zone X (unshaded) · 0% chance over 30 yrs
- Wildfire 1/10 Low
- Heat 1/10 Low 7 d/yr ≥91°F today · 14 d/yr by 30 yrs out
- Wind 1/10 Low
- Air quality 2/10 Low 1 unhealthy d/yr today · 2 by 30 yrs out
Nearby sold comps map
Loading sold comps map…
Walkable amenities ~0.75 mi
Loading nearby amenities…
Taxation est. · year 1
- Rental income
- $18,413
- − Mortgage interest
- −$9,243
- − Property taxes
- −$1,998
- − Insurance
- −$825
- − Repairs & maintenance
- −$1,473
- − Management
- −$1,473
- − Depreciation
- −$4,800
- Taxable loss
- −$1,399
- Est. tax savings @ 24.0%
- +$336
- After-tax cash flow
- $1,676/yr
For passive investors: Depreciation is non-cash, so a rental often shows a tax loss while cash-flowing — sheltering income. Rental losses are passive: they offset passive income freely, and up to $25,000/yr can offset ordinary (W-2) income if you actively participate and your MAGI is under $100k (phasing out to $0 by $150k); unused losses carry forward. On sale, claimed depreciation is recaptured at up to 25%, and gains may owe capital-gains tax (a 1031 exchange can defer both). Figures are a year-1 estimate at your 24.0% rate — not tax advice; consult a CPA.
Schools (NCES district)
- District
- Manitowoc School District
- NCES district ID
- 5508610
- Math proficiency
- 23% ▼ -8.00%
- Reading proficiency
- 30% ▼ -3.00%
- Median HH income
- $44,540
- Composite
- 22.76/100
- National rank
- #8029
- State rank
- #304 of 342 in WI
Livability — Manitowoc
- Score
- 81/100
- State rank
- #56
- US rank
- #1555
Category grades
Schools grade is shown separately in the Schools card above.
Census & demographics
- Census place
- Manitowoc, WI
- County
- Manitowoc County · 55,069 people
- City population
- 40,949
- Metro
- Manitowoc, WI
- Population (ZIP)
- 40,949
- Household income
- $66,035
- Rent vs Own
- Severe rent burden
- 825.0
Population outlook (Manitowoc County) Hauer SSP2
- Today (2025)
- 76,561 people
- By 2030
- 74,096 · -3.2%
- By 2040
- 67,752 · -11.5%
- By 2050
- 60,731 · -20.7%
- By 2075
- 48,723 · -36.4%
- By 2100
- 39,250 · -48.7%
Race, ethnicity, and origin ACS 2023
- Neighborhood character
- Predominantly White (85%)
- Race & ethnicity
- White 85% Hispanic / Latino 6% Two or more races 5% Asian 4% Black 1%
- Hispanic origin (detail)
- Mexican 4%
- Common ancestry
- Romanian 8% Lithuanian 6% Portuguese 4%
- Foreign-born
- 4% · Canada, China
- Languages at home
- 92% English-only · Spanish 4% Other Asian/Pacific 2% Chinese 1%
Political lean MEDSL · Manitowoc
- 2024 margin
- Strong R (+23.4) · D 37.6% · R 61.0% · Other 1.4%
- 2008→2024 swing
- -30.9pp toward R · 2008: 7.5pp · 2024: -23.4pp
- All cycles
- 2024: R+23.4 2020: R+23.2 2016: R+21.7 2012: R+2.8 2008: D+7.5
Not yet ingested
- Civics
- —
Market trends
- HPI YoY
- ▼ -88.08%
- Current HPI
- 256.8561
- Rent YoY
- —
- Metro
- Manitowoc, WI
- State GDP YoY
- ▲ 2.10%
- F500 in state
- 20
Industry mix (Fortune 500 HQ in WI)
| Industry | F500 HQs | Revenue |
|---|---|---|
| Industrial Machinery | 4 | $23B |
|
||
| Industrial Technology | 2 | $36B |
|
||
| Insurance | 1 | $36B |
|
||
| Professional Services | 1 | $19B |
|
||
| Utilities | 1 | $9B |
|
||
| Consumer Goods | 1 | $3B |
|
||
Price history
+111.5% since first listed13 events — show timeline
- 2026-01-19 Price Changed $165,000 METROMLS
- 2025-12-30 Relisted — METROMLS
- 2025-12-30 Contingent — METROMLS
- 2025-10-02 Price Changed $175,000 METROMLS
- 2025-08-20 Price Changed $180,000 METROMLS
- 2025-07-23 Listed $190,000 METROMLS
- 2025-07-03 Coming Soon $190,000 METROMLS
- 2025-07-03 Listing Removed — METROMLS
- 2025-07-02 Listed $190,000 METROMLS
- 2013-09-23 Listing Removed — METROMLS
- 2013-09-23 Listed $88,800 METROMLS
- 2007-11-05 Sold (Public Records) $78,000 Public Records
- 2007-11-02 Sold (MLS) $78,000 METROMLS
Property tax history
+1.8%/yrLatest (2025): $1,998 · -11.1% YoY. Source: county tax records.
Cash-flow waterfall
monthlySold comps — $/sqft
last 12 mo · ≤1 miLoading sold comps…