 Multi-family
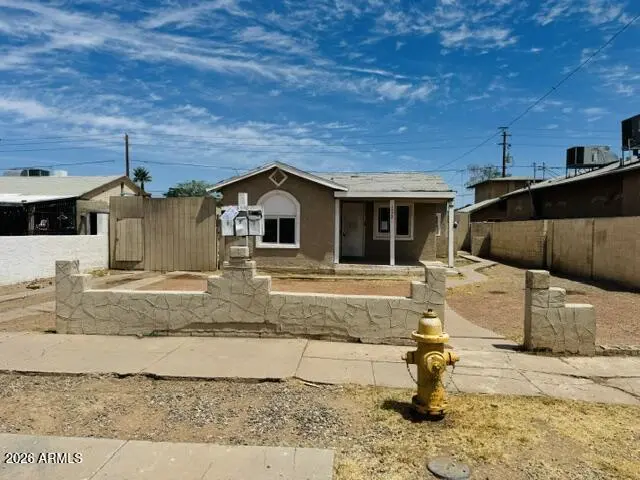
1522 W Taylor St · Phoenix, AZ
Flood risk 3/10 · Minor
- FEMA flood zone
- X (shaded)
- Chance of flooding over 30 yrs
- 0.17%
- Est. flood insurance / yr
- $507 – $1,088
Fire risk 1/10 · Minimal
- Est. fire insurance / yr
- $610 – $1,132
Heat risk 9/10 · Severe
- Hot days now (above 112°F)
- 7 days/yr
- Hot days in 30 yrs
- 19 days/yr
Wind risk 1/10 · Minimal
- Chance of severe wind over 30 yrs
- —
Air-quality risk 3/10 · Minor
- Unhealthy air days now
- 3 days/yr
- Unhealthy air days in 30 yrs
- 3 days/yr
Risk factors via First Street. Map © Google.
Why this score? — see what drove the B- grade
The composite is a weighted blend of 9 inputs, each scored 0–100. Each bar is that input's sub-score; the figure is the points it added to the 100-point composite (weight × sub-score).
- Cash flow +29.5/30.0
- DSCR +10.0/10.0
- 1% rule +8.3/10.0
- ARV discount +7.5/15.0
- Livability +3.8/5.0
- Rent growth +2.8/5.0
- Condition / age +2.2/5.0
- Schools +1.1/10.0
- Appreciation +0.0/10.0
$299,900
🖨 Deal sheet 📄 Offer letter ✓ Due diligence
Multi-family units
County records classify this as Multi-Family (2-4 Unit). Listing-text estimate: 1 unit. estimate disagrees with records
Listing remarks
Unique multi-unit opportunity featuring three separate residences on one lot! Front home offers 3 bedrooms and 1 bathroom with spacious living areas, tile flooring and covered front patio. Second unit includes 2 bedrooms and 1 bathroom with functional kitchen and living space. Third unit features 1 bedroom and 1 bathroom, providing flexibility for rental income, extended family or multi-generational living. Convenient location near shopping, dining, schools and freeway access. Great opportunity for investors, multi-generational living or buyers seeking flexible use options with three separate residences situated on one parcel. Buyer to verify all facts, figures, square footage and zoning/us
Key facts
- Functional kitchen
- Covered front patio
- Convenient location
Tags
Property features AI
Finance
- Financial info: Annual tax reported (see listing for details)
- HOA & community: No pool
Exterior
- Parking: One open parking space (1 space per unit); Total of 1 parking space
- Utilities: Electric service by APS; Public sewer; City franchise water
- Home design: Fee simple ownership; Three separate buildings
- Construction: Painted block construction; Composition roof; Three buildings
- Exterior features: Painted block construction; Composition roof; Asphalt road access; Irregular lot shape
Interior
- Kitchen: Free-standing range
- Flooring: Tile
- Heating & cooling: Central air; Heating present
- Interior features: Free-standing range; Tile flooring
Neighborhood map
What this means for you Summary
Snapshot
- This is a multifamily listed at $300k. Condition is rated fair.
Deal economics
- At list price, monthly cash flow is $1k ($13k/yr) — positive.
- The deal already cash-flows at list — no discount required.
- Meets the 1% rule at list price ($4k rent vs $300k).
- Recommended offer: $295k (1.5% below list) — sets the bar for market timing.
- Cap rate 10.6% vs local median 3.3% in Phoenix — top-decile yield for the area; either an underpriced asset or a hidden risk that comps aren't pricing in. Stress-test before assuming the spread holds.
Location & tenants
- Location reads 75/100 on livability (#16 in AZ, #3,924 nationally) — a middle-class / working-renter tenant base. Strengths: amenities A+, commute A+, housing A+; Watch: health & safety C-, crime F.
- Phoenix Union High School District (4286) (urban): math 10% / reading 15% proficiency, ranked #224 of 249 in AZ (top 90%) — low school quality limits family demand, transient renter base, plan for 1-2y turnover.
- Zoned schools: Central High School (math 13% / reading 16%, grade F, #267 of 381 statewide, top 72%, 1,901 students, 92% FRL).
- Market conditions: Rents rising (+1.4%/yr); 87 active listings in the ZIP; 40 comparable units currently listed for rent nearby; rentals leasing fast (median 1d on market — plan ~1-2 weeks tenant-placement turnaround); 36,011 units permitted in Maricopa County in 2024 (12,801 in 5+ unit buildings).
- At $3,977/mo this rent would consume 75% of the median local household income ($64k/yr) (locally 541% of renters already pay >50% of income on rent) — very limited rent-growth headroom before tenants either downsize or default.
Forward outlook
- Local home prices are declining (-3.0%/yr); year-one equity from $2k of loan paydown is wiped out by about $9k of value loss. Plan a longer hold.
- Maricopa County population projected at +38% by 2050 — long-run rental-demand tailwind backs the buy-and-hold thesis.
- At projected returns (-3.0% appreciation + 1.4% rent growth), your $84k cash investment doubles in ~10 years — after that, you're playing with house money.
Negotiation context
- It's been on market 16 days — a 2% lower offer ($295k) is reasonable based on typical stale-listing flexibility.
Risks & watch-outs
- Watch-outs: built in 1924 — expect roof / HVAC / electrical / plumbing capex.
- Climate carrying-cost: extreme-heat days projected 7→19/yr by 2055 (HVAC capex compounding) — expect insurance premiums to compound above CPI over the hold.
Questions for the listing agent
- Have any recent inspections been done? Can we get a copy of the seller's disclosures and any deferred-maintenance estimates?
- Built in 1924 — when were the roof, HVAC, electrical panel, plumbing, and water heater last replaced?
- Is there a deadline driving the sale (1031 exchange, divorce, estate, relocation)? That informs how much negotiation room exists.
- Crime grade is F in this area — have there been break-ins, vandalism, or insurance claims at this property in the last 3 years? What carrier currently insures it and at what premium?
- What's the average days-on-market for RENTAL listings here right now (not sales)? A rising rental-DOM trend means longer vacancies and softer asking-rent achievability than the comps imply.
- What's the recent tenant-quality profile in this submarket — average credit score on applications, eviction rate, late-payment / NSF rate, and stable-employment percentage? A property-management company in the area should have these aggregated.
- How much new apartment / multifamily construction is in the pipeline within 1–3 miles? Heavy new supply (>2% of stock underway) typically softens rents 12–24 months out; light construction supports rent growth.
Investment metrics
- 1% rule
- 1.33% ✓
- Cap rate
- 10.57%
- Cash-on-cash
- 15.28%
- DSCR
- 1.68
- GRM
- 6.3
CMA / ARV
No comps found within radius.
Show comp detail 12 sales within ~0.75 mi
| Address | Dist | Beds/Ba | Sqft | Sold | Price | $/sf | Match |
|---|---|---|---|---|---|---|---|
| 1249 W Pierce St | 0.15mi | —/— | — | 1mo | $1,176,000 | — | 79 |
| 1527 W Fillmore St | 0.03mi | —/— | — | 10mo | $1,300,000 | — | 78 |
| 1119 W Fillmore St | 0.25mi | —/— | — | 0mo | $580,000 | — | 75 |
| 1123 W Fillmore St | 0.24mi | —/— | — | 2mo | $630,000 | — | 75 |
| 1333 W Woodland Ave | 0.26mi | 5/4.0 | — | 2mo | $560,000 | — | 74 |
| 430 N 17th Ave | 0.22mi | —/— | — | 11mo | $410,000 | — | 68 |
| 421 N 18th Dr | 0.39mi | 4/3.0 | — | 2mo | $330,000 | — | 67 |
| 809 N 10th Ave | 0.44mi | 4/5.0 | — | 4mo | $995,000 | — | 64 |
| 330 N 18th Ave | 0.37mi | —/— | — | 10mo | $154,000 | — | 62 |
| 417 N 18th Dr | 0.38mi | —/— | — | 11mo | $549,000 | — | 61 |
| 136 N 11th Ave | 0.39mi | 5/4.0 | — | 12mo | $515,000 | — | 59 |
| 398 N 20th Dr | 0.65mi | 8/4.0 | — | 6mo | $560,000 | — | 52 |
Match score weights: distance 35% · size 25% · config 20% · recency 20%. Top-matched comps best support the ARV.
Projected returns pro-forma
-3.0% appreciation · 1.35% rent growth · sell at horizon
- IRR
- 4.1%
- Equity multiple
- 1.16×
- Total profit
- $13,071
- Equity at exit
- $44,716
- IRR
- 12.0%
- Equity multiple
- 1.88×
- Total profit
- $73,534
- Equity at exit
- $25,930
Cash invested: $83,972 (down + closing). Projections, not guarantees.
Landlord ↔ Tenant lean methodology
- Overall (STATE)
- 87 Strongly Landlord-Friendly
- State Arizona
- 87 Strongly Landlord-Friendly · R+3
- County
- — inherits STATE
- City
- — inherits STATE
ZIP-level market 85007
- Home prices YoY
- -28.9%
- Rents YoY
- 1.4%
- Active inventory
- 87
- Price-to-rent
- 15.9×
Monthly cashflow live
- Estimated rent
- $3,977 high interval (Pro) →
- Mortgage (P&I)
- −$1,573
- Tax est. 1.5%
- −$375 /mo · $4,498/yr
- Insurance
- −$125
- HOA
- −$0
- Vacancy / Maint / Mgmt
- −$835
- Net cashflow
- $1,069
Break-even live
3-unit breakdown (identical units grouped — click to expand)
| Units | Beds | Baths | Est. rent |
|---|---|---|---|
| 1× unit | 3 | 1 | $1,570 |
| 1× unit | 2 | 1 | $1,289 |
| 1× unit | 1 | 1 | $1,119 |
| Total (3 units) | $3,977 | ||
UW: 25.0% down · 7.5% · 30yr · 1.5% tax · 5.0% vac · 8.0% maint · 8.0% mgmt
Financing live
Cash to close
- Down payment
- $74,975
- Closing costs
- $8,997
- Reserves months
- —
- Total cash needed
- —
Loan-product check · same deal, 3 products live
Conventional
25% down · 7.5% · 30yr
- Down + closing
- —
- Monthly P&I
- —
- Monthly cashflow
- —
- DSCR
- —
- Eligible?
- —
Personal DTI + credit; lowest rate.
DSCR
20% down · 8.5% · 30yr
- Down + closing
- —
- Monthly P&I
- —
- Monthly cashflow
- —
- DSCR
- —
- Eligible?
- —
No personal income docs; deal must DSCR.
Hard money
10% down · 12.0% · 12mo
- Down + closing
- —
- Monthly P&I
- —
- Monthly cashflow
- —
- DSCR
- —
- Eligible?
- —
Short-term bridge; refi at stabilization.
Rent comps 40 comps
| Address | Beds | Baths | Sqft | Rent | $/sqft | DOM | Units | Dist |
|---|---|---|---|---|---|---|---|---|
| 1333 W Taylor St Unit 3 Phoenix, AZ | 1.0 | 1.0 | 500 | $1,075 | $2.15 | 1d | 1 | 0.09mi |
| 1606 W Taylor St Phoenix, AZ | 2.0 | 1.0 | 700 | $1,050 | $1.50 | 10d | 1 | 0.11mi |
| 1626 W Taylor St Unit 2 Phoenix, AZ | 1.0 | 1.0 | 500 | $1,000 | $2.00 | 1d | 1 | 0.15mi |
| 1505 W McKinley St Apt 1 Phoenix, AZ | 2.0 | 1.0 | 778 | $1,450 | $1.86 | 1d | 1 | 0.17mi |
| 1147 W Fillmore St Phoenix, AZ | 1.0 | 1.0 | — | $799 | — | 1d | 1 | 0.19mi |
| 1350 W Van Buren St Phoenix, AZ | 3.0 | 1.0–2.0 | 897 | $1,628 | $1.81 | 1d | 11 | 0.20mi |
| 1524 W Monroe St Phoenix, AZ | 2.0 | 1.0 | 1000 | $1,000 | $1.00 | 1d | 1 | 0.24mi |
| 1524 W Monroe St Unit B Phoenix, AZ | 2.0 | 1.0 | 950 | $1,000 | $1.05 | 5d | 1 | 0.24mi |
| 1326 W Monroe St Unit 1326 Phoenix, AZ | 2.0 | 1.5 | 1050 | $1,695 | $1.61 | 1d | 1 | 0.26mi |
| 425 N 17th Dr Unit 2 Phoenix, AZ | 1.0 | 1.0 | 525 | $950 | $1.81 | 1d | 1 | 0.27mi |
| 325 N 17th Dr Unit A Phoenix, AZ | 2.0 | 2.0 | 700 | $1,334 | $1.91 | 1d | 1 | 0.29mi |
| 317 N 17th Dr Apt 6 Phoenix, AZ | 2.0 | 1.0 | 600 | $1,485 | $2.48 | 1d | 1 | 0.30mi |
| 412 N 17th Dr Unit 4 Phoenix, AZ | 2.0 | 1.0 | 817 | $1,195 | $1.46 | 1d | 1 | 0.30mi |
| 719 N 12th Ave Phoenix, AZ | 2.0 | 1.0 | 685 | $1,495 | $2.18 | 1d | 1 | 0.32mi |
| 719 N 12th Ave Unit 1 Phoenix, AZ | 2.0 | 1.0 | 750 | $1,449 | $1.93 | 1d | 1 | 0.32mi |
| 719 N 12th Ave Unit 4 Phoenix, AZ | 2.0 | 1.0 | 685 | $1,395 | $2.04 | 1d | 1 | 0.32mi |
| 1636 W Garfield St Apt 1 Phoenix, AZ | 2.0 | 1.0 | — | $1,195 | — | 1d | 1 | 0.32mi |
| 834 N 13th Ave Phoenix, AZ | 2.0 | 1.0 | 625 | $1,295 | $2.07 | 1d | 4 | 0.33mi |
| 1501 Grand Ave Phoenix, AZ | 1.0 | 1.0 | 518 | $1,200 | $2.32 | 1d | 1 | 0.33mi |
| 1019 W Woodland Ave Apt 3 Phoenix, AZ | 1.0 | 1.0 | 500 | $1,099 | $2.20 | 1d | 1 | 0.37mi |
| 1205 W Roosevelt St Unit 1231 Phoenix, AZ | 3.0 | 2.0 | 1200 | $2,200 | $1.83 | 7d | 1 | 0.37mi |
| 1226 W Roosevelt St Phoenix, AZ | 1.0 | 1.0 | 325 | $699 | $2.15 | 1d | 1 | 0.38mi |
| 646 N 10th Ave Unit 09 Phoenix, AZ | 1.0 | 1.0 | 532 | $1,195 | $2.25 | 1d | 1 | 0.38mi |
| 133 N 11th Ave Unit 133 Phoenix, AZ | 2.0 | 1.0 | 840 | $1,500 | $1.79 | 21d | 1 | 0.39mi |
| 139 N 11th Ave Unit A Phoenix, AZ | 1.0 | 1.0 | 500 | $1,199 | $2.40 | 1d | 1 | 0.39mi |
| 1216 W Roosevelt St Unit 2 Phoenix, AZ | 1.0 | 1.0 | 325 | $699 | $2.15 | 1d | 1 | 0.39mi |
| 129 N 11th Ave Unit 1B Phoenix, AZ | 1.0 | 1.0 | 625 | $1,195 | $1.91 | 1d | 1 | 0.40mi |
| 146 N 10th Ave Phoenix, AZ | 1.0 | 1.0 | 695 | $1,299 | $1.87 | 1d | 1 | 0.40mi |
| 140 N 10th Ave Phoenix, AZ | 1.0 | 1.0 | 620 | $1,400 | $2.26 | 1d | 1 | 0.41mi |
| 1118 W Roosevelt St Phoenix, AZ | 2.0 | 1.0 | 952 | $1,350 | $1.42 | 10d | 1 | 0.41mi |
| 622 N 9th Ave Phoenix, AZ | 1.0 | 1.0 | 525 | $1,195 | $2.28 | 1d | 1 | 0.43mi |
| 1006 N 11th Ave Phoenix, AZ | 1.0 | 1.0 | 500 | $1,599 | $3.20 | 2d | 1 | 0.44mi |
| 1010 N 11th Ave Phoenix, AZ | 1.0 | 1.0 | 500 | $1,699 | $3.40 | 2d | 1 | 0.44mi |
| 1609 W Latham St Phoenix, AZ | 2.0 | 1.0 | 870 | $925 | $1.06 | 10d | 1 | 0.45mi |
| 846 N 10th Ave Unit 3 Phoenix, AZ | 1.0 | 1.0 | 465 | $1,049 | $2.26 | 1d | 1 | 0.46mi |
| 825 N 9th Ave #4 Phoenix, AZ | 3.0 | 3.0 | 1553 | $3,600 | $2.32 | 1d | 1 | 0.51mi |
| 712 W Taylor St Unit 2 Phoenix, AZ | 2.0 | 1.0 | 600 | $1,195 | $1.99 | 1d | 1 | 0.52mi |
| 712 W Taylor St Phoenix, AZ | 2.0 | 1.0 | 600 | $1,395 | $2.33 | 5d | 1 | 0.52mi |
| 712 W Taylor St Unit 4 Phoenix, AZ | 2.0 | 1.0 | — | $1,395 | — | 1d | 1 | 0.52mi |
| 841 N 9th Ave Phoenix, AZ | 2.0 | 1.0 | 903 | $2,000 | $2.21 | 16d | 1 | 0.53mi |
Listing history 12 events
-
2026-06-18days on market $299,900 Active 16 DOM
-
2026-06-17days on market $299,900 Active 15 DOM
-
2026-06-16days on market $299,900 Active 14 DOM
-
2026-06-15days on market $299,900 Active 13 DOM
-
2026-06-13days on market $299,900 Active 11 DOM
-
2026-06-13days on market $299,900 Active 10 DOM
-
2026-06-09days on market $299,900 Active 7 DOM
-
2026-06-08days on market $299,900 Active 6 DOM
-
2026-06-07days on market $299,900 Active 5 DOM
-
2026-06-04days on market $299,900 Active 2 DOM
-
2026-06-02remarks 699-char remark
-
2026-06-02$299,900 Active 1 DOM
ⓘ Source: listings_history table (triggers on properties + properties_extension) + one-shot
backfill from property_details.listing_events for pre-trigger history.
Climate risk First Street
- Flood 3/10 Moderate FEMA zone X (shaded) · 17% chance over 30 yrs
- Wildfire 1/10 Low
- Heat 9/10 Extreme 7 d/yr ≥112°F today · 19 d/yr by 30 yrs out
- Wind 1/10 Low
- Air quality 3/10 Moderate 3 unhealthy d/yr today · 3 by 30 yrs out
Nearby sold comps map
Loading sold comps map…
Walkable amenities ~0.75 mi
Loading nearby amenities…
Taxation est. · year 1
- Rental income
- $47,724
- − Mortgage interest
- −$16,799
- − Property taxes
- −$4,498
- − Insurance
- −$1,500
- − Repairs & maintenance
- −$3,818
- − Management
- −$3,818
- − Depreciation
- −$8,724
- Taxable income
- $8,567
- Est. tax owed @ 24.0%
- −$2,056
- After-tax cash flow
- $10,775/yr
For passive investors: Depreciation is non-cash, so a rental often shows a tax loss while cash-flowing — sheltering income. Rental losses are passive: they offset passive income freely, and up to $25,000/yr can offset ordinary (W-2) income if you actively participate and your MAGI is under $100k (phasing out to $0 by $150k); unused losses carry forward. On sale, claimed depreciation is recaptured at up to 25%, and gains may owe capital-gains tax (a 1031 exchange can defer both). Figures are a year-1 estimate at your 24.0% rate — not tax advice; consult a CPA.
Condition & rehab AI · 12 photos
This multi-family property requires extensive repairs and maintenance to improve its condition and increase its value. The exterior and interior walls are in poor condition, and the flooring and systems need attention. Repairs and updates to these areas will significantly enhance the property's resale and rental value.
Repairs flagged
- Major exterior walls — Cracked and peeling
- Major interior walls — Peeling and uneven
- Major roof — No photos of roof
- Major flooring — No photos of flooring
- Major interior walls/paint — Peeling and uneven
- Major systems — No photos of systems
Value-add opportunities
- Both paint exterior walls — Enhances curb appeal and resale value
- Both repair exterior walls — Improves structural integrity and resale value
- Both repair interior walls — Enhances interior appearance and resale value
- Both repair flooring — Improves living space and resale value
- Both repair interior walls/paint — Enhances interior appearance and resale value
- Both repair systems — Ensures functionality and improves resale value
Renovation cost estimate screening
| Repair item | Severity | Est. cost |
|---|---|---|
| exterior walls · Cracked and peeling | Major | $15,000–50,000 |
| interior walls · Peeling and uneven | Major | $15,000–50,000 |
| roof · No photos of roof | Major | $15,000–50,000 |
| flooring · No photos of flooring | Major | $15,000–50,000 |
| interior walls/paint · Peeling and uneven | Major | $15,000–50,000 |
| systems · No photos of systems | Major | $15,000–50,000 |
| Total estimated repair cost · 6 items | $90,000–300,000 |
Value-add ROI direction
- Both paint exterior walls — Enhances curb appeal and resale value ↑
- Both repair exterior walls — Improves structural integrity and resale value ↑
- Both repair interior walls — Enhances interior appearance and resale value ↑
- Both repair flooring — Improves living space and resale value ↑
- Both repair interior walls/paint — Enhances interior appearance and resale value ↑
- Both repair systems — Ensures functionality and improves resale value ↑
ⓘ Cost ranges are severity-bucket heuristics (US national rule-of-thumb). Get contractor quotes + a written scope before underwriting a rehab budget.
Schools (NCES district)
- District
- Phoenix Union High School District (4286)
- NCES district ID
- 0406330
- Math proficiency
- 10% ▼ -27.00%
- Reading proficiency
- 15% ▼ -18.00%
- Median HH income
- $39,055
- Composite
- 10.63/100
- National rank
- #9773
- State rank
- #224 of 249 in AZ
Livability — Phoenix
- Score
- 75/100
- State rank
- #16
- US rank
- #3924
Category grades
Schools grade is shown separately in the Schools card above.
Census & demographics
- Census place
- Phoenix, AZ
- County
- Maricopa County · 4,537,380 people
- City population
- 1,500,198
- Metro
- Phoenix-Mesa-Chandler, AZ
- Population (ZIP)
- 13,575
- Household income
- $63,616
- Rent vs Own
- Severe rent burden
- 541.0
Population outlook (Maricopa County) Hauer SSP2
- Today (2025)
- 4,979,203 people
- By 2030
- 5,378,229 · +8.0%
- By 2040
- 6,156,598 · +23.6%
- By 2050
- 6,872,376 · +38.0%
- By 2075
- 8,401,270 · +68.7%
- By 2100
- 9,247,439 · +85.7%
Race, ethnicity, and origin ACS 2023
- Neighborhood character
- Diverse neighborhood (Simpson 0.60)
- Race & ethnicity
- Hispanic / Latino 53% Two or more races 37% White 34% Black 8% Native American 2% Asian 2%
- Hispanic origin (detail)
- Mexican 48% Puerto Rican 1%
- Common ancestry
- Italian 4% Portuguese 2% Lithuanian 2%
- Foreign-born
- 16% · Canada, China
- Languages at home
- 65% English-only · Spanish 32% German/W. Germanic 1% Chinese 1%
Political lean MEDSL · Maricopa
- 2024 margin
- Toss-up / Even · D 47.7% · R 51.2% · Other 1.1%
- 2008→2024 swing
- +7.1pp toward D · 2008: -10.6pp · 2024: -3.5pp
- All cycles
- 2024: R+3.5 2020: D+2.2 2016: R+3.5 2012: R+12.0 2008: R+10.6
Not yet ingested
- Civics
- —
Market trends
- HPI YoY
- ▼ -158.06%
- Current HPI
- 388.9189
- Rent YoY
- ▲ 1.35%
- Metro
- Phoenix-Mesa-Chandler, AZ
- State GDP YoY
- ▲ 4.54%
- F500 in state
- 20
Industry mix (Fortune 500 HQ in AZ)
| Industry | F500 HQs | Revenue |
|---|---|---|
| Technology | 2 | $13B |
|
||
| Mining / Metals | 1 | $23B |
|
||
| Environmental Services | 1 | $16B |
|
||
| Metals / Steel | 1 | $14B |
|
||
| Technology Distribution | 1 | $9B |
|
||
| Homebuilding | 1 | $8B |
|
||
Price history
1 event — show timeline
- 2026-06-02 Listed $299,900 ARMLS
Cash-flow waterfall
monthlySold comps — $/sqft
last 12 mo · ≤1 miLoading sold comps…