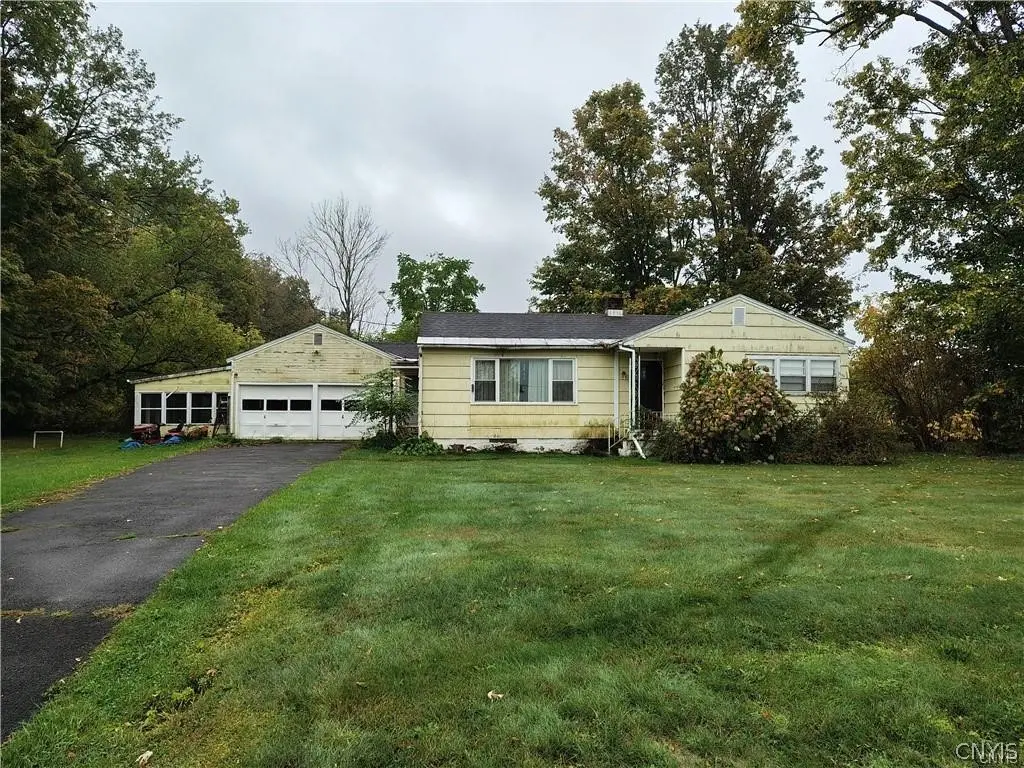
6068 Shed Rd · Rome, NY
Flood risk 1/10 · Minimal
- FEMA flood zone
- X (unshaded)
- Chance of flooding over 30 yrs
- 0.0%
- Est. flood insurance / yr
- $473 – $860
Fire risk 1/10 · Minimal
- Est. fire insurance / yr
- $691 – $1,283
Heat risk 3/10 · Minor
- Hot days now (above 95°F)
- 7 days/yr
- Hot days in 30 yrs
- 16 days/yr
Wind risk 1/10 · Minimal
- Chance of severe wind over 30 yrs
- 0.0%
Air-quality risk 2/10 · Minimal
- Unhealthy air days now
- 0 days/yr
- Unhealthy air days in 30 yrs
- 1 days/yr
Risk factors via First Street. Map © Google.
Why this score? — see what drove the B grade
The composite is a weighted blend of 9 inputs, each scored 0–100. Each bar is that input's sub-score; the figure is the points it added to the 100-point composite (weight × sub-score).
- Cash flow +30.0/30.0
- 1% rule +10.0/10.0
- DSCR +10.0/10.0
- ARV discount +7.5/15.0
- Schools +5.6/10.0
- Livability +3.2/5.0
- Rent growth +2.5/5.0
- Condition / age +2.5/5.0
- Appreciation +0.0/10.0
$99,900
🖨 Deal sheet (PDF) 📄 Offer letter ✓ Due diligence
Listing remarks MLS
Bring your vision and a little TLC to this charming 3-bedroom, 1-bath ranch nestled on a full 1-acre lot with over 1,300 square feet of living space. Located in the Westmoreland School District, this home offers endless potential for investors or buyers looking to create their dream home. Inside, you'll find an eat-in kitchen, a spacious living room, and a large mudroom — perfect for keeping things organized. The three generous bedrooms offer ample closet space and original hardwood floors just waiting to be restored to their former beauty. Additional features include a full basement, crawl space attic, and an attached 2-car garage with power. Enjoy peaceful mornings or relaxing evenings in the screened-in porch just off the garage. Conveniently located just minutes from Route 49 and the City of Rome, you’ll have quick access to shopping, dining, and everyday essentials while still enjoying the tranquility of a country-like setting. Whether you're looking for a promising flip opportunity or a place to make your own, this property is full of potential. Don't miss your chance to unlock its value! ARV value approx. $250,000
Key facts
- Screened-in porch
- Large mudroom
- Full basement
Tags
Neighborhood map
What this means for you Summary
Snapshot
- This is a 3-bed/1.0-bath single-family listed at $100k.
Deal economics
- At list price, monthly cash flow is $379 ($5k/yr) — positive.
- The deal already cash-flows at list — no discount required.
- Meets the 1% rule at list price ($2k rent vs $100k).
- Recommended offer: $88k (12.0% below list) — sets the bar for market timing.
- Cap rate 10.8% vs local median 5.7% in Rome — top-decile yield for the area; either an underpriced asset or a hidden risk that comps aren't pricing in. Stress-test before assuming the spread holds.
Location & tenants
- Location reads 64/100 on livability (#722 in NY) — a middle-class / working-renter tenant base. Strengths: cost of living A+, housing A+; Watch: health & safety C-, schools F, amenities F.
- Westmoreland Central School District (rural): math 61% / reading 68% proficiency, ranked #173 of 590 in NY (top 29%) — acceptable for families but not a draw, mixed tenant base, ~2y average lease.
- Market conditions: 278 active listings in the ZIP; 204 units permitted in Oneida County in 2024 (68 in 5+ unit buildings).
Forward outlook
- Local home prices are declining (-3.0%/yr); year-one equity from $691 of loan paydown is wiped out by about $3k of value loss. Plan a longer hold.
- Oneida County population projected at -12% by 2050 — secular population decline; favor cash flow + early exit over multi-decade hold.
- At projected returns (-3.0% appreciation + 3.0% rent growth), your $28k cash investment doubles in ~8 years — after that, you're playing with house money.
Negotiation context
- It's been on market 125 days — a 12% lower offer ($88k) is reasonable based on typical stale-listing flexibility.
- 2 sale attempts with the ask held roughly flat each time — persistent listings suggest the price (not the market) is what's stuck; bring a comps-based counter.
Risks & watch-outs
- Watch-outs: property tax is 3.6% of price; built in 1953 — expect roof / HVAC / electrical / plumbing capex.
Questions for the listing agent
- It's been on market 125 days. Have you received any prior offers? Is the seller open to a 12% concession, seller financing, or rate buy-down credit?
- Built in 1953 — when were the roof, HVAC, electrical panel, plumbing, and water heater last replaced?
- Property tax is high relative to price — has the assessment been appealed recently, and will the sale trigger a re-assessment?
- Why hasn't it sold? Are there any deal-killer items the seller is aware of (foundation, flood, title, zoning, code violations)?
- Is there a deadline driving the sale (1031 exchange, divorce, estate, relocation)? That informs how much negotiation room exists.
- Schools are F-rated, which usually means shorter tenancies and higher turnover. Who's the typical renter profile here, and what's been the actual vacancy rate?
- What's the average days-on-market for RENTAL listings here right now (not sales)? A rising rental-DOM trend means longer vacancies and softer asking-rent achievability than the comps imply.
- What's the recent tenant-quality profile in this submarket — average credit score on applications, eviction rate, late-payment / NSF rate, and stable-employment percentage? A property-management company in the area should have these aggregated.
- How much new for-sale + rental construction is in the pipeline within 1–3 miles? Heavy new supply typically softens prices + rents 12–24 months out; constrained supply supports both.
Investment metrics
- 1% rule
- 1.58% ✓
- Cap rate
- 10.85%
- Cash-on-cash
- 16.27%
- DSCR
- 1.72
- GRM
- 5.3
CMA / ARV
- ARV (median comp)
- $234,564
- List price
- $99,900
- Delta
- -57.41%
- Verdict
- UNDERPRICED
- Comps
- 6 within 1.0 mi
Projected returns pro-forma
-3.0% appreciation · 3.0% rent growth · sell at horizon
- IRR
- 7.4%
- Equity multiple
- 1.29×
- Total profit
- $8,106
- Equity at exit
- $14,895
- IRR
- 16.8%
- Equity multiple
- 2.38×
- Total profit
- $38,713
- Equity at exit
- $8,638
Cash invested: $27,972 (down + closing). Projections, not guarantees.
Landlord ↔ Tenant lean methodology
- Overall (STATE)
- 15 Strongly Tenant-Friendly
- State New York
- 15 Strongly Tenant-Friendly · D+10
- County
- — inherits STATE
- City
- — inherits STATE
ZIP-level market 13440
- Home prices YoY
- -8.0%
- Active inventory
- 278
- Price-to-rent
- 5.3×
Monthly cashflow live
- Estimated rent
- $1,580 medium interval (Pro) →
- Mortgage (P&I)
- −$524
- Tax from tax record
- −$304 /mo · $3,645/yr
- Insurance
- −$42
- HOA
- −$0
- Vacancy / Maint / Mgmt
- −$332
- Net cashflow
- $379
Break-even live
Sensitivity live
| Price | -10% $436 | -5% $408 | +0% $379 | +5% $351 | +10% $323 |
|---|---|---|---|---|---|
| Rent | -10% $254 | -5% $317 | +0% $379 | +5% $442 | +10% $504 |
| Rate | -1.0pp $430 | -0.5pp $405 | base $379 | +0.5pp $353 | +1.0pp $327 |
UW: 25.0% down · 7.5% · 30yr · 1.5% tax · 5.0% vac · 8.0% maint · 8.0% mgmt
Financing live
Cash to close
- Down payment
- $24,975
- Closing costs
- $2,997
- Reserves months
- —
- Total cash needed
- —
Loan-product check · same deal, 3 products live
Conventional
25% down · 7.5% · 30yr
- Down + closing
- —
- Monthly P&I
- —
- Monthly cashflow
- —
- DSCR
- —
- Eligible?
- —
Personal DTI + credit; lowest rate.
DSCR
20% down · 8.5% · 30yr
- Down + closing
- —
- Monthly P&I
- —
- Monthly cashflow
- —
- DSCR
- —
- Eligible?
- —
No personal income docs; deal must DSCR.
Hard money
10% down · 12.0% · 12mo
- Down + closing
- —
- Monthly P&I
- —
- Monthly cashflow
- —
- DSCR
- —
- Eligible?
- —
Short-term bridge; refi at stabilization.
Listing history 20 events
-
2026-06-21days on market $99,900 Active 125 DOM
-
2026-06-19days on market $99,900 Active 123 DOM
-
2026-06-18days on market $99,900 Active 122 DOM
-
2026-06-17days on market $99,900 Active 121 DOM
-
2026-06-16days on market $99,900 Active 120 DOM
-
2026-06-15days on market $99,900 Active 119 DOM
-
2026-06-14days on market $99,900 Active 117 DOM
-
2026-06-13days on market $99,900 Active 116 DOM
-
2026-06-10days on market $99,900 Active 114 DOM
-
2026-06-09days on market $99,900 Active 113 DOM
-
2026-06-08days on market $99,900 Active 112 DOM
-
2026-06-07days on market $99,900 Active 111 DOM
-
2026-06-03days on market $99,900 Active 107 DOM
-
2026-06-02days on market $99,900 Active 106 DOM
-
2026-06-01days on market $99,900 Active 105 DOM
-
2026-05-31days on market $99,900 Active 104 DOM
-
2026-05-30days on market $99,900 Active 103 DOM
-
2026-02-16$99,900 Active 1150-char remark
Show marketing remark (1150 chars)
Bring your vision and a little TLC to this charming 3-bedroom, 1-bath ranch nestled on a full 1-acre lot with over 1,300 square feet of living space. Located in the Westmoreland School District, this home offers endless potential for investors or buyers looking to create their dream home. Inside, you'll find an eat-in kitchen, a spacious living room, and a large mudroom — perfect for keeping things organized. The three generous bedrooms offer ample closet space and original hardwood floors just waiting to be restored to their former beauty. Additional features include a full basement, crawl space attic, and an attached 2-car garage with power. Enjoy peaceful mornings or relaxing evenings in the screened-in porch just off the garage. Conveniently located just minutes from Route 49 and the City of Rome, you’ll have quick access to shopping, dining, and everyday essentials while still enjoying the tranquility of a country-like setting. Whether you're looking for a promising flip opportunity or a place to make your own, this property is full of potential. Don't miss your chance to unlock its value! ARV value approx. $250,000
-
2026-02-15historical
-
2025-09-24$109,900 Active
ⓘ Source: listings_history table (triggers on properties + properties_extension) + one-shot
backfill from property_details.listing_events for pre-trigger history.
Tax reassessment forecast NY · Partial reset (capped growth)
- Current annual tax
- $3,645 · $304/mo
- Projected year-2 tax
- $3,645 · $304/mo
- Expected delta
- $0/yr ($0/mo · 0.0%)
ⓘ Screening estimate from a state-policy table — verify with the county assessor before closing.
Climate risk First Street
- Flood 1/10 Low FEMA zone X (unshaded) · 0% chance over 30 yrs
- Wildfire 1/10 Low
- Heat 3/10 Moderate 7 d/yr ≥95°F today · 16 d/yr by 30 yrs out
- Wind 1/10 Low 0% chance of damaging wind over 30 yrs
- Air quality 2/10 Low 0 unhealthy d/yr today · 1 by 30 yrs out
Nearby sold comps map
Loading sold comps map…
Walkable amenities ~0.75 mi
Loading nearby amenities…
Taxation est. · year 1
- Rental income
- $18,966
- − Mortgage interest
- −$5,596
- − Property taxes
- −$3,645
- − Insurance
- −$500
- − Repairs & maintenance
- −$1,517
- − Management
- −$1,517
- − Depreciation
- −$2,906
- Taxable income
- $3,285
- Est. tax owed @ 24.0%
- −$788
- After-tax cash flow
- $3,764/yr
For passive investors: Depreciation is non-cash, so a rental often shows a tax loss while cash-flowing — sheltering income. Rental losses are passive: they offset passive income freely, and up to $25,000/yr can offset ordinary (W-2) income if you actively participate and your MAGI is under $100k (phasing out to $0 by $150k); unused losses carry forward. On sale, claimed depreciation is recaptured at up to 25%, and gains may owe capital-gains tax (a 1031 exchange can defer both). Figures are a year-1 estimate at your 24.0% rate — not tax advice; consult a CPA.
Schools (NCES district)
- District
- Westmoreland Central School District
- NCES district ID
- 3631050
- Math proficiency
- 61% ▼ -1.00%
- Reading proficiency
- 68% ▲ 7.00%
- Median HH income
- $64,671
- Composite
- 56.19/100
- National rank
- #1176
- State rank
- #173 of 590 in NY
Livability — Rome
- Score
- 64/100
- State rank
- #722
- US rank
- #13676
Category grades
Schools grade is shown separately in the Schools card above.
Census & demographics
- City population
- 41,418
- Population (ZIP)
- 41,273
Population outlook (Oneida County) Hauer SSP2
- Today (2025)
- 225,223 people
- By 2030
- 220,384 · -2.1%
- By 2040
- 209,071 · -7.2%
- By 2050
- 197,920 · -12.1%
- By 2075
- 175,541 · -22.1%
- By 2100
- 148,491 · -34.1%
Race, ethnicity, and origin ACS 2023
- Neighborhood character
- Predominantly White (82%)
- Race & ethnicity
- White 82% Hispanic / Latino 7% Two or more races 6% Black 4% Asian 1%
- Hispanic origin (detail)
- Mexican 1% Puerto Rican 4%
- Common ancestry
- Romanian 9% Lithuanian 4% Slovak 1%
- Foreign-born
- 3% · Canada, China
- Languages at home
- 94% English-only · Spanish 3% Other Indo-European 1%
Political lean MEDSL · Oneida
- 2024 margin
- Strong R (+21.3) · D 39.4% · R 60.6%
- 2008→2024 swing
- -15.2pp toward R · 2008: -6.1pp · 2024: -21.3pp
- All cycles
- 2024: R+21.3 2020: R+15.5 2016: R+21.1 2012: R+5.3 2008: R+6.1
Not yet ingested
- Civics
- —
Market trends
- HPI YoY
- ▼ -29.58%
- Current HPI
- 339.3589
- Rent YoY
- —
- Metro
- —
- State GDP YoY
- ▲ 2.60%
- F500 in state
- 92
Industry mix (Fortune 500 HQ in NY)
| Industry | F500 HQs | Revenue |
|---|---|---|
| Financial Services | 10 | $950B |
|
||
| Consumer Goods | 9 | $162B |
|
||
| Insurance | 4 | $225B |
|
||
| Telecommunications | 2 | $144B |
|
||
| Pharmaceuticals | 2 | $112B |
|
||
| Media / Entertainment | 2 | $69B |
|
||
Price history
-9.1% since first listed3 events — show timeline
- 2026-02-16 Listed $99,900 CNYIS
- 2026-02-15 Listing Removed — CNYIS
- 2025-09-24 Listed $109,900 CNYIS
Property tax history
+7.1%/yrLatest (2025): $3,645 · +4.3% YoY. Source: county tax records.
Cash-flow waterfall
monthlySold comps — $/sqft
last 12 mo · ≤1 miLoading sold comps…