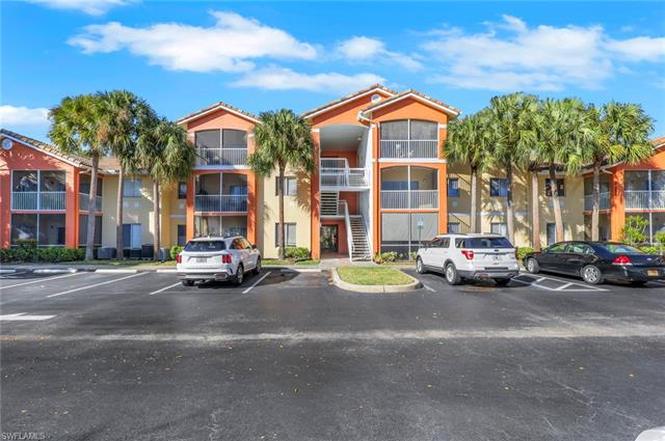
6321 Aragon Way #206 · Villas, FL
Flood risk 3/10 · Minor
- FEMA flood zone
- X (unshaded)
- Chance of flooding over 30 yrs
- 0.13%
- Est. flood insurance / yr
- $507 – $1,088
Fire risk 3/10 · Minor
- Est. fire insurance / yr
- $947 – $1,759
Heat risk 10/10 · Severe
- Hot days now (above 107°F)
- 7 days/yr
- Hot days in 30 yrs
- 31 days/yr
Wind risk 10/10 · Severe
- Chance of severe wind over 30 yrs
- 99.0%
Air-quality risk 2/10 · Minimal
- Unhealthy air days now
- 1 days/yr
- Unhealthy air days in 30 yrs
- 1 days/yr
Risk factors via First Street. Map © Google.
Why this score? — see what drove the D- grade
The composite is a weighted blend of 9 inputs, each scored 0–100. Each bar is that input's sub-score; the figure is the points it added to the 100-point composite (weight × sub-score).
- Cash flow +11.2/30.0
- ARV discount +7.5/15.0
- 1% rule +5.3/10.0
- Schools +4.1/10.0
- Livability +4.0/5.0
- DSCR +3.3/10.0
- Condition / age +2.5/5.0
- Rent growth +1.2/5.0
- Appreciation +0.0/10.0
$157,500
🖨 Deal sheet 📄 Offer letter ✓ Due diligence
Listing remarks MLS
2 bedroom, 1 bath. Nice unit with all appliances. Screened lani. FreddieMac owned and ready to go.
Key facts
- Fitness center
- Tennis courts
- Heated pool
Tags
Property features AI
Other
- Listing information: Possession at closing
Finance
- Other: Part of a complex with 248 units; 20 units in the building; 2 units per floor; building has 1 floor
- Financial info: Information not provided
- HOA & community: Mandatory HOA with monthly master fee of $306; On-site management; HOA maintenance covers irrigation water, lawn/land maintenance, manager, exterior pest control, recreation facilities, reserve, street lights, street maintenance, trash removal, and water; Community amenities include clubhouse, community pool, spa/hot tub, exercise room, sidewalks, streetlights, tennis court, and underground utilities; Community type includes gated and tennis; Total annual recurring fees approximately $3,672
Exterior
- Parking: Information not provided
- Security: Gated community
- Utilities: Central water; Central sewer; Cable available
- Home design: Residential low-rise building (1–3 stories); Condo in Tuscany Gardens development; Built in 1998; Lot/Unit number 206
- Construction: Concrete block construction
- Exterior features: Storage; Single-hung windows; Stucco exterior; Tile roof; Zero lot line; Rear exposure facing south; Deeded restrictions (No RV)
Interior
- Kitchen: Dishwasher; Disposal; Microwave; Range; Self-cleaning oven; Refrigerator/Freezer; Pantry
- Bedrooms: 2 bedrooms
- Flooring: Carpet; Tile
- Bathrooms: 1 full bathroom with tub only (master bath: tub only)
- Heating & cooling: Central electric heat; Central electric cooling; Ceiling fans
- Interior features: Cable prewire; Fire sprinkler system; High-speed internet available; Pantry; Smoke detectors; Walk-in closet; Window coverings; Breakfast bar / dining in living area; Laundry in residence; Screened balcony; Great room floor plan
- Laundry & utility: Washer and dryer in unit
Utilities
- Utility information: Central water; Central sewer; Central electric heat; Central electric cooling; Ceiling fans; Cable available
Neighborhood map
What this means for you Summary
Snapshot
- This is a 2-bed/1.0-bath condo listed at $158k.
Deal economics
- At list price, monthly cash flow is $-60 ($-725/yr) — negative.
- To cash-flow at today's rent, offer at most $147k (6.8% below list).
- Meets the 1% rule at list price ($2k rent vs $158k).
- Recommended offer: $139k (12.0% below list) — sets the bar for market timing.
- Cap rate 5.8% vs local median 1.3% in Villas — top-decile yield for the area; either an underpriced asset or a hidden risk that comps aren't pricing in. Stress-test before assuming the spread holds.
Location & tenants
- Location reads 81/100 on livability (#94 in FL, #1,462 nationally) — a professional / high-income tenant draw. Strengths: cost of living A+, housing A+, health & safety A+; Watch: commute C-, schools F, amenities D-.
- Lee (suburban): math 47% / reading 50% proficiency, ranked #42 of 73 in FL (top 58%) — families likely to look elsewhere, expect single-tenant / working-renter base with shorter leases.
- Market conditions: Rents falling (-5.3%/yr); 181 active listings in the ZIP; 40 comparable units currently listed for rent nearby; rentals at typical pace (median 24d on market — plan ~3-4 weeks tenant-placement turnaround); solid renter incomes; 15,411 units permitted in Lee County in 2024 (4,686 in 5+ unit buildings).
Forward outlook
- Local home prices are declining (-3.0%/yr); year-one equity from $1k of loan paydown is wiped out by about $5k of value loss. Plan a longer hold.
- Lee County population projected at +44% by 2050 — long-run rental-demand tailwind backs the buy-and-hold thesis.
Negotiation context
- It's been on market 131 days — a 12% lower offer ($139k) is reasonable based on typical stale-listing flexibility.
- 5 sale attempts; this cycle's ask is 12757% above the opening price — seller raised mid-cycle; expect resistance to lowballs.
- Current owner paid $35k; list at $158k implies a 350% gain — meaningful room to come down on a strong offer.
Risks & watch-outs
- Climate carrying-cost: severe wind risk, 99% chance of damaging wind over 30y; extreme-heat days projected 7→31/yr by 2055 (HVAC capex compounding) — expect insurance premiums to compound above CPI over the hold.
Questions for the listing agent
- What do current leases actually rent for vs. the listed asking? Can we see a recent rent roll and the last 12 months of T-12 income?
- It's been on market 131 days. Have you received any prior offers? Is the seller open to a 12% concession, seller financing, or rate buy-down credit?
- What does the HOA fee cover, when was the last increase, and are there any pending special assessments or reserve-fund shortfalls?
- Any open or pending special assessments — roof, HVAC, plumbing, elevator, façade? What's the per-unit balance and payoff schedule, and is the seller paying it off at close or rolling it to the buyer?
- Why hasn't it sold? Are there any deal-killer items the seller is aware of (foundation, flood, title, zoning, code violations)?
- Is there a deadline driving the sale (1031 exchange, divorce, estate, relocation)? That informs how much negotiation room exists.
- Schools are F-rated, which usually means shorter tenancies and higher turnover. Who's the typical renter profile here, and what's been the actual vacancy rate?
- The area grade is low — what's the realistic commute time and amenity access for the typical tenant pool here? Any planned neighborhood developments (good or bad) we should know about?
- What's the average days-on-market for RENTAL listings here right now (not sales)? A rising rental-DOM trend means longer vacancies and softer asking-rent achievability than the comps imply.
- What's the recent tenant-quality profile in this submarket — average credit score on applications, eviction rate, late-payment / NSF rate, and stable-employment percentage? A property-management company in the area should have these aggregated.
- How much new apartment / multifamily construction is in the pipeline within 1–3 miles? Heavy new supply (>2% of stock underway) typically softens rents 12–24 months out; light construction supports rent growth.
Investment metrics
- 1% rule
- 1.03% ✓
- Cap rate
- 5.83%
- Cash-on-cash
- -1.64%
- DSCR
- 0.93
- GRM
- 8.1
CMA / ARV
No comps found within radius.
Projected returns pro-forma
-3.0% appreciation · 0.0% rent growth · sell at horizon
- IRR
- -23.2%
- Equity multiple
- 0.23×
- Total profit
- $-33,958
- Equity at exit
- $23,484
- IRR
- -32.7%
- Equity multiple
- -0.18×
- Total profit
- $-52,225
- Equity at exit
- $13,618
Cash invested: $44,100 (down + closing). Projections, not guarantees.
Landlord ↔ Tenant lean methodology
- Overall (STATE)
- 87 Strongly Landlord-Friendly
- State Florida
- 87 Strongly Landlord-Friendly · R+3
- County
- — inherits STATE
- City
- — inherits STATE
ZIP-level market 33966
- Home prices YoY
- -24.2%
- Rents YoY
- -5.3%
- Active inventory
- 181
- Price-to-rent
- 8.1×
Monthly cashflow live
- Estimated rent
- $1,629 high interval (Pro) →
- Mortgage (P&I)
- −$826
- Tax from tax record
- −$150 /mo · $1,796/yr
- Insurance
- −$66
- HOA
- −$306
- Vacancy / Maint / Mgmt
- −$342
- Net cashflow
- $-60
Break-even live
UW: 25.0% down · 7.5% · 30yr · 1.5% tax · 5.0% vac · 8.0% maint · 8.0% mgmt
Financing live
Cash to close
- Down payment
- $39,375
- Closing costs
- $4,725
- Reserves months
- —
- Total cash needed
- —
Loan-product check · same deal, 3 products live
Conventional
25% down · 7.5% · 30yr
- Down + closing
- —
- Monthly P&I
- —
- Monthly cashflow
- —
- DSCR
- —
- Eligible?
- —
Personal DTI + credit; lowest rate.
DSCR
20% down · 8.5% · 30yr
- Down + closing
- —
- Monthly P&I
- —
- Monthly cashflow
- —
- DSCR
- —
- Eligible?
- —
No personal income docs; deal must DSCR.
Hard money
10% down · 12.0% · 12mo
- Down + closing
- —
- Monthly P&I
- —
- Monthly cashflow
- —
- DSCR
- —
- Eligible?
- —
Short-term bridge; refi at stabilization.
Rent comps 40 comps
| Address | Beds | Baths | Sqft | Rent | $/sqft | DOM | Units | Dist |
|---|---|---|---|---|---|---|---|---|
| 6321 Aragon Way #306 Fort Myers, FL | 2.0 | 1.0 | 956 | $1,425 | $1.49 | 21d | 1 | 0.03mi |
| 6321 Aragon Way Fort Myers, FL | 1.0–2.0 | 1.0 | 942 | $1,425 | $1.51 | 16d | 2 | 0.03mi |
| 13141 Bella Casa Cir #3177 Fort Myers, FL | 2.0 | 2.0 | 985 | $1,500 | $1.52 | 19d | 1 | 0.04mi |
| 6361 Aragon Way #303 Fort Myers, FL | 2.0 | 2.0 | 1085 | $1,650 | $1.52 | 23d | 1 | 0.09mi |
| 6401 Aragon Way #204 Fort Myers, FL | 2.0 | 2.0 | 1085 | $1,650 | $1.52 | 23d | 1 | 0.12mi |
| 6360 Aragon Way Fort Myers, FL | 2.0 | 1.0 | 956 | $1,550 | $1.62 | 21d | 2 | 0.14mi |
| 6360 Aragon Way Fort Myers, FL | 2.0 | 1.0 | 956 | $1,550 | $1.62 | 3d | 2 | 0.14mi |
| 13170 Bella Casa Cir #293 Fort Myers, FL | 1.0 | 1.0 | 767 | $1,600 | $2.09 | 3d | 1 | 0.16mi |
| 13180 Bella Casa Cir #273 Fort Myers, FL | 2.0 | 2.0 | 1047 | $1,950 | $1.86 | 23d | 1 | 0.20mi |
| 13100 Bella Casa Cir #337 Fort Myers, FL | 1.0 | 1.0 | 767 | $1,800 | $2.35 | 23d | 1 | 0.22mi |
| 13190 Bella Casa Cir #255 Fort Myers, FL | 2.0 | 2.0 | 1083 | $1,695 | $1.57 | 23d | 1 | 0.23mi |
| 6481 Aragon Way #205 Fort Myers, FL | 2.0 | 1.0 | 956 | $1,450 | $1.52 | 3d | 1 | 0.23mi |
| 6490 Aragon Way Fort Myers, FL | 2.0 | 2.0 | 1085 | $1,570 | $1.45 | 23d | 2 | 0.24mi |
| 8730 Fordham St Fort Myers, FL | 2.0 | 1.0 | 1016 | $1,700 | $1.67 | 23d | 1 | 0.61mi |
| 13226 Whitehaven Ln #1305 Fort Myers, FL | 2.0 | 2.0 | 950 | $1,450 | $1.53 | 23d | 1 | 0.62mi |
| 13001 Corbel Cir Fort Myers, FL | 1.0–3.0 | 1.0–2.0 | 1161 | $1,940 | $1.67 | 1d | 31 | 0.66mi |
| 13211 Whitehaven Ln #1504 Fort Myers, FL | 2.0 | 2.0 | 950 | $1,950 | $2.05 | 23d | 1 | 0.69mi |
| 13247 Whitehaven Ln #705 Fort Myers, FL | 2.0 | 2.0 | 950 | $1,500 | $1.58 | 23d | 1 | 0.69mi |
| 13621 Parkcrest Blvd Fort Myers, FL | 1.0–3.0 | 1.0–2.0 | 1039 | $1,652 | $1.59 | 2d | 14 | 0.72mi |
| 12810 Cypress Cape Cir Fort Myers, FL | 1.0–3.0 | 1.0–2.0 | 1158 | $1,788 | $1.54 | 2d | 17 | 0.88mi |
| 2348 Burton Ave Fort Myers, FL | 2.0 | 1.0 | 1024 | $1,895 | $1.85 | 12d | 1 | 0.91mi |
| 13264 White Marsh Ln #3312 Fort Myers, FL | 2.0 | 2.0 | 992 | $2,500 | $2.52 | 23d | 1 | 1.31mi |
| 13264 White Marsh Ln #3321 Fort Myers, FL | 2.0 | 1.0 | 792 | $1,400 | $1.77 | 23d | 1 | 1.31mi |
| 13264 White Marsh Ln #3324 Fort Myers, FL | 2.0 | 2.0 | 992 | $1,400 | $1.41 | 23d | 1 | 1.31mi |
| 13150 White Marsh Ln #203 Fort Myers, FL | 2.0 | 2.0 | 844 | $1,500 | $1.78 | 23d | 1 | 1.32mi |
| 13130 White Marsh Ln #207 Fort Myers, FL | 2.0 | 2.0 | 893 | $1,650 | $1.85 | 23d | 1 | 1.32mi |
| 7301 Lake Bank Loop Fort Myers, FL | 1.0–3.0 | 1.0–2.5 | 1234 | $2,374 | $1.92 | 2d | 124 | 1.35mi |
| 13170 White Marsh Ln #200 Fort Myers, FL | 2.0 | 2.0 | 893 | $3,400 | $3.81 | 23d | 1 | 1.36mi |
| 13076 Cross Creek Ct #403 Fort Myers, FL | 2.0 | 2.0 | 847 | $1,600 | $1.89 | 23d | 1 | 1.37mi |
| 13240 White Marsh Ln #3127 Fort Myers, FL | 2.0 | 2.0 | 960 | $3,000 | $3.12 | 23d | 1 | 1.38mi |
| 13545 Eagle Ridge Dr Fort Myers, FL | 1.0 | 1.0 | 752 | $1,350 | $1.80 | 3d | 3 | 1.38mi |
| 13545 Eagle Ridge Dr Fort Myers, FL | 1.0 | 1.0 | 752 | $1,375 | $1.83 | 23d | 2 | 1.38mi |
| 13240 White Marsh Ln #25 Fort Myers, FL | 2.0 | 2.0 | 1079 | $1,900 | $1.76 | 23d | 1 | 1.38mi |
| 13288 White Marsh Ln #12 Fort Myers, FL | 2.0 | 2.0 | 1079 | $2,000 | $1.85 | 23d | 1 | 1.39mi |
| 13288 White Marsh Ln #12 Fort Myers, FL | 2.0 | 2.0 | 1079 | $2,000 | $1.85 | 16d | 1 | 1.39mi |
| 13288 White Marsh Ln #3439 Fort Myers, FL | 2.0 | 2.0 | 960 | $1,500 | $1.56 | 23d | 1 | 1.40mi |
| 13094 Cross Creek Ct #113 Fort Myers, FL | 2.0 | 2.0 | 895 | $1,700 | $1.90 | 23d | 1 | 1.41mi |
| 13555 Eagle Ridge Dr Fort Myers, FL | 1.0 | 1.0 | 673 | $1,300 | $1.93 | 23d | 3 | 1.41mi |
| 13555 Eagle Ridge Dr Fort Myers, FL | 1.0 | 1.0 | 673 | $1,248 | $1.85 | 16d | 2 | 1.41mi |
| 13521 Eagle Ridge Dr Fort Myers, FL | 1.0 | 1.0 | 673 | $1,400 | $2.08 | 3d | 4 | 1.42mi |
HOA detail condo
- Monthly dues
- $306 · $3,672/yr
- Assessments
- None detected in remarks — confirm with the listing agent.
Listing history 29 events
-
2026-06-17days on market $157,500 Active 131 DOM
-
2026-06-16days on market $157,500 Active 130 DOM
-
2026-06-15days on market $157,500 Active 129 DOM
-
2026-06-13days on market $157,500 Active 127 DOM
-
2026-06-10days on market $157,500 Active 124 DOM
-
2026-06-09pricedays on market $157,500 Active 123 DOM
-
2026-06-07days on market $158,900 Active 121 DOM
-
2026-06-02days on market $158,900 Active 116 DOM
-
2026-06-01days on market $158,900 Active 115 DOM
-
2026-06-01days on market $158,900 Active 114 DOM
-
2026-03-27price $158,900
-
2026-03-27$1,225
-
2026-03-14historical $1,295
-
2026-02-09$1,295
-
2026-02-09historical $1,295
-
2026-02-06$159,900 Active
-
2026-01-04$1,295
-
2026-01-01historical $1,350
-
2025-11-13price $1,350
-
2025-10-26price $1,400
-
2025-08-21price $1,550
-
2025-07-18$1,600
-
2010-09-28soldstatus $35,000 98-char remark
Show marketing remark (98 chars)
2 bedroom, 1 bath. Nice unit with all appliances. Screened lani. FreddieMac owned and ready to go.
-
2010-08-20price $37,900 98-char remark
Show marketing remark (98 chars)
2 bedroom, 1 bath. Nice unit with all appliances. Screened lani. FreddieMac owned and ready to go.
-
2006-11-24price $169,900 413-char remark
Show marketing remark (413 chars)
Least expensive newer 2 bedroom in South Fort Myers. Private location w/ southern exposure from lanai. One year new paint, carpet, A/C and dishwasher. French doors to second bedroom. .. nice Dining room with track lighting, large and bright bath. Unit has separate storage on same floor plus a laundry room off kitchen. .. a must see for the money! Garage has new paint and is available for an additional 12,500.
-
2006-11-22soldstatus $160,000
-
2006-11-20soldstatus $160,000 413-char remark
Show marketing remark (413 chars)
Least expensive newer 2 bedroom in South Fort Myers. Private location w/ southern exposure from lanai. One year new paint, carpet, A/C and dishwasher. French doors to second bedroom. .. nice Dining room with track lighting, large and bright bath. Unit has separate storage on same floor plus a laundry room off kitchen. .. a must see for the money! Garage has new paint and is available for an additional 12,500.
-
2004-11-08soldstatus $24,050,000
-
2004-11-08soldstatus $24,050,000
ⓘ Source: listings_history table (triggers on properties + properties_extension) + one-shot
backfill from property_details.listing_events for pre-trigger history.
Tax reassessment forecast FL · Resets to sale price
- Current annual tax
- $1,796 · $150/mo
- Projected year-2 tax
- $1,796 · $150/mo
- Expected delta
- $0/yr ($0/mo · 0.0%)
ⓘ Screening estimate from a state-policy table — verify with the county assessor before closing.
Climate risk First Street
- Flood 3/10 Moderate FEMA zone X (unshaded) · 13% chance over 30 yrs
- Wildfire 3/10 Moderate
- Heat 10/10 Extreme 7 d/yr ≥107°F today · 31 d/yr by 30 yrs out
- Wind 10/10 Extreme 99% chance of damaging wind over 30 yrs
- Air quality 2/10 Low 1 unhealthy d/yr today · 1 by 30 yrs out
Nearby sold comps map
Loading sold comps map…
Walkable amenities ~0.75 mi
Loading nearby amenities…
Taxation est. · year 1
- Rental income
- $19,547
- − Mortgage interest
- −$8,822
- − Property taxes
- −$1,796
- − Insurance
- −$788
- − Repairs & maintenance
- −$1,564
- − Management
- −$1,564
- − HOA
- −$3,672
- − Depreciation
- −$4,582
- Taxable loss
- −$3,240
- Est. tax savings @ 24.0%
- +$778
- After-tax cash flow
- $53/yr
For passive investors: Depreciation is non-cash, so a rental often shows a tax loss while cash-flowing — sheltering income. Rental losses are passive: they offset passive income freely, and up to $25,000/yr can offset ordinary (W-2) income if you actively participate and your MAGI is under $100k (phasing out to $0 by $150k); unused losses carry forward. On sale, claimed depreciation is recaptured at up to 25%, and gains may owe capital-gains tax (a 1031 exchange can defer both). Figures are a year-1 estimate at your 24.0% rate — not tax advice; consult a CPA.
Schools (NCES district)
- District
- Lee
- NCES district ID
- 1201080
- Math proficiency
- 47% ▼ -11.00%
- Reading proficiency
- 50% ▼ -4.00%
- Median HH income
- $49,518
- Composite
- 41.49/100
- National rank
- #3458
- State rank
- #42 of 73 in FL
Livability — Villas
- Score
- 81/100
- State rank
- #94
- US rank
- #1462
Category grades
Schools grade is shown separately in the Schools card above.
Census & demographics
- County
- Lee County · 788,662 people
- City population
- 24,828
- Metro
- Cape Coral-Fort Myers, FL
- Population (ZIP)
- 12,513
- Household income
- $84,965
- Rent vs Own
- Severe rent burden
- 539.0
Population outlook (Lee County) Hauer SSP2
- Today (2025)
- 871,946 people
- By 2030
- 955,468 · +9.6%
- By 2040
- 1,113,587 · +27.7%
- By 2050
- 1,256,891 · +44.1%
- By 2075
- 1,560,270 · +78.9%
- By 2100
- 1,726,848 · +98.0%
Race, ethnicity, and origin ACS 2023
- Neighborhood character
- Predominantly White (69%)
- Race & ethnicity
- White 69% Two or more races 15% Hispanic / Latino 12% Black 7% Asian 4%
- Hispanic origin (detail)
- Mexican 1% Puerto Rican 2% Cuban 1%
- Common ancestry
- Hispanic 4% Romanian 3% Slovak 3%
- Foreign-born
- 13% · Canada, Vietnam, Philippines
- Languages at home
- 83% English-only · Spanish 10% Other Indo-European 2% Other Asian/Pacific 2%
Political lean MEDSL · Lee
- 2024 margin
- Strong R (+28.4) · D 35.5% · R 63.9%
- 2008→2024 swing
- -18.0pp toward R · 2008: -10.4pp · 2024: -28.4pp
- All cycles
- 2024: R+28.4 2020: R+19.2 2016: R+20.4 2012: R+16.6 2008: R+10.4
Not yet ingested
- Civics
- —
Market trends
- HPI YoY
- ▼ -70.16%
- Current HPI
- 219.1188
- Rent YoY
- ▼ -5.28%
- Metro
- Cape Coral-Fort Myers, FL
- State GDP YoY
- ▲ 3.28%
- F500 in state
- 36
Industry mix (Fortune 500 HQ in FL)
| Industry | F500 HQs | Revenue |
|---|---|---|
| Industrial Technology | 2 | $29B |
|
||
| Insurance | 2 | $17B |
|
||
| Retail | 1 | $60B |
|
||
| Technology Distribution | 1 | $58B |
|
||
| Homebuilding | 1 | $35B |
|
||
| Technology Manufacturing | 1 | $35B |
|
||
Price history
-99.3% since first listed19 events — show timeline
- 2026-03-27 Price Changed $158,900 BEARMLS
- 2026-03-27 Listed for Rent $1,225 FGCMLS
- 2026-03-14 Rental Removed $1,295 FGCMLS
- 2026-02-09 Listed for Rent $1,295 FGCMLS
- 2026-02-09 Rental Removed $1,295 BEARMLS
- 2026-02-06 Listed $159,900 BEARMLS
- 2026-01-04 Listed for Rent $1,295 BEARMLS
- 2026-01-01 Rental Removed $1,350 NAPLESMLS
- 2025-11-13 Price Changed $1,350 NAPLESMLS
- 2025-10-26 Price Changed $1,400 NAPLESMLS
- 2025-08-21 Price Changed $1,550 NAPLESMLS
- 2025-07-18 Listed for Rent $1,600 NAPLESMLS
- 2010-09-28 Sold (MLS) $35,000 FORTMLS
- 2010-08-20 Price Changed $37,900 FORTMLS
- 2006-11-24 Price Changed $169,900 FORTMLS
- 2006-11-22 Sold (Public Records) $160,000 Public Records
- 2006-11-20 Sold (MLS) $160,000 FORTMLS
- 2004-11-08 Sold (Public Records) $24,050,000 Public Records
- 2004-11-08 Sold (Public Records) $24,050,000 Public Records
Property tax history
+7.4%/yrLatest (2025): $1,796 · +1.5% YoY. Source: county tax records.
Cash-flow waterfall
monthlySold comps — $/sqft
last 12 mo · ≤1 miLoading sold comps…