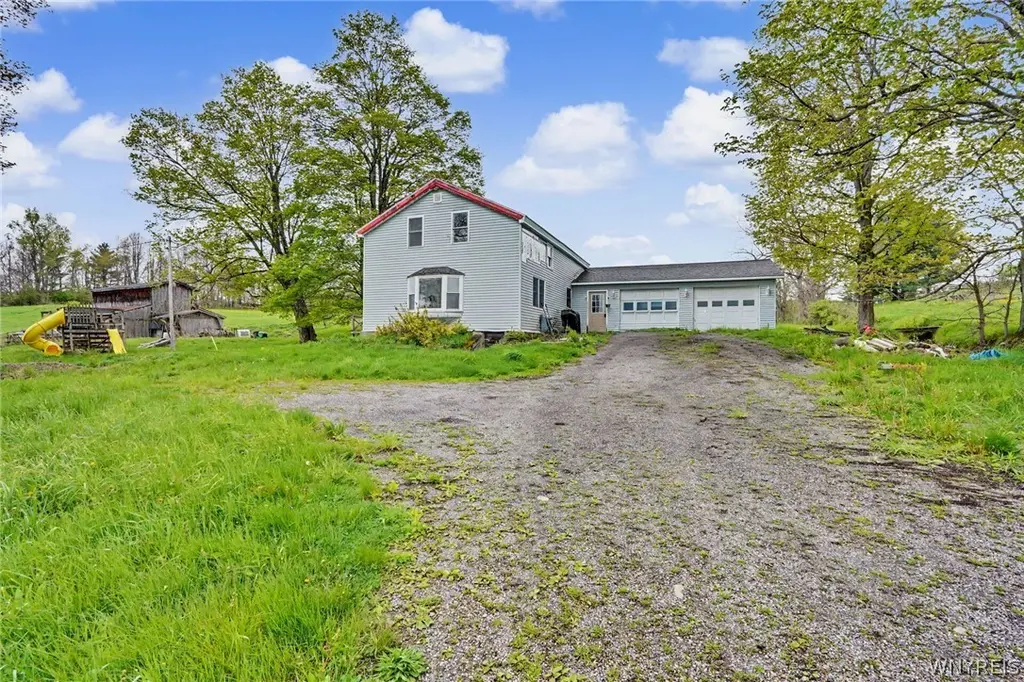
6300 Hill Rd · Fillmore, NY
Flood risk 4/10 · Minor
- FEMA flood zone
- X
- Chance of flooding over 30 yrs
- 0.24%
- Est. flood insurance / yr
- $473 – $860
Fire risk 1/10 · Minimal
- Est. fire insurance / yr
- $691 – $1,283
Heat risk 2/10 · Minimal
- Hot days now (above 91°F)
- 7 days/yr
- Hot days in 30 yrs
- 16 days/yr
Wind risk 1/10 · Minimal
- Chance of severe wind over 30 yrs
- —
Air-quality risk 1/10 · Minimal
- Unhealthy air days now
- 0 days/yr
- Unhealthy air days in 30 yrs
- 0 days/yr
Risk factors via First Street. Map © Google.
Why this score? — see what drove the D grade
The composite is a weighted blend of 9 inputs, each scored 0–100. Each bar is that input's sub-score; the figure is the points it added to the 100-point composite (weight × sub-score).
- Cash flow +9.7/30.0
- Appreciation +7.7/10.0
- ARV discount +7.5/15.0
- Schools +4.4/10.0
- Livability +3.1/5.0
- 1% rule +2.9/10.0
- DSCR +2.7/10.0
- Rent growth +2.5/5.0
- Condition / age +2.5/5.0
$150,000
🖨 Deal sheet 📄 Offer letter ✓ Due diligence
Listing remarks MLS
You'll be happy to call this one home! Don't miss out. One of a kind situated on 2.6 acres. Completely remodeled farmhouse (2003) with open floor plan and large rooms done in neutral colors. Garage and roof less than 4 years old. 32 ft x 40 ft barn for the hobbiest. All appliances and swingset included. Water is a 17 ft deep spring. Located on a public, short, dead end road in the Fillmore SchoolDistrict and close to Houghton. Added attraction - Dynamite view all year round. Very easy to show. Watch for WNY Metro Zientek pointers signs.
Key facts
- Newer roof
- Plenty of privacy
- Quiet dead-end road
Tags
Property features AI
Exterior
- Parking: Attached 2-car garage
- Utilities: Septic tank; Spring water source; Electric power (implied)
- Home design: 2-story house; Existing condition; Vinyl siding
- Construction: Stone foundation; Vinyl siding exterior
- Exterior features: Gravel driveway; Agricultural lot; Irregular lot dimensions 285 x 462
Interior
- Kitchen: Dishwasher; Electric oven; Electric range; Freezer; Refrigerator; Propane water heater
- Flooring: Laminate; Vinyl; Varied flooring
- Bathrooms: 1 full bathroom (main level)
- Heating & cooling: Wood heating; Window unit cooling
- Interior features: Dining area; Separate/formal living room; Home office; Walk-out basement access
Neighborhood map
What this means for you Summary
Snapshot
- This is a 3-bed/1.0-bath single-family listed at $150k.
Deal economics
- At list price, monthly cash flow is $-98 ($-1k/yr) — negative.
- To cash-flow at today's rent, offer at most $136k (9.5% below list).
- To meet the 1% rule (rent ≥ 1% of price), the offer needs to be $119k (20.8% below list).
- Recommended offer: $119k (20.8% below list) — sets the bar for 1% rule.
Location & tenants
- Location reads 62/100 on livability (#868 in NY) — a middle-class / working-renter tenant base. Strengths: cost of living A+, housing A+, schools A-; Watch: employment D+, crime F, amenities F.
- Fillmore Central School District (rural): math 52% / reading 53% proficiency, ranked #359 of 590 in NY (top 61%) — acceptable for families but not a draw, mixed tenant base, ~2y average lease.
- Market conditions: 24 active listings in the ZIP; 87 units permitted in Allegany County in 2024 (0 in 5+ unit buildings).
Forward outlook
- In year one you build about $9k of equity ($1k loan paydown + $8k appreciation (5.4% local appreciation)).
- Allegany County population projected at -26% by 2050 — secular population decline; favor cash flow + early exit over multi-decade hold.
- By year 4, paydown + projected appreciation supports a ~$31k cash-out refi (75% LTV) — recoverable capital for the next deal without selling this one.
Negotiation context
- It's been on market 19 days — a 2% lower offer ($148k) is reasonable based on typical stale-listing flexibility.
- 2 sale attempts since 22y ago with the ask held roughly flat each time — persistent listings suggest the price (not the market) is what's stuck; bring a comps-based counter.
- Current owner paid $84k; list at $150k implies a 79% gain — meaningful room to come down on a strong offer.
Risks & watch-outs
- Watch-outs: built in 1910 — expect roof / HVAC / electrical / plumbing capex.
Questions for the listing agent
- What do current leases actually rent for vs. the listed asking? Can we see a recent rent roll and the last 12 months of T-12 income?
- Built in 1910 — when were the roof, HVAC, electrical panel, plumbing, and water heater last replaced?
- Is there a deadline driving the sale (1031 exchange, divorce, estate, relocation)? That informs how much negotiation room exists.
- Schools are A-rated — typically a magnet for longer-tenancy family renters. What's the average tenant stay here, and is there a school-zone premium baked into asking?
- Crime grade is F in this area — have there been break-ins, vandalism, or insurance claims at this property in the last 3 years? What carrier currently insures it and at what premium?
- The area grade is low — what's the realistic commute time and amenity access for the typical tenant pool here? Any planned neighborhood developments (good or bad) we should know about?
- What's the average days-on-market for RENTAL listings here right now (not sales)? A rising rental-DOM trend means longer vacancies and softer asking-rent achievability than the comps imply.
- What's the recent tenant-quality profile in this submarket — average credit score on applications, eviction rate, late-payment / NSF rate, and stable-employment percentage? A property-management company in the area should have these aggregated.
- How much new for-sale + rental construction is in the pipeline within 1–3 miles? Heavy new supply typically softens prices + rents 12–24 months out; constrained supply supports both.
Investment metrics
- 1% rule
- 0.79% ✗
- Cap rate
- 5.51%
- Cash-on-cash
- -2.81%
- DSCR
- 0.87
- GRM
- 10.5
CMA / ARV
No comps found within radius.
Projected returns pro-forma
5.4% appreciation · 3.0% rent growth · sell at horizon
- IRR
- 11.6%
- Equity multiple
- 1.76×
- Total profit
- $31,802
- Equity at exit
- $88,706
- IRR
- 12.6%
- Equity multiple
- 3.38×
- Total profit
- $100,072
- Equity at exit
- $156,248
Cash invested: $42,000 (down + closing). Projections, not guarantees.
Landlord ↔ Tenant lean methodology
- Overall (STATE)
- 15 Strongly Tenant-Friendly
- State New York
- 15 Strongly Tenant-Friendly · D+10
- County
- — inherits STATE
- City
- — inherits STATE
ZIP-level market 14735
- Home prices YoY
- 1.9%
- Active inventory
- 24
- Price-to-rent
- 10.5×
Monthly cashflow live
- Estimated rent
- $1,188 medium interval (Pro) →
- Mortgage (P&I)
- −$787
- Tax est. 1.5%
- −$188 /mo · $2,250/yr
- Insurance
- −$62
- HOA
- −$0
- Vacancy / Maint / Mgmt
- −$249
- Net cashflow
- $-98
Break-even live
UW: 25.0% down · 7.5% · 30yr · 1.5% tax · 5.0% vac · 8.0% maint · 8.0% mgmt
Financing live
Cash to close
- Down payment
- $37,500
- Closing costs
- $4,500
- Reserves months
- —
- Total cash needed
- —
Loan-product check · same deal, 3 products live
Conventional
25% down · 7.5% · 30yr
- Down + closing
- —
- Monthly P&I
- —
- Monthly cashflow
- —
- DSCR
- —
- Eligible?
- —
Personal DTI + credit; lowest rate.
DSCR
20% down · 8.5% · 30yr
- Down + closing
- —
- Monthly P&I
- —
- Monthly cashflow
- —
- DSCR
- —
- Eligible?
- —
No personal income docs; deal must DSCR.
Hard money
10% down · 12.0% · 12mo
- Down + closing
- —
- Monthly P&I
- —
- Monthly cashflow
- —
- DSCR
- —
- Eligible?
- —
Short-term bridge; refi at stabilization.
Listing history 12 events
-
2026-06-12statusdays on market $150,000 Pending 19 DOM
-
2026-06-09days on market $150,000 Active 18 DOM
-
2026-06-08days on market $150,000 Active 17 DOM
-
2026-06-07days on market $150,000 Active 16 DOM
-
2026-06-05days on market $150,000 Active 14 DOM
-
2026-06-04days on market $150,000 Active 12 DOM
-
2026-06-02days on market $150,000 Active 11 DOM
-
2026-06-01days on market $150,000 Active 10 DOM
-
2026-05-31days on market $150,000 Active 9 DOM
-
2026-05-22$150,000 Active
-
2004-09-02soldstatus $84,000 542-char remark
Show marketing remark (542 chars)
You'll be happy to call this one home! Don't miss out. One of a kind situated on 2.6 acres. Completely remodeled farmhouse (2003) with open floor plan and large rooms done in neutral colors. Garage and roof less than 4 years old. 32 ft x 40 ft barn for the hobbiest. All appliances and swingset included. Water is a 17 ft deep spring. Located on a public, short, dead end road in the Fillmore SchoolDistrict and close to Houghton. Added attraction - Dynamite view all year round. Very easy to show. Watch for WNY Metro Zientek pointers signs.
-
2004-05-04$88,500 542-char remark
Show marketing remark (542 chars)
You'll be happy to call this one home! Don't miss out. One of a kind situated on 2.6 acres. Completely remodeled farmhouse (2003) with open floor plan and large rooms done in neutral colors. Garage and roof less than 4 years old. 32 ft x 40 ft barn for the hobbiest. All appliances and swingset included. Water is a 17 ft deep spring. Located on a public, short, dead end road in the Fillmore SchoolDistrict and close to Houghton. Added attraction - Dynamite view all year round. Very easy to show. Watch for WNY Metro Zientek pointers signs.
ⓘ Source: listings_history table (triggers on properties + properties_extension) + one-shot
backfill from property_details.listing_events for pre-trigger history.
Climate risk First Street
- Flood 4/10 Moderate FEMA zone X · 24% chance over 30 yrs
- Wildfire 1/10 Low
- Heat 2/10 Low 7 d/yr ≥91°F today · 16 d/yr by 30 yrs out
- Wind 1/10 Low
- Air quality 1/10 Low 0 unhealthy d/yr today · 0 by 30 yrs out
Nearby sold comps map
Loading sold comps map…
Walkable amenities ~0.75 mi
Loading nearby amenities…
Taxation est. · year 1
- Rental income
- $14,251
- − Mortgage interest
- −$8,402
- − Property taxes
- −$2,250
- − Insurance
- −$750
- − Repairs & maintenance
- −$1,140
- − Management
- −$1,140
- − Depreciation
- −$4,364
- Taxable loss
- −$3,795
- Est. tax savings @ 24.0%
- +$911
- After-tax cash flow
- $-270/yr
For passive investors: Depreciation is non-cash, so a rental often shows a tax loss while cash-flowing — sheltering income. Rental losses are passive: they offset passive income freely, and up to $25,000/yr can offset ordinary (W-2) income if you actively participate and your MAGI is under $100k (phasing out to $0 by $150k); unused losses carry forward. On sale, claimed depreciation is recaptured at up to 25%, and gains may owe capital-gains tax (a 1031 exchange can defer both). Figures are a year-1 estimate at your 24.0% rate — not tax advice; consult a CPA.
Schools (NCES district)
- District
- Fillmore Central School District
- NCES district ID
- 3611070
- Math proficiency
- 52% ▼ -12.00%
- Reading proficiency
- 53% ▼ -8.00%
- Median HH income
- $41,114
- Composite
- 44.01/100
- National rank
- #2889
- State rank
- #359 of 590 in NY
Livability — Fillmore
- Score
- 62/100
- State rank
- #868
- US rank
- #16718
Category grades
Schools grade is shown separately in the Schools card above.
Census & demographics
- Population (ZIP)
- 2,609
Population outlook (Allegany County) Hauer SSP2
- Today (2025)
- 45,362 people
- By 2030
- 43,078 · -5.0%
- By 2040
- 38,031 · -16.2%
- By 2050
- 33,634 · -25.9%
- By 2075
- 25,285 · -44.3%
- By 2100
- 18,902 · -58.3%
Race, ethnicity, and origin ACS 2023
- Neighborhood character
- Predominantly White (95%)
- Race & ethnicity
- White 95% Hispanic / Latino 3% Two or more races 1%
- Common ancestry
- Lithuanian 6% Romanian 5% Polish 2%
- Foreign-born
- 1% · Canada, China
- Languages at home
- 91% English-only · German/W. Germanic 7% Spanish 1% Other Indo-European 1%
Political lean MEDSL · Allegany
- 2024 margin
- Solid R (+43.2) · D 28.4% · R 71.6%
- 2008→2024 swing
- -21.5pp toward R · 2008: -21.7pp · 2024: -43.2pp
- All cycles
- 2024: R+43.2 2020: R+38.9 2016: R+42.3 2012: R+25.3 2008: R+21.7
Not yet ingested
- Civics
- —
Market trends
- HPI YoY
- ▲ 5.40%
- Current HPI
- 289.3268
- Rent YoY
- —
- Metro
- —
- State GDP YoY
- ▲ 2.60%
- F500 in state
- 92
Industry mix (Fortune 500 HQ in NY)
| Industry | F500 HQs | Revenue |
|---|---|---|
| Financial Services | 10 | $950B |
|
||
| Consumer Goods | 9 | $162B |
|
||
| Insurance | 4 | $225B |
|
||
| Telecommunications | 2 | $144B |
|
||
| Pharmaceuticals | 2 | $112B |
|
||
| Media / Entertainment | 2 | $69B |
|
||
Price history
+69.5% since first listed3 events — show timeline
- 2026-05-22 Listed $150,000 WNYREIS
- 2004-09-02 Sold (MLS) $84,000 WNYREIS
- 2004-05-04 Listed $88,500 WNYREIS
Cash-flow waterfall
monthlySold comps — $/sqft
last 12 mo · ≤1 miLoading sold comps…