 🏷️ Likely Rental
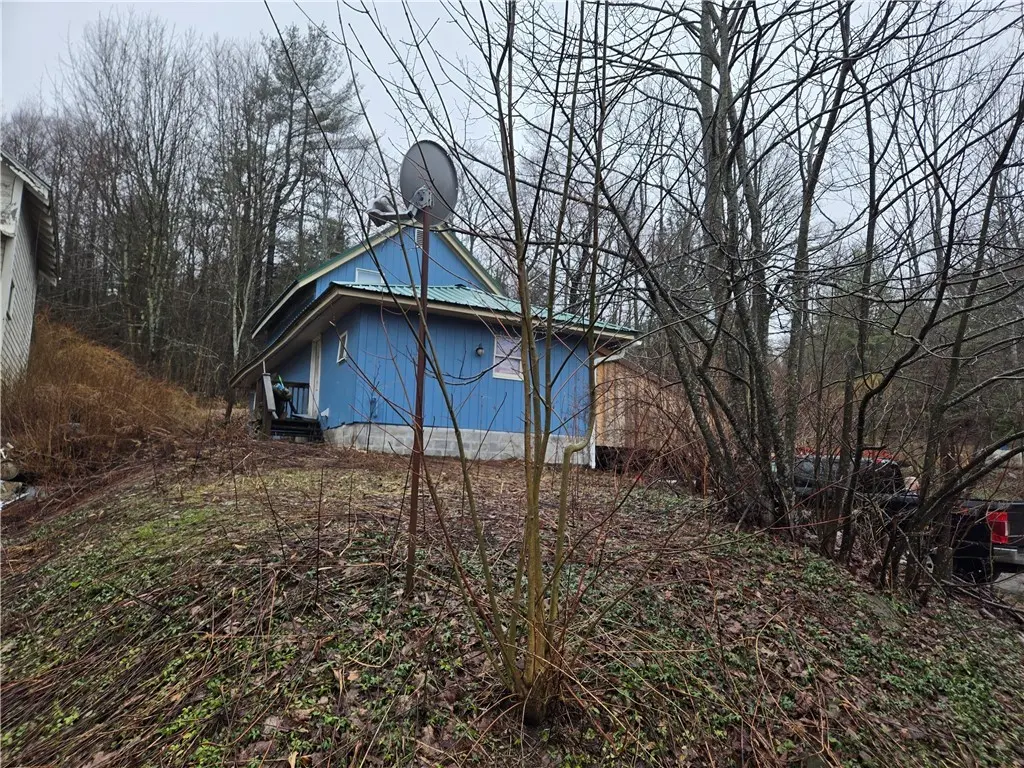
443 County Road 31 · Sparrow Bush, NY
Flood risk No data
- FEMA flood zone
- —
- Chance of flooding over 30 yrs
- —
- Est. flood insurance / yr
- —
Fire risk No data
- Est. fire insurance / yr
- —
Heat risk No data
- Hot days now (above threshold)
- —
- Hot days in 30 yrs
- —
Wind risk No data
- Chance of severe wind over 30 yrs
- —
Air-quality risk No data
- Unhealthy air days now
- —
- Unhealthy air days in 30 yrs
- —
Risk factors via First Street. Map © Google.
Why this score? — see what drove the B- grade
The composite is a weighted blend of 9 inputs, each scored 0–100. Each bar is that input's sub-score; the figure is the points it added to the 100-point composite (weight × sub-score).
- Cash flow +25.0/30.0
- Appreciation +9.6/10.0
- DSCR +8.1/10.0
- ARV discount +7.5/15.0
- 1% rule +6.5/10.0
- Schools +3.6/10.0
- Rent growth +2.5/5.0
- Livability +2.5/5.0
- Condition / age +2.2/5.0
$100,000
🖨 Deal sheet 📄 Offer letter ✓ Due diligence
Listing remarks MLS
Dwelling was a complete remodel several years ago; it is tenant occupied and needs repairs to coverings. Roof, siding and windows have been updated. 1st floor bedroom with private bath; another main bath on the 1st floor. Attached carport with access to the full basement. Appliances are the tenants and do not convey- including washer/dryer.
Key facts
- Complete remodel
- Attached carport
- Siding updates
Tags
Neighborhood map
What this means for you Summary
Snapshot
- This is a 3-bed/2.0-bath single-family listed at $100k. Condition is rated fair.
Deal economics
- At list price, monthly cash flow is $217 ($3k/yr) — positive.
- The deal already cash-flows at list — no discount required.
- Meets the 1% rule at list price ($1k rent vs $100k).
- Recommended offer: $97k (3.0% below list) — sets the bar for market timing.
- Cap rate 8.9% vs local median 2.5% in Sparrow Bush — top-decile yield for the area; either an underpriced asset or a hidden risk that comps aren't pricing in. Stress-test before assuming the spread holds.
Location & tenants
- Location reads: area grade B — affects rentability + tenant quality, not the cash-flow math above.
- Eldred Central School District (rural): math 33% / reading 50% proficiency, ranked #495 of 590 in NY (top 84%) — families likely to look elsewhere, expect single-tenant / working-renter base with shorter leases.
- Market conditions: 14 active listings in the ZIP; 739 units permitted in Sullivan County in 2024 (5 in 5+ unit buildings).
Forward outlook
- In year one you build about $10k of equity ($691 loan paydown + $9k appreciation (9.3% local appreciation)).
- Sullivan County population projected at -24% by 2050 — secular population decline; favor cash flow + early exit over multi-decade hold.
- At projected returns (9.3% appreciation + 3.0% rent growth), your $28k cash investment doubles in ~3 years — after that, you're playing with house money.
- By year 4, paydown + projected appreciation supports a ~$35k cash-out refi (75% LTV) — recoverable capital for the next deal without selling this one.
Negotiation context
- It's been on market 58 days — a 3% lower offer ($97k) is reasonable based on typical stale-listing flexibility.
Risks & watch-outs
- Watch-outs: built in 1950 — expect roof / HVAC / electrical / plumbing capex.
Questions for the listing agent
- It's been on market 58 days. Have you received any prior offers? Is the seller open to a 3% concession, seller financing, or rate buy-down credit?
- Have any recent inspections been done? Can we get a copy of the seller's disclosures and any deferred-maintenance estimates?
- Built in 1950 — when were the roof, HVAC, electrical panel, plumbing, and water heater last replaced?
- Is there a deadline driving the sale (1031 exchange, divorce, estate, relocation)? That informs how much negotiation room exists.
- What's the average days-on-market for RENTAL listings here right now (not sales)? A rising rental-DOM trend means longer vacancies and softer asking-rent achievability than the comps imply.
- What's the recent tenant-quality profile in this submarket — average credit score on applications, eviction rate, late-payment / NSF rate, and stable-employment percentage? A property-management company in the area should have these aggregated.
- How much new for-sale + rental construction is in the pipeline within 1–3 miles? Heavy new supply typically softens prices + rents 12–24 months out; constrained supply supports both.
Investment metrics
- 1% rule
- 1.15% ✓
- Cap rate
- 8.89%
- Cash-on-cash
- 9.28%
- DSCR
- 1.41
- GRM
- 7.3
CMA / ARV
- ARV (median comp)
- $343,086
- List price
- $100,000
- Delta
- -70.85%
- Verdict
- UNDERPRICED
- Comps
- 18 within 2.0 mi
Projected returns pro-forma
9.29% appreciation · 3.0% rent growth · sell at horizon
- IRR
- 29.7%
- Equity multiple
- 3.27×
- Total profit
- $63,434
- Equity at exit
- $84,934
- IRR
- 26.0%
- Equity multiple
- 7.25×
- Total profit
- $174,898
- Equity at exit
- $177,943
Cash invested: $28,000 (down + closing). Projections, not guarantees.
Landlord ↔ Tenant lean methodology
- Overall (STATE)
- 15 Strongly Tenant-Friendly
- State New York
- 15 Strongly Tenant-Friendly · D+10
- County
- — inherits STATE
- City
- — inherits STATE
ZIP-level market 13843
- Home prices YoY
- 3.2%
- Active inventory
- 14
- Price-to-rent
- 7.3×
Monthly cashflow live
- Estimated rent
- $1,149 medium interval (Pro) →
- Mortgage (P&I)
- −$524
- Tax est. 1.5%
- −$125 /mo · $1,500/yr
- Insurance
- −$42
- HOA
- −$0
- Vacancy / Maint / Mgmt
- −$241
- Net cashflow
- $217
Break-even live
UW: 25.0% down · 7.5% · 30yr · 1.5% tax · 5.0% vac · 8.0% maint · 8.0% mgmt
Financing live
Cash to close
- Down payment
- $25,000
- Closing costs
- $3,000
- Reserves months
- —
- Total cash needed
- —
Loan-product check · same deal, 3 products live
Conventional
25% down · 7.5% · 30yr
- Down + closing
- —
- Monthly P&I
- —
- Monthly cashflow
- —
- DSCR
- —
- Eligible?
- —
Personal DTI + credit; lowest rate.
DSCR
20% down · 8.5% · 30yr
- Down + closing
- —
- Monthly P&I
- —
- Monthly cashflow
- —
- DSCR
- —
- Eligible?
- —
No personal income docs; deal must DSCR.
Hard money
10% down · 12.0% · 12mo
- Down + closing
- —
- Monthly P&I
- —
- Monthly cashflow
- —
- DSCR
- —
- Eligible?
- —
Short-term bridge; refi at stabilization.
Listing history 16 events
-
2026-06-18days on market $100,000 Active 58 DOM
-
2026-06-17days on market $100,000 Active 57 DOM
-
2026-06-16days on market $100,000 Active 56 DOM
-
2026-06-15days on market $100,000 Active 55 DOM
-
2026-06-13days on market $100,000 Active 53 DOM
-
2026-06-12remarks 378-char remark
-
2026-06-12days on market $100,000 Active 52 DOM
-
2026-06-09days on market $100,000 Active 49 DOM
-
2026-06-08days on market $100,000 Active 48 DOM
-
2026-06-07days on market $100,000 Active 47 DOM
-
2026-06-07days on market $100,000 Active 46 DOM
-
2026-06-04days on market $100,000 Active 43 DOM
-
2026-06-02days on market $100,000 Active 42 DOM
-
2026-06-01days on market $100,000 Active 41 DOM
-
2026-05-31days on market $100,000 Active 40 DOM
-
2026-04-20$100,000 Active 342-char remark
Show marketing remark (342 chars)
Dwelling was a complete remodel several years ago; it is tenant occupied and needs repairs to coverings. Roof, siding and windows have been updated. 1st floor bedroom with private bath; another main bath on the 1st floor. Attached carport with access to the full basement. Appliances are the tenants and do not convey- including washer/dryer.
ⓘ Source: listings_history table (triggers on properties + properties_extension) + one-shot
backfill from property_details.listing_events for pre-trigger history.
Nearby sold comps map
Loading sold comps map…
Walkable amenities ~0.75 mi
Loading nearby amenities…
Taxation est. · year 1
- Rental income
- $13,788
- − Mortgage interest
- −$5,602
- − Property taxes
- −$1,500
- − Insurance
- −$500
- − Repairs & maintenance
- −$1,103
- − Management
- −$1,103
- − Depreciation
- −$2,909
- Taxable income
- $1,071
- Est. tax owed @ 24.0%
- −$257
- After-tax cash flow
- $2,343/yr
For passive investors: Depreciation is non-cash, so a rental often shows a tax loss while cash-flowing — sheltering income. Rental losses are passive: they offset passive income freely, and up to $25,000/yr can offset ordinary (W-2) income if you actively participate and your MAGI is under $100k (phasing out to $0 by $150k); unused losses carry forward. On sale, claimed depreciation is recaptured at up to 25%, and gains may owe capital-gains tax (a 1031 exchange can defer both). Figures are a year-1 estimate at your 24.0% rate — not tax advice; consult a CPA.
Condition & rehab AI · 2 photos
The home requires extensive repairs and updates to improve its condition and increase its resale and rental value.
Repairs flagged
- Major roof — Signs of water damage and possible leaks
- Major siding — Peeling paint and siding
- Major flooring — Worn and possibly damaged
- Major interior walls — Peeling paint and signs of wear
- Major windows — Old and possibly not functioning properly
- Major HVAC system — Old and possibly not functioning properly
Value-add opportunities
- Both New roof — Fixing the roof will improve the overall condition and appearance of the home
- Both New siding and paint — Updating the exterior will improve the curb appeal and increase the home's value
- Both New flooring — Replacing worn flooring will improve the home's condition and appearance
- Both New interior walls and paint — Repainting and updating the interior walls will improve the home's condition and appearance
- Both New windows — Replacing old windows will improve the home's condition and appearance and possibly increase energy efficiency
- Both New HVAC system — Upgrading the HVAC system will improve the home's comfort and possibly increase energy efficiency
Renovation cost estimate screening
| Repair item | Severity | Est. cost |
|---|---|---|
| roof · Signs of water damage and possible leaks | Major | $15,000–50,000 |
| siding · Peeling paint and siding | Major | $15,000–50,000 |
| flooring · Worn and possibly damaged | Major | $15,000–50,000 |
| interior walls · Peeling paint and signs of wear | Major | $15,000–50,000 |
| windows · Old and possibly not functioning properly | Major | $15,000–50,000 |
| HVAC system · Old and possibly not functioning properly | Major | $15,000–50,000 |
| Total estimated repair cost · 6 items | $90,000–300,000 |
Value-add ROI direction
- Both New roof — Fixing the roof will improve the overall condition and appearance of the home ↑
- Both New siding and paint — Updating the exterior will improve the curb appeal and increase the home's value ↑
- Both New flooring — Replacing worn flooring will improve the home's condition and appearance ↑
- Both New interior walls and paint — Repainting and updating the interior walls will improve the home's condition and appearance ↑
- Both New windows — Replacing old windows will improve the home's condition and appearance and possibly increase energy efficiency ↑
- Both New HVAC system — Upgrading the HVAC system will improve the home's comfort and possibly increase energy efficiency ↑
ⓘ Cost ranges are severity-bucket heuristics (US national rule-of-thumb). Get contractor quotes + a written scope before underwriting a rehab budget.
Schools (NCES district)
- District
- Eldred Central School District
- NCES district ID
- 3610410
- Math proficiency
- 33% ▼ -15.00%
- Reading proficiency
- 50% ▲ 11.00%
- Median HH income
- $52,775
- Composite
- 35.94/100
- National rank
- #4800
- State rank
- #495 of 590 in NY
Livability — Sparrow Bush
No livability data for this city. (Only ~50 U.S. cities are tracked.)
Census & demographics
- Population (ZIP)
- 2,014
Population outlook (Sullivan County) Hauer SSP2
- Today (2025)
- 68,974 people
- By 2030
- 65,609 · -4.9%
- By 2040
- 58,878 · -14.6%
- By 2050
- 52,500 · -23.9%
- By 2075
- 39,941 · -42.1%
- By 2100
- 28,880 · -58.1%
Race, ethnicity, and origin ACS 2023
- Neighborhood character
- Predominantly White (94%)
- Race & ethnicity
- White 94% Two or more races 4% Hispanic / Latino 2%
- Common ancestry
- Lithuanian 8% Iranian 3% Romanian 3%
- Foreign-born
- 2%
- Languages at home
- 97% English-only · Spanish 2% German/W. Germanic 1%
Political lean MEDSL · Sullivan
- 2024 margin
- R (+16.7) · D 41.6% · R 58.4%
- 2008→2024 swing
- -26.2pp toward R · 2008: 9.5pp · 2024: -16.7pp
- All cycles
- 2024: R+16.7 2020: R+9.2 2016: R+13.7 2012: D+10.4 2008: D+9.5
Not yet ingested
- Civics
- —
Market trends
- HPI YoY
- ▲ 9.29%
- Current HPI
- 295.6361
- Rent YoY
- —
- Metro
- —
- State GDP YoY
- ▲ 2.60%
- F500 in state
- 92
Industry mix (Fortune 500 HQ in NY)
| Industry | F500 HQs | Revenue |
|---|---|---|
| Financial Services | 10 | $950B |
|
||
| Consumer Goods | 9 | $162B |
|
||
| Insurance | 4 | $225B |
|
||
| Telecommunications | 2 | $144B |
|
||
| Pharmaceuticals | 2 | $112B |
|
||
| Media / Entertainment | 2 | $69B |
|
||
Price history
1 event — show timeline
- 2026-04-20 Listed $100,000 UNYREIS
Cash-flow waterfall
monthlySold comps — $/sqft
last 12 mo · ≤1 miLoading sold comps…