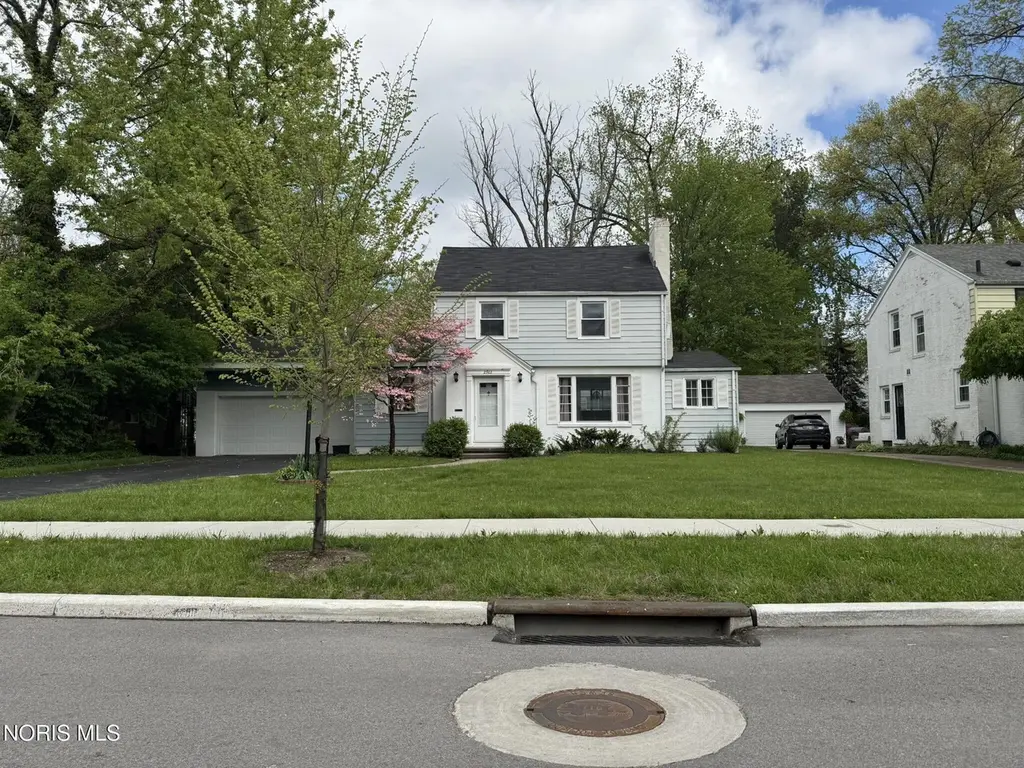
2502 Bexford Pl · Ottawa Hills, OH
Flood risk 1/10 · Minimal
- FEMA flood zone
- X (unshaded)
- Chance of flooding over 30 yrs
- 0.0%
- Est. flood insurance / yr
- $507 – $1,088
Fire risk 1/10 · Minimal
- Est. fire insurance / yr
- $713 – $1,323
Heat risk 3/10 · Minor
- Hot days now (above 100°F)
- 7 days/yr
- Hot days in 30 yrs
- 16 days/yr
Wind risk 2/10 · Minimal
- Chance of severe wind over 30 yrs
- —
Air-quality risk 2/10 · Minimal
- Unhealthy air days now
- 1 days/yr
- Unhealthy air days in 30 yrs
- 3 days/yr
Risk factors via First Street. Map © Google.
Why this score? — see what drove the C- grade
The composite is a weighted blend of 9 inputs, each scored 0–100. Each bar is that input's sub-score; the figure is the points it added to the 100-point composite (weight × sub-score).
- ARV discount +15.0/15.0
- Cash flow +10.7/30.0
- Schools +7.9/10.0
- 1% rule +5.1/10.0
- Livability +4.4/5.0
- DSCR +3.1/10.0
- Rent growth +3.1/5.0
- Condition / age +2.5/5.0
- Appreciation +0.0/10.0
$200,000
🖨 Deal sheet 📄 Offer letter ✓ Due diligence
Listing remarks
Investor's opportunity in Ottawa Hills. Cash buyers, only. Property is being sold as-is and needs renovations—perfect for investors, flippers, or buyers looking to build equity. Priced to reflect condition and offers exceptional upside for the space provided. Ideally situated near both the high school and elementary, this home offers a prime location and great bones. Features include 2.1 baths, main-level primary with en suite, main-floor laundry, and some hardwood floors throughout. Spacious layout and large yard with mature trees.
Key facts
- Main floor laundry
- Large yard
- Prime location
Tags
Property features AI
Finance
- Other: Property listed as residential single-family residence; Lot approximately 0.29 acre; Below-grade finished area present
Exterior
- Parking: Attached garage and driveway; Asphalt parking surface; Approximately 2.5 garage spaces
- Utilities: Electricity connected (circuit breakers); Natural gas connected; Public water; Sanitary sewer connected
- Home design: Single-family house; Two levels; No attached units or common walls
- Construction: Aluminum siding; Block foundation; Built (year per public records)
- Exterior features: Shingle roof
Interior
- Kitchen: Dishwasher; Microwave
- Bedrooms: Bedroom 2 (Upper); Bedroom 3 (Upper); Bedroom 4 (Upper)
- Flooring: Hardwood; Tile; Other
- Bathrooms: 2 full bathrooms and 1 half bathroom
- Heating & cooling: Forced air heating (natural gas); Mini-split cooling
- Interior features: Built-in features; Partially finished basement; Wood-burning fireplace in the living room; Ten total rooms
- Laundry & utility: Main level laundry; Washer; Dryer; Water heater
Neighborhood map
What this means for you Summary
Snapshot
- This is a 4-bed/2.5-bath single-family listed at $200k.
Deal economics
- At list price, monthly cash flow is $-97 ($-1k/yr) — negative.
- To cash-flow at today's rent, offer at most $183k (8.5% below list).
- Meets the 1% rule at list price ($2k rent vs $200k).
- Recommended offer: $183k (8.5% below list) — sets the bar for cash-flow.
- Cap rate 5.7% vs local median 1.6% in Ottawa Hills — top-decile yield for the area; either an underpriced asset or a hidden risk that comps aren't pricing in. Stress-test before assuming the spread holds.
Location & tenants
- Location reads 88/100 on livability (#21 in OH, #197 nationally) — a professional / high-income tenant draw. Strengths: crime A+, employment A+, housing A+; Watch: commute D+, amenities F.
- Ottawa Hills Local (suburban): math 82% / reading 91% proficiency, ranked #5 of 656 in OH (top 1%) — strong family-tenant draw, lease renewals of 3-5y typical; only 11% free/reduced lunch — higher-income household profile.
- Zoned schools: Ottawa Hills Elementary School (math 84% / reading 90%, grade A+, #44 of 1,584 statewide, top 3%, 560 students, 0% FRL); Ottawa Hills High School (math 79% / reading 91%, grade A, #10 of 781 statewide, top 1%, 517 students, 0% FRL).
- Market conditions: Rents rising (+2.3%/yr); 93 active listings in the ZIP; 3 comparable units currently listed for rent nearby; rentals lingering (median 44d on market — plan ~5-8 weeks vacancy on turnover, expect pricing pressure); 67% of comp listings sitting > 30 days — soft ceiling on asking rent; 415 units permitted in Lucas County in 2024 (122 in 5+ unit buildings).
- This rent runs 36% of the median local income ($67k/yr) — at the standard rent-burdened threshold; future hikes will face affordability resistance.
Forward outlook
- Local home prices are declining (-3.0%/yr); year-one equity from $1k of loan paydown is wiped out by about $6k of value loss. Plan a longer hold.
- Lucas County population projected at -16% by 2050 — secular population decline; favor cash flow + early exit over multi-decade hold.
Negotiation context
- Only 6 days on market — expect competitive offers; lowballing is unlikely to land.
Risks & watch-outs
- Watch-outs: property tax is 3.4% of price; built in 1946 — expect roof / HVAC / electrical / plumbing capex.
Questions for the listing agent
- What do current leases actually rent for vs. the listed asking? Can we see a recent rent roll and the last 12 months of T-12 income?
- Built in 1946 — when were the roof, HVAC, electrical panel, plumbing, and water heater last replaced?
- Property tax is high relative to price — has the assessment been appealed recently, and will the sale trigger a re-assessment?
- Is there a deadline driving the sale (1031 exchange, divorce, estate, relocation)? That informs how much negotiation room exists.
- Schools are A-rated — typically a magnet for longer-tenancy family renters. What's the average tenant stay here, and is there a school-zone premium baked into asking?
- What's the average days-on-market for RENTAL listings here right now (not sales)? A rising rental-DOM trend means longer vacancies and softer asking-rent achievability than the comps imply.
- What's the recent tenant-quality profile in this submarket — average credit score on applications, eviction rate, late-payment / NSF rate, and stable-employment percentage? A property-management company in the area should have these aggregated.
- How much new for-sale + rental construction is in the pipeline within 1–3 miles? Heavy new supply typically softens prices + rents 12–24 months out; constrained supply supports both.
Investment metrics
- 1% rule
- 1.01% ✓
- Cap rate
- 5.71%
- Cash-on-cash
- -2.07%
- DSCR
- 0.91
- GRM
- 8.2
CMA / ARV
- ARV (median comp)
- $343,939
- List price
- $200,000
- Delta
- -41.85%
- Verdict
- UNDERPRICED
- Comps
- 20 within 1.0 mi
Show comp detail 12 sales within ~0.75 mi
| Address | Dist | Beds/Ba | Sqft | Sold | Price | $/sf | Match |
|---|---|---|---|---|---|---|---|
| 2523 Orchard Rd | 0.32mi | 4/3.0 | 2,228 (-1%) | 1mo | $339,000 | $152 | 81 |
| 4104 Brookside Rd | 0.47mi | 4/2.5 | 2,123 (-5%) | 1mo | $397,000 | $187 | 69 |
| 2445 Orchard Rd | 0.33mi | 4/3.5 | 2,138 (-5%) | 5mo | $361,000 | $169 | 69 |
| 3409 Brantford Rd | 0.40mi | 4/2.5 | 2,438 (+9%) | 1mo | $405,000 | $166 | 66 |
| 3447 Brantford Rd | 0.34mi | 4/2.5 | 1,994 (-11%) | 2mo | $325,000 | $163 | 65 |
| 2647 Pemberton Dr | 0.61mi | 4/3.0 | 2,250 (+0%) | 5mo | $290,000 | $129 | 65 |
| 3324 Darlington Rd | 0.40mi | 4/3.5 | 2,453 (+10%) | 1mo | $359,900 | $147 | 61 |
| 2203 Innisbrook Rd | 0.66mi | 3/2.5 (-1) | 2,310 (+3%) | 2mo | $424,900 | $184 | 57 |
| 3313 Kirkwall Rd | 0.43mi | 3/3.0 (-1) | 2,015 (-10%) | 1mo | $340,000 | $169 | 55 |
| 2222 Talmadge Rd | 0.73mi | 4/2.5 | 2,140 (-4%) | 6mo | $276,000 | $129 | 54 |
| 3024 Hopewell Pl | 0.75mi | 5/4.0 (+1) | 2,312 (+3%) | 2mo | $315,000 | $136 | 47 |
| 2909 Manchester Blvd | 0.45mi | 3/2.0 (-1) | 1,954 (-13%) | 5mo | $285,000 | $146 | 46 |
Match score weights: distance 35% · size 25% · config 20% · recency 20%. Top-matched comps best support the ARV.
Projected returns pro-forma
-3.0% appreciation · 2.29% rent growth · sell at horizon
- IRR
- -20.6%
- Equity multiple
- 0.29×
- Total profit
- $-39,769
- Equity at exit
- $29,821
- IRR
- -15.5%
- Equity multiple
- 0.15×
- Total profit
- $-47,445
- Equity at exit
- $17,292
Cash invested: $56,000 (down + closing). Projections, not guarantees.
Landlord ↔ Tenant lean methodology
- Overall (STATE)
- 73 Landlord-Friendly
- State Ohio
- 73 Landlord-Friendly · R+6
- County
- — inherits STATE
- City
- — inherits STATE
ZIP-level market 43606
- Home prices YoY
- -15.5%
- Rents YoY
- 2.3%
- Active inventory
- 93
- Price-to-rent
- 8.2×
Monthly cashflow live
- Estimated rent
- $2,020 medium interval (Pro) →
- Mortgage (P&I)
- −$1,049
- Tax from tax record
- −$560 /mo · $6,724/yr
- Insurance
- −$83
- HOA
- −$0
- Vacancy / Maint / Mgmt
- −$424
- Net cashflow
- $-97
Break-even live
UW: 25.0% down · 7.5% · 30yr · 1.5% tax · 5.0% vac · 8.0% maint · 8.0% mgmt
Financing live
Cash to close
- Down payment
- $50,000
- Closing costs
- $6,000
- Reserves months
- —
- Total cash needed
- —
Loan-product check · same deal, 3 products live
Conventional
25% down · 7.5% · 30yr
- Down + closing
- —
- Monthly P&I
- —
- Monthly cashflow
- —
- DSCR
- —
- Eligible?
- —
Personal DTI + credit; lowest rate.
DSCR
20% down · 8.5% · 30yr
- Down + closing
- —
- Monthly P&I
- —
- Monthly cashflow
- —
- DSCR
- —
- Eligible?
- —
No personal income docs; deal must DSCR.
Hard money
10% down · 12.0% · 12mo
- Down + closing
- —
- Monthly P&I
- —
- Monthly cashflow
- —
- DSCR
- —
- Eligible?
- —
Short-term bridge; refi at stabilization.
Rent comps 3 comps
| Address | Beds | Baths | Sqft | Rent | $/sqft | DOM | Units | Dist |
|---|---|---|---|---|---|---|---|---|
| 3835 Hillandale Rd Ottawa Hills, OH | 3.0 | 3.0 | 2845 | $2,800 | $0.98 | 23d | 1 | 0.67mi |
| 2645 Drummond Rd Toledo, OH | 5.0 | 2.0 | 2007 | $1,900 | $0.95 | 44d | 1 | 0.86mi |
| 3121 Cheltenham Rd Toledo, OH | 4.0 | 2.0 | 1691 | $1,800 | $1.06 | 44d | 1 | 1.14mi |
Listing history 1 events
-
2026-05-14$200,000 Active 544-char remark
ⓘ Source: listings_history table (triggers on properties + properties_extension) + one-shot
backfill from property_details.listing_events for pre-trigger history.
Tax reassessment forecast OH · Partial reset (capped growth)
- Current annual tax
- $6,724 · $560/mo
- Projected year-2 tax
- $6,724 · $560/mo
- Expected delta
- $0/yr ($0/mo · 0.0%)
ⓘ Screening estimate from a state-policy table — verify with the county assessor before closing.
Climate risk First Street
- Flood 1/10 Low FEMA zone X (unshaded) · 0% chance over 30 yrs
- Wildfire 1/10 Low
- Heat 3/10 Moderate 7 d/yr ≥100°F today · 16 d/yr by 30 yrs out
- Wind 2/10 Low
- Air quality 2/10 Low 1 unhealthy d/yr today · 3 by 30 yrs out
Nearby sold comps map
Loading sold comps map…
Walkable amenities ~0.75 mi
Loading nearby amenities…
Taxation est. · year 1
- Rental income
- $24,243
- − Mortgage interest
- −$11,203
- − Property taxes
- −$6,724
- − Insurance
- −$1,000
- − Repairs & maintenance
- −$1,939
- − Management
- −$1,939
- − Depreciation
- −$5,818
- Taxable loss
- −$4,382
- Est. tax savings @ 24.0%
- +$1,052
- After-tax cash flow
- $-107/yr
For passive investors: Depreciation is non-cash, so a rental often shows a tax loss while cash-flowing — sheltering income. Rental losses are passive: they offset passive income freely, and up to $25,000/yr can offset ordinary (W-2) income if you actively participate and your MAGI is under $100k (phasing out to $0 by $150k); unused losses carry forward. On sale, claimed depreciation is recaptured at up to 25%, and gains may owe capital-gains tax (a 1031 exchange can defer both). Figures are a year-1 estimate at your 24.0% rate — not tax advice; consult a CPA.
Schools (NCES district)
- District
- Ottawa Hills Local
- NCES district ID
- 3904821
- Math proficiency
- 82% ▼ -9.00%
- Reading proficiency
- 91% ▼ -1.00%
- Median HH income
- $109,815
- Composite
- 78.73/100
- National rank
- #70
- State rank
- #5 of 656 in OH
Livability — Ottawa Hills
- Score
- 88/100
- State rank
- #21
- US rank
- #197
Category grades
Schools grade is shown separately in the Schools card above.
Census & demographics
- Census place
- Ottawa Hills, OH
- County
- Lucas County · 380,724 people
- Metro
- Toledo, OH
- Population (ZIP)
- 24,898
- Household income
- $66,917
- Rent vs Own
- Severe rent burden
- 843.0
Population outlook (Lucas County) Hauer SSP2
- Today (2025)
- 420,751 people
- By 2030
- 410,187 · -2.5%
- By 2040
- 384,019 · -8.7%
- By 2050
- 355,125 · -15.6%
- By 2075
- 291,683 · -30.7%
- By 2100
- 233,670 · -44.5%
Race, ethnicity, and origin ACS 2023
- Neighborhood character
- Diverse neighborhood (Simpson 0.57)
- Race & ethnicity
- White 59% Black 29% Two or more races 7% Hispanic / Latino 4% Asian 3%
- Common ancestry
- Romanian 6% Italian 2% Lithuanian 1%
- Foreign-born
- 7% · Canada, China, South Korea
- Languages at home
- 92% English-only · Arabic 2% Other Indo-European 2% Spanish 1%
Political lean MEDSL · Lucas
- 2024 margin
- D (+12.6) · D 55.8% · R 43.2%
- 2008→2024 swing
- -18.9pp toward R · 2008: 31.4pp · 2024: 12.6pp
- All cycles
- 2024: D+12.6 2020: D+16.8 2016: D+17.4 2012: D+30.4 2008: D+31.4
Not yet ingested
- Civics
- —
Market trends
- HPI YoY
- ▼ -41.19%
- Current HPI
- 224.695
- Rent YoY
- ▲ 2.29%
- Metro
- Toledo, OH
- State GDP YoY
- ▲ 1.98%
- F500 in state
- 48
Industry mix (Fortune 500 HQ in OH)
| Industry | F500 HQs | Revenue |
|---|---|---|
| Insurance | 3 | $145B |
|
||
| Industrial Machinery | 3 | $49B |
|
||
| Financial Services | 3 | $24B |
|
||
| Consumer Goods | 2 | $93B |
|
||
| Aerospace / Defense | 2 | $47B |
|
||
| Utilities | 2 | $33B |
|
||
Price history
+0.0% since first listed3 events — show timeline
- 2026-06-05 Sold (MLS) $200,000 NORIS
- 2026-05-20 Pending — NORIS
- 2026-05-14 Listed $200,000 NORIS
Property tax history
+2.1%/yrLatest (2025): $6,724 · +2.5% YoY. Source: county tax records.
Cash-flow waterfall
monthlySold comps — $/sqft
last 12 mo · ≤1 miLoading sold comps…