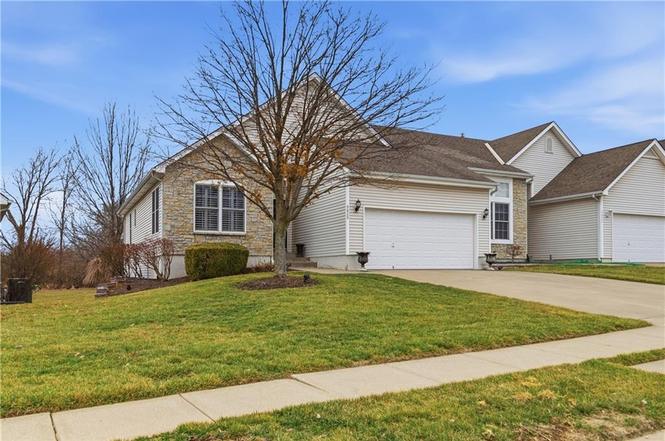
9820 N Smalley Ave · Kansas City, MO
Flood risk 1/10 · Minimal
- FEMA flood zone
- X (unshaded)
- Chance of flooding over 30 yrs
- 0.0%
- Est. flood insurance / yr
- $473 – $860
Fire risk 3/10 · Minor
- Est. fire insurance / yr
- $1,054 – $1,958
Heat risk 4/10 · Minor
- Hot days now (above 106°F)
- 7 days/yr
- Hot days in 30 yrs
- 17 days/yr
Wind risk 2/10 · Minimal
- Chance of severe wind over 30 yrs
- —
Air-quality risk 3/10 · Minor
- Unhealthy air days now
- 3 days/yr
- Unhealthy air days in 30 yrs
- 4 days/yr
Risk factors via First Street. Map © Google.
Why this score? — see what drove the F grade
The composite is a weighted blend of 9 inputs, each scored 0–100. Each bar is that input's sub-score; the figure is the points it added to the 100-point composite (weight × sub-score).
- ARV discount +10.5/15.0
- Cash flow +5.8/30.0
- Rent growth +4.9/5.0
- Schools +4.5/10.0
- Livability +3.9/5.0
- Condition / age +2.5/5.0
- 1% rule +0.6/10.0
- DSCR +0.1/10.0
- Appreciation +0.0/10.0
$390,000
🖨 Deal sheet 📄 Offer letter ✓ Due diligence
Listing remarks MLS
Beautiful 3 bdrm, 3 bath attached patio home w/ 2 gas fireplaces and a finished walkout bsmt backs to greenspace. 2 car garage w/ one side 26 ft. Upgrades include; new HV/AC Nov. '08, humidifier on furnace, custom blinds & shutters, tinted windows, upgraded plumbing in bathrooms. Add $300 per yr to HOA-pool. NEW furnace & AC unit (installed 11/10/08), NEW garage door opener
Key facts
- 3,485 sq ft lot
- 2 garage spots
- Community pool
Neighborhood map
What this means for you Summary
Snapshot
- This is a 2-bed/3.0-bath single-family listed at $390k.
Deal economics
- At list price, monthly cash flow is $-788 ($-9k/yr) — negative.
- To cash-flow at today's rent, offer at most $251k (35.7% below list).
- To meet the 1% rule (rent ≥ 1% of price), the offer needs to be $220k (43.7% below list).
- Recommended offer: $220k (43.7% below list) — sets the bar for 1% rule.
Location & tenants
- Location reads 78/100 on livability (#28 in MO, #2,671 nationally) — a middle-class / working-renter tenant base. Strengths: amenities A+, commute A+, cost of living A+; Watch: crime F.
- Liberty 53 (suburban): math 41% / reading 59% proficiency, ranked #24 of 324 in MO (top 7%) — acceptable for families but not a draw, mixed tenant base, ~2y average lease; only 15% free/reduced lunch — higher-income household profile.
- Zoned schools: Shoal Creek Elem. (math 63% / reading 68%, grade B+, #63 of 1,115 statewide, top 6%, 883 students, 8% FRL); Liberty High (math 33% / reading 75%, grade C-, #82 of 521 statewide, top 16%, 1,997 students, 22% FRL) — zoned schools at 15% FRL track the district average.
- Market conditions: Rents rising fast (+9.5%/yr); 240 active listings in the ZIP; high-income renter base; 341 units permitted in Clay County in 2024 (40 in 5+ unit buildings).
- This rent is only 18% of the median local income ($150k/yr) — well below the 30% rent-burden line; pricing power to push rent on renewal without tenant pushback.
Forward outlook
- Local home prices are declining (-3.0%/yr); year-one equity from $3k of loan paydown is wiped out by about $12k of value loss. Plan a longer hold.
- Clay County population projected at +24% by 2050 — long-run rental-demand tailwind backs the buy-and-hold thesis.
Negotiation context
- It's been on market 18 days — a 2% lower offer ($384k) is reasonable based on typical stale-listing flexibility.
- 3 sale attempts since 23y ago with the ask held roughly flat each time — persistent listings suggest the price (not the market) is what's stuck; bring a comps-based counter.
Questions for the listing agent
- What do current leases actually rent for vs. the listed asking? Can we see a recent rent roll and the last 12 months of T-12 income?
- What does the HOA fee cover, when was the last increase, and are there any pending special assessments or reserve-fund shortfalls?
- Is there a deadline driving the sale (1031 exchange, divorce, estate, relocation)? That informs how much negotiation room exists.
- Crime grade is F in this area — have there been break-ins, vandalism, or insurance claims at this property in the last 3 years? What carrier currently insures it and at what premium?
- The area grade is low — what's the realistic commute time and amenity access for the typical tenant pool here? Any planned neighborhood developments (good or bad) we should know about?
- What's the average days-on-market for RENTAL listings here right now (not sales)? A rising rental-DOM trend means longer vacancies and softer asking-rent achievability than the comps imply.
- What's the recent tenant-quality profile in this submarket — average credit score on applications, eviction rate, late-payment / NSF rate, and stable-employment percentage? A property-management company in the area should have these aggregated.
- How much new for-sale + rental construction is in the pipeline within 1–3 miles? Heavy new supply typically softens prices + rents 12–24 months out; constrained supply supports both.
Investment metrics
- 1% rule
- 0.56% ✗
- Cap rate
- 3.87%
- Cash-on-cash
- -8.66%
- DSCR
- 0.61
- GRM
- 14.8
CMA / ARV
- ARV (on-the-fly)
- $417,648
- Comps found
- 5
Show comp detail 5 sales within ~0.75 mi
| Address | Dist | Beds/Ba | Sqft | Sold | Price | $/sf | Match |
|---|---|---|---|---|---|---|---|
| 8105 NE 98th St | 0.18mi | 3/2.5 (+1) | 1,811 (+14%) | 6mo | $375,000 | $207 | 55 |
| 8051 NE 102nd St | 0.55mi | 3/2.0 (+1) | 1,442 (-9%) | 13mo | $380,000 | $264 | 40 |
| 8505 NE 97th Ter | 0.50mi | 3/2.0 (+1) | 1,349 (-15%) | 7mo | $365,000 | $271 | 38 |
| 10123 N Ditman Ave | 0.71mi | 3/2.5 (+1) | 1,652 (+4%) | 18mo | $370,000 | $224 | 37 |
| 10215 N Oakland Ave | 0.60mi | 3/2.0 (+1) | 1,704 (+8%) | 22mo | $494,997 | $290 | 32 |
Match score weights: distance 35% · size 25% · config 20% · recency 20%. Top-matched comps best support the ARV.
Projected returns pro-forma
-3.0% appreciation · 8.0% rent growth · sell at horizon
- IRR
- -26.8%
- Equity multiple
- 0.07×
- Total profit
- $-101,840
- Equity at exit
- $58,150
- IRR
- -13.3%
- Equity multiple
- 0.08×
- Total profit
- $-100,776
- Equity at exit
- $33,720
Cash invested: $109,200 (down + closing). Projections, not guarantees.
Landlord ↔ Tenant lean methodology
- Overall (STATE)
- 81 Strongly Landlord-Friendly
- State Missouri
- 81 Strongly Landlord-Friendly · R+10
- County
- — inherits STATE
- City
- — inherits STATE
ZIP-level market 64157
- Home prices YoY
- -18.1%
- Rents YoY
- 9.5%
- Active inventory
- 240
- Price-to-rent
- 14.8×
Monthly cashflow live
- Estimated rent
- $2,195 medium interval (Pro) →
- Mortgage (P&I)
- −$2,045
- Tax from tax record
- −$282 /mo · $3,378/yr
- Insurance
- −$162
- HOA
- −$33
- Vacancy / Maint / Mgmt
- −$461
- Net cashflow
- $-788
Break-even live
UW: 25.0% down · 7.5% · 30yr · 1.5% tax · 5.0% vac · 8.0% maint · 8.0% mgmt
Financing live
Cash to close
- Down payment
- $97,500
- Closing costs
- $11,700
- Reserves months
- —
- Total cash needed
- —
Loan-product check · same deal, 3 products live
Conventional
25% down · 7.5% · 30yr
- Down + closing
- —
- Monthly P&I
- —
- Monthly cashflow
- —
- DSCR
- —
- Eligible?
- —
Personal DTI + credit; lowest rate.
DSCR
20% down · 8.5% · 30yr
- Down + closing
- —
- Monthly P&I
- —
- Monthly cashflow
- —
- DSCR
- —
- Eligible?
- —
No personal income docs; deal must DSCR.
Hard money
10% down · 12.0% · 12mo
- Down + closing
- —
- Monthly P&I
- —
- Monthly cashflow
- —
- DSCR
- —
- Eligible?
- —
Short-term bridge; refi at stabilization.
HOA detail
- Monthly dues
- $33 · $396/yr
- Likely covers
- gaspool
Listing history 10 events
-
2026-03-22status Pending
-
2026-03-10historical Active Under Contract
-
2026-03-05$390,000 Active
-
2026-02-10historical $390,000
-
2018-07-09soldstatus
-
2009-07-29soldstatus
-
2009-07-24soldstatus 388-char remark
Show marketing remark (388 chars)
Beautiful 3 bdrm, 3 bath attached patio home w/ 2 gas fireplaces and a finished walkout bsmt backs to greenspace. 2 car garage w/ one side 26 ft. Upgrades include; new HV/AC Nov. '08, humidifier on furnace, custom blinds & shutters, tinted windows, upgraded plumbing in bathrooms. Add $300 per yr to HOA-pool. NEW furnace & AC unit (installed 11/10/08), NEW garage door opener
-
2008-06-16$190,000 388-char remark
Show marketing remark (388 chars)
Beautiful 3 bdrm, 3 bath attached patio home w/ 2 gas fireplaces and a finished walkout bsmt backs to greenspace. 2 car garage w/ one side 26 ft. Upgrades include; new HV/AC Nov. '08, humidifier on furnace, custom blinds & shutters, tinted windows, upgraded plumbing in bathrooms. Add $300 per yr to HOA-pool. NEW furnace & AC unit (installed 11/10/08), NEW garage door opener
-
2004-07-19soldstatus 527-char remark
Show marketing remark (527 chars)
Beautiful 3 bdrm & 2 bdrm attached patio homes w/ 2 ba. Some models w/ bsmts-some w/ out. All homes include generous appliance allowance on GE appliances. Monthly maintenance to include lawn care-snow removal-ext building maintenance & homeowners insurance-(projected monthly fee $130.00)-HOA fee-$250. a yr for pool & walking trail. Agent it's recommended you show models on the projected date for completation, 7-15-03. Current info is available at Brighton Woods Townhomes. Govt financing additional $1200.
-
2003-01-14$176,900 527-char remark
Show marketing remark (527 chars)
Beautiful 3 bdrm & 2 bdrm attached patio homes w/ 2 ba. Some models w/ bsmts-some w/ out. All homes include generous appliance allowance on GE appliances. Monthly maintenance to include lawn care-snow removal-ext building maintenance & homeowners insurance-(projected monthly fee $130.00)-HOA fee-$250. a yr for pool & walking trail. Agent it's recommended you show models on the projected date for completation, 7-15-03. Current info is available at Brighton Woods Townhomes. Govt financing additional $1200.
ⓘ Source: listings_history table (triggers on properties + properties_extension) + one-shot
backfill from property_details.listing_events for pre-trigger history.
Tax reassessment forecast MO · Resets to sale price
- Current annual tax
- $3,378 · $282/mo
- Projected year-2 tax
- $3,783 · $315/mo
- Expected delta
- +$405/yr (+$34/mo · 12.0%)
ⓘ Screening estimate from a state-policy table — verify with the county assessor before closing.
Climate risk First Street
- Flood 1/10 Low FEMA zone X (unshaded) · 0% chance over 30 yrs
- Wildfire 3/10 Moderate
- Heat 4/10 Moderate 7 d/yr ≥106°F today · 17 d/yr by 30 yrs out
- Wind 2/10 Low
- Air quality 3/10 Moderate 3 unhealthy d/yr today · 4 by 30 yrs out
Nearby sold comps map
Loading sold comps map…
Walkable amenities ~0.75 mi
Loading nearby amenities…
Taxation est. · year 1
- Rental income
- $26,346
- − Mortgage interest
- −$21,846
- − Property taxes
- −$3,378
- − Insurance
- −$1,950
- − Repairs & maintenance
- −$2,108
- − Management
- −$2,108
- − HOA
- −$396
- − Depreciation
- −$11,345
- Taxable loss
- −$16,785
- Est. tax savings @ 24.0%
- +$4,028
- After-tax cash flow
- $-5,425/yr
For passive investors: Depreciation is non-cash, so a rental often shows a tax loss while cash-flowing — sheltering income. Rental losses are passive: they offset passive income freely, and up to $25,000/yr can offset ordinary (W-2) income if you actively participate and your MAGI is under $100k (phasing out to $0 by $150k); unused losses carry forward. On sale, claimed depreciation is recaptured at up to 25%, and gains may owe capital-gains tax (a 1031 exchange can defer both). Figures are a year-1 estimate at your 24.0% rate — not tax advice; consult a CPA.
Schools (NCES district)
- District
- Liberty 53
- NCES district ID
- 2918540
- Math proficiency
- 41% ▼ -9.00%
- Reading proficiency
- 59% ▼ -3.00%
- Median HH income
- $78,226
- Composite
- 45.41/100
- National rank
- #2624
- State rank
- #24 of 324 in MO
Livability — Kansas City
- Score
- 78/100
- State rank
- #28
- US rank
- #2671
Category grades
Schools grade is shown separately in the Schools card above.
Census & demographics
- Census place
- Kansas City, MO
- County
- Clay County · 220,651 people
- City population
- 439,467
- Metro
- Kansas City, MO-KS
- Population (ZIP)
- 23,030
- Household income
- $149,526
- Rent vs Own
- Severe rent burden
- 87.0
Population outlook (Clay County) Hauer SSP2
- Today (2025)
- 266,022 people
- By 2030
- 280,057 · +5.3%
- By 2040
- 306,153 · +15.1%
- By 2050
- 328,630 · +23.5%
- By 2075
- 375,182 · +41.0%
- By 2100
- 392,861 · +47.7%
Race, ethnicity, and origin ACS 2023
- Neighborhood character
- Predominantly White (82%)
- Race & ethnicity
- White 82% Asian 7% Two or more races 6% Hispanic / Latino 5% Black 3%
- Common ancestry
- Slovak 3% Italian 2% Lithuanian 2%
- Foreign-born
- 6% · Canada, Vietnam, China
- Languages at home
- 92% English-only · Spanish 3% Other Asian/Pacific 2% Vietnamese 1%
Political lean MEDSL · Clay
- 2024 margin
- Lean R (+5.6) · D 46.4% · R 52.0% · Other 1.6%
- 2008→2024 swing
- -4.9pp toward R · 2008: -0.7pp · 2024: -5.6pp
- All cycles
- 2024: R+5.6 2020: R+4.1 2016: R+11.1 2012: R+8.4 2008: R+0.7
Not yet ingested
- Civics
- —
Market trends
- HPI YoY
- ▼ -43.38%
- Current HPI
- 195.9921
- Rent YoY
- ▲ 9.50%
- Metro
- Kansas City, MO-KS
- State GDP YoY
- ▲ 1.84%
- F500 in state
- 20
Industry mix (Fortune 500 HQ in MO)
| Industry | F500 HQs | Revenue |
|---|---|---|
| Healthcare | 1 | $163B |
|
||
| Insurance | 1 | $21B |
|
||
| Industrial Technology | 1 | $17B |
|
||
| Retail | 1 | $16B |
|
||
| Industrial Distribution | 1 | $10B |
|
||
| Utilities | 1 | $9B |
|
||
Price history
+120.5% since first listed10 events — show timeline
- 2026-03-22 Pending — Heartland MLS as Distributed by MLS Grid
- 2026-03-10 Contingent — Heartland MLS as Distributed by MLS Grid
- 2026-03-05 Listed $390,000 Heartland MLS as Distributed by MLS Grid
- 2026-02-10 Coming Soon $390,000 Heartland MLS as Distributed by MLS Grid
- 2018-07-09 Sold (Public Records) — Public Records
- 2009-07-29 Sold (Public Records) — Public Records
- 2009-07-24 Sold (MLS) — Heartland MLS as Distributed by MLS Grid
- 2008-06-16 Listed $190,000 Heartland MLS as Distributed by MLS Grid
- 2004-07-19 Sold (MLS) — Heartland MLS as Distributed by MLS Grid
- 2003-01-14 Listed $176,900 Heartland MLS as Distributed by MLS Grid
Cash-flow waterfall
monthlySold comps — $/sqft
last 12 mo · ≤1 miLoading sold comps…