 Triplex
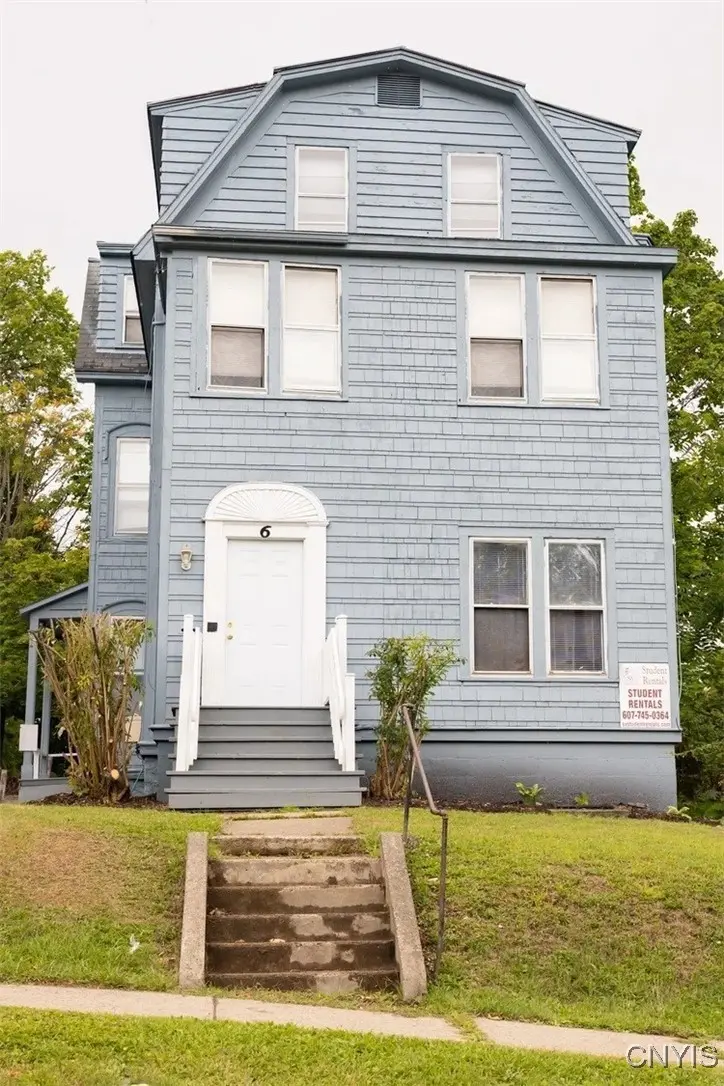
6 Monroe St · Cortland, NY
Flood risk 1/10 · Minimal
- FEMA flood zone
- X (unshaded)
- Chance of flooding over 30 yrs
- 0.0%
- Est. flood insurance / yr
- $473 – $860
Fire risk 3/10 · Minor
- Est. fire insurance / yr
- $691 – $1,283
Heat risk 3/10 · Minor
- Hot days now (above 92°F)
- 8 days/yr
- Hot days in 30 yrs
- 17 days/yr
Wind risk 2/10 · Minimal
- Chance of severe wind over 30 yrs
- 1.0%
Air-quality risk 2/10 · Minimal
- Unhealthy air days now
- 0 days/yr
- Unhealthy air days in 30 yrs
- 1 days/yr
Risk factors via First Street. Map © Google.
Why this score? — see what drove the C grade
The composite is a weighted blend of 9 inputs, each scored 0–100. Each bar is that input's sub-score; the figure is the points it added to the 100-point composite (weight × sub-score).
- Cash flow +22.3/30.0
- ARV discount +7.5/15.0
- DSCR +7.1/10.0
- 1% rule +6.4/10.0
- Rent growth +4.6/5.0
- Schools +4.3/10.0
- Livability +3.9/5.0
- Condition / age +2.5/5.0
- Appreciation +0.0/10.0
$555,000
🖨 Deal sheet 📄 Offer letter ✓ Due diligence
Multi-family units
County records classify this as Multi-Family (5+ Unit). Listing-text estimate: 3 units. estimate disagrees with records
5+ unit building — per-unit beds/baths from public records are typically unavailable; the breakdown below (if shown) is an estimate from the listing text.
Listing remarks MLS
3,974 square foot, 3-unit, 15 bedrooms total house (5 bedrooms per unit) currently used for student housing. Within walking distance of both SUNY Cortland and the Cortland City central business district. Rent is $3,600.00 per bedroom, per semester. Owner pays for electric and gas utilities. Large parking lot. The owner is a licensed real estate agent. Note: The garage shown at the rear of the property in aerial photographs has been removed. Also, the Town / County tax shown below includes the City tax.
Key facts
- Large parking lot
- 9,434 sq ft lot
- 2 parking spots
Tags
Neighborhood map
What this means for you Summary
Snapshot
- This is a 3 × 5-bed/1.0-bath units multifamily listed at $555k.
Deal economics
- At list price, monthly cash flow is $911 ($11k/yr) — positive. Per door: $304/mo.
- The deal already cash-flows at list — no discount required.
- Meets the 1% rule at list price ($6k rent vs $555k).
- Recommended offer: $488k (12.0% below list) — sets the bar for market timing.
- Cap rate 8.3% vs local median 6.2% in Cortland — top-decile yield for the area; either an underpriced asset or a hidden risk that comps aren't pricing in. Stress-test before assuming the spread holds.
Location & tenants
- Location reads 77/100 on livability (#201 in NY, #3,105 nationally) — a middle-class / working-renter tenant base. Strengths: cost of living A+, housing A+, health & safety A+; Watch: crime C-, schools D+, employment D.
- Cortland City School District (town): math 49% / reading 54% proficiency, ranked #368 of 590 in NY (top 62%) — acceptable for families but not a draw, mixed tenant base, ~2y average lease.
- Market conditions: Rents rising fast (+8.4%/yr); 141 active listings in the ZIP; 45 units permitted in Cortland County in 2024 (12 in 5+ unit buildings).
- At $6,302/mo this rent would consume 108% of the median local household income ($70k/yr) (locally 1488% of renters already pay >50% of income on rent) — very limited rent-growth headroom before tenants either downsize or default.
Forward outlook
- Local home prices are declining (-3.0%/yr); year-one equity from $4k of loan paydown is wiped out by about $17k of value loss. Plan a longer hold.
- Cortland County population projected at -15% by 2050 — secular population decline; favor cash flow + early exit over multi-decade hold.
- At projected returns (-3.0% appreciation + 8.0% rent growth), your $155k cash investment doubles in ~9 years — after that, you're playing with house money.
Negotiation context
- It's been on market 156 days — a 12% lower offer ($488k) is reasonable based on typical stale-listing flexibility.
- 2 sale attempts since 15y ago with the ask held roughly flat each time — persistent listings suggest the price (not the market) is what's stuck; bring a comps-based counter.
- Current owner paid $405k; 37% above their basis — modest negotiation headroom, anchor on the comps not their cost.
Questions for the listing agent
- It's been on market 156 days. Have you received any prior offers? Is the seller open to a 12% concession, seller financing, or rate buy-down credit?
- Can we see the unit-by-unit rent roll, current vacancy, and any below-market leases? What's the average tenancy length?
- What capital expenditures (roof, boiler, parking lot, exteriors) have been made in the last 5 years, and what's planned in the next 2?
- Built in 1974 — when were the roof, HVAC, electrical panel, plumbing, and water heater last replaced?
- Why hasn't it sold? Are there any deal-killer items the seller is aware of (foundation, flood, title, zoning, code violations)?
- Is there a deadline driving the sale (1031 exchange, divorce, estate, relocation)? That informs how much negotiation room exists.
- Schools are D-rated, which usually means shorter tenancies and higher turnover. Who's the typical renter profile here, and what's been the actual vacancy rate?
- What's the average days-on-market for RENTAL listings here right now (not sales)? A rising rental-DOM trend means longer vacancies and softer asking-rent achievability than the comps imply.
- What's the recent tenant-quality profile in this submarket — average credit score on applications, eviction rate, late-payment / NSF rate, and stable-employment percentage? A property-management company in the area should have these aggregated.
- How much new apartment / multifamily construction is in the pipeline within 1–3 miles? Heavy new supply (>2% of stock underway) typically softens rents 12–24 months out; light construction supports rent growth.
Investment metrics
- 1% rule
- 1.14% ✓
- Cap rate
- 8.26%
- Cash-on-cash
- 7.03%
- DSCR
- 1.31
- GRM
- 7.3
CMA / ARV
- ARV (median comp)
- $346,879
- List price
- $555,000
- Delta
- 60.00%
- Verdict
- OVERPRICED
- Comps
- 20 within 1.0 mi
Projected returns pro-forma
-3.0% appreciation · 8.0% rent growth · sell at horizon
- IRR
- 0.3%
- Equity multiple
- 1.01×
- Total profit
- $1,604
- Equity at exit
- $82,752
- IRR
- 14.7%
- Equity multiple
- 2.47×
- Total profit
- $228,625
- Equity at exit
- $47,986
Cash invested: $155,400 (down + closing). Projections, not guarantees.
Landlord ↔ Tenant lean methodology
- Overall (STATE)
- 15 Strongly Tenant-Friendly
- State New York
- 15 Strongly Tenant-Friendly · D+10
- County
- — inherits STATE
- City
- — inherits STATE
ZIP-level market 13045
- Home prices YoY
- -9.3%
- Rents YoY
- 8.4%
- Active inventory
- 141
- Price-to-rent
- 22.0×
Monthly cashflow live
- Estimated rent
- $6,302 medium interval (Pro) →
- Mortgage (P&I)
- −$2,910
- Tax from tax record
- −$926 /mo · $11,115/yr
- Insurance
- −$231
- HOA
- −$0
- Vacancy / Maint / Mgmt
- −$1,323
- Net cashflow
- $911
Break-even live
3-unit breakdown (identical units grouped — click to expand)
| Units | Beds | Baths | Est. rent |
|---|---|---|---|
| 3× units | 5 | 1 | $6,303 |
| #1 | 5 | 1 | $2,101 |
| #2 | 5 | 1 | $2,101 |
| #3 | 5 | 1 | $2,101 |
| Total (3 units) | $6,302 | ||
UW: 25.0% down · 7.5% · 30yr · 1.5% tax · 5.0% vac · 8.0% maint · 8.0% mgmt
Financing live
Cash to close
- Down payment
- $138,750
- Closing costs
- $16,650
- Reserves months
- —
- Total cash needed
- —
Loan-product check · same deal, 3 products live
Conventional
25% down · 7.5% · 30yr
- Down + closing
- —
- Monthly P&I
- —
- Monthly cashflow
- —
- DSCR
- —
- Eligible?
- —
Personal DTI + credit; lowest rate.
DSCR
20% down · 8.5% · 30yr
- Down + closing
- —
- Monthly P&I
- —
- Monthly cashflow
- —
- DSCR
- —
- Eligible?
- —
No personal income docs; deal must DSCR.
Hard money
10% down · 12.0% · 12mo
- Down + closing
- —
- Monthly P&I
- —
- Monthly cashflow
- —
- DSCR
- —
- Eligible?
- —
Short-term bridge; refi at stabilization.
Listing history 21 events
-
2026-06-19days on market $555,000 Active 156 DOM
-
2026-06-18days on market $555,000 Active 155 DOM
-
2026-06-17days on market $555,000 Active 154 DOM
-
2026-06-16days on market $555,000 Active 153 DOM
-
2026-06-15days on market $555,000 Active 152 DOM
-
2026-06-14days on market $555,000 Active 150 DOM
-
2026-06-12days on market $555,000 Active 149 DOM
-
2026-06-09days on market $555,000 Active 146 DOM
-
2026-06-08days on market $555,000 Active 145 DOM
-
2026-06-07days on market $555,000 Active 144 DOM
-
2026-06-05days on market $555,000 Active 141 DOM
-
2026-06-03days on market $555,000 Active 140 DOM
-
2026-06-02days on market $555,000 Active 139 DOM
-
2026-06-01days on market $555,000 Active 138 DOM
-
2026-05-31days on market $555,000 Active 137 DOM
-
2026-05-30days on market $555,000 Active 136 DOM
-
2026-01-14$555,000 Active 509-char remark
Show marketing remark (509 chars)
3,974 square foot, 3-unit, 15 bedrooms total house (5 bedrooms per unit) currently used for student housing. Within walking distance of both SUNY Cortland and the Cortland City central business district. Rent is $3,600.00 per bedroom, per semester. Owner pays for electric and gas utilities. Large parking lot. The owner is a licensed real estate agent. Note: The garage shown at the rear of the property in aerial photographs has been removed. Also, the Town / County tax shown below includes the City tax.
-
2011-12-31soldstatus $405,000 113-char remark
Show marketing remark (113 chars)
Student Housing. Great House with lots of ammenities for the student lifestyle. Needs TLC to maximize investment.
-
2011-12-31$405,000 113-char remark
Show marketing remark (113 chars)
Student Housing. Great House with lots of ammenities for the student lifestyle. Needs TLC to maximize investment.
-
2005-11-23soldstatus $410,000
-
2001-07-02soldstatus $260,000
ⓘ Source: listings_history table (triggers on properties + properties_extension) + one-shot
backfill from property_details.listing_events for pre-trigger history.
Tax reassessment forecast NY · Partial reset (capped growth)
- Current annual tax
- $11,115 · $926/mo
- Projected year-2 tax
- $11,115 · $926/mo
- Expected delta
- $0/yr ($0/mo · 0.0%)
ⓘ Screening estimate from a state-policy table — verify with the county assessor before closing.
Climate risk First Street
- Flood 1/10 Low FEMA zone X (unshaded) · 0% chance over 30 yrs
- Wildfire 3/10 Moderate
- Heat 3/10 Moderate 8 d/yr ≥92°F today · 17 d/yr by 30 yrs out
- Wind 2/10 Low 100% chance of damaging wind over 30 yrs
- Air quality 2/10 Low 0 unhealthy d/yr today · 1 by 30 yrs out
Nearby sold comps map
Loading sold comps map…
Walkable amenities ~0.75 mi
Loading nearby amenities…
Taxation est. · year 1
- Rental income
- $75,624
- − Mortgage interest
- −$31,089
- − Property taxes
- −$11,115
- − Insurance
- −$2,775
- − Repairs & maintenance
- −$6,050
- − Management
- −$6,050
- − Depreciation
- −$16,145
- Taxable income
- $2,400
- Est. tax owed @ 24.0%
- −$576
- After-tax cash flow
- $10,351/yr
For passive investors: Depreciation is non-cash, so a rental often shows a tax loss while cash-flowing — sheltering income. Rental losses are passive: they offset passive income freely, and up to $25,000/yr can offset ordinary (W-2) income if you actively participate and your MAGI is under $100k (phasing out to $0 by $150k); unused losses carry forward. On sale, claimed depreciation is recaptured at up to 25%, and gains may owe capital-gains tax (a 1031 exchange can defer both). Figures are a year-1 estimate at your 24.0% rate — not tax advice; consult a CPA.
Schools (NCES district)
- District
- Cortland City School District
- NCES district ID
- 3608460
- Math proficiency
- 49% ▲ 6.00%
- Reading proficiency
- 54% ▲ 17.00%
- Median HH income
- $42,413
- Composite
- 43.29/100
- National rank
- #3041
- State rank
- #368 of 590 in NY
Livability — Cortland
- Score
- 77/100
- State rank
- #201
- US rank
- #3105
Category grades
Schools grade is shown separately in the Schools card above.
Census & demographics
- Census place
- Cortland, NY
- County
- Cortland County · 28,361 people
- City population
- 28,361
- Metro
- Cortland, NY
- Population (ZIP)
- 28,361
- Household income
- $69,961
- Rent vs Own
- Severe rent burden
- 1488.0
Population outlook (Cortland County) Hauer SSP2
- Today (2025)
- 47,543 people
- By 2030
- 46,107 · -3.0%
- By 2040
- 43,122 · -9.3%
- By 2050
- 40,216 · -15.4%
- By 2075
- 34,717 · -27.0%
- By 2100
- 28,953 · -39.1%
Race, ethnicity, and origin ACS 2023
- Neighborhood character
- Predominantly White (87%)
- Race & ethnicity
- White 87% Two or more races 5% Hispanic / Latino 5% Black 3% Asian 2%
- Common ancestry
- Romanian 4% Lithuanian 2% Italian 2%
- Foreign-born
- 3% · Canada, China
- Languages at home
- 94% English-only · Spanish 2% Russian/Polish/Slavic 2% Other Indo-European 1%
Political lean MEDSL · Cortland
- 2024 margin
- Lean R (+6.4) · D 46.8% · R 53.2%
- 2008→2024 swing
- -16.4pp toward R · 2008: 10.0pp · 2024: -6.4pp
- All cycles
- 2024: R+6.4 2020: R+1.9 2016: R+6.7 2012: D+8.8 2008: D+10.0
Not yet ingested
- Civics
- —
Market trends
- HPI YoY
- ▼ -29.78%
- Current HPI
- 289.515
- Rent YoY
- ▲ 8.37%
- Metro
- Cortland, NY
- State GDP YoY
- ▲ 2.60%
- F500 in state
- 92
Industry mix (Fortune 500 HQ in NY)
| Industry | F500 HQs | Revenue |
|---|---|---|
| Financial Services | 10 | $950B |
|
||
| Consumer Goods | 9 | $162B |
|
||
| Insurance | 4 | $225B |
|
||
| Telecommunications | 2 | $144B |
|
||
| Pharmaceuticals | 2 | $112B |
|
||
| Media / Entertainment | 2 | $69B |
|
||
Price history
+113.5% since first listed5 events — show timeline
- 2026-01-14 Listed $555,000 CNYIS
- 2011-12-31 Listed $405,000 CNYIS
- 2011-12-31 Sold (MLS) $405,000 CNYIS
- 2005-11-23 Sold (Public Records) $410,000 Public Records
- 2001-07-02 Sold (Public Records) $260,000 Public Records
Property tax history
-0.7%/yrLatest (2025): $11,115 · +4.5% YoY. Source: county tax records.
Cash-flow waterfall
monthlySold comps — $/sqft
last 12 mo · ≤1 miLoading sold comps…