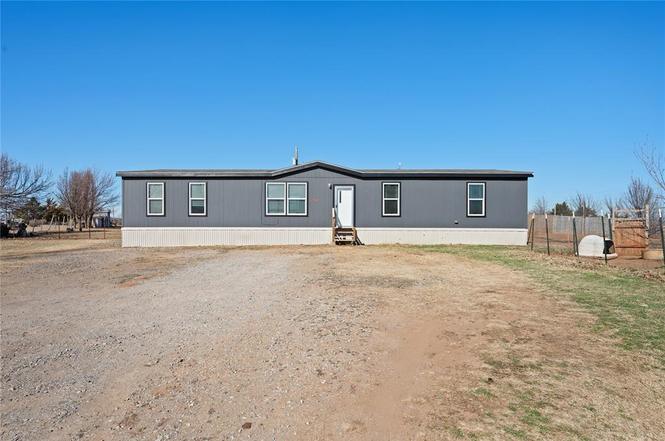
12201 Meadowlake · Guthrie, OK
Flood risk 1/10 · Minimal
- FEMA flood zone
- X (unshaded)
- Chance of flooding over 30 yrs
- 0.0%
- Est. flood insurance / yr
- $507 – $1,088
Fire risk 5/10 · Moderate
- Est. fire insurance / yr
- $2,463 – $4,575
Heat risk 6/10 · Moderate
- Hot days now (above 109°F)
- 7 days/yr
- Hot days in 30 yrs
- 19 days/yr
Wind risk 3/10 · Minor
- Chance of severe wind over 30 yrs
- 4.0%
Air-quality risk 2/10 · Minimal
- Unhealthy air days now
- 2 days/yr
- Unhealthy air days in 30 yrs
- 2 days/yr
Risk factors via First Street. Map © Google.
Why this score? — see what drove the F grade
The composite is a weighted blend of 9 inputs, each scored 0–100. Each bar is that input's sub-score; the figure is the points it added to the 100-point composite (weight × sub-score).
- ARV discount +7.5/15.0
- Cash flow +7.4/30.0
- Rent growth +5.0/5.0
- Livability +3.7/5.0
- Schools +3.6/10.0
- Condition / age +2.5/5.0
- 1% rule +2.1/10.0
- DSCR +1.6/10.0
- Appreciation +0.0/10.0
$220,000
🖨 Deal sheet (PDF) 📄 Offer letter ✓ Due diligence
Listing remarks MLS
Large Pie Shaped lot with a 16' x 20' storage building, large storm shelter, New AC in 2000, New Stove and Dishwasher in 2000, New Refridgerator in 2005. Wood Burning Fireplace. Needs new paint, carpet, and love. Offering a $1000 Carpet Allowance.
Key facts
- Second water setup
- Open layout
- Storm shelter
Tags
Property features AI
Finance
- Other: Allows livestock; Located in Country Home Estate addition; Homestead not indicated
- Financial info: Accepts Cash, Conventional, FHA or VA; Loan qualification possible
- HOA & community: No mandatory association dues
Exterior
- Security: Storm shelter
- Utilities: Aerobic system; Public water available; Septic tank; Electricity available; Natural gas available
- Home design: Single-family residence; One level; South-facing; Residential property; Model home
- Construction: Frame and mobile construction; Composition roof (new 2024); Conventional foundation; Built (existing)
- Exterior features: Storage; Cul-de-sac lot
Interior
- Kitchen: Gas range
- Bedrooms: 5 bedrooms
- Bathrooms: 2 full bathrooms
- Heating & cooling: Electric heating
- Interior features: Dishwasher; Refrigerator; No fireplace
Neighborhood map
What this means for you Summary
Snapshot
- This is a 3-bed/2.0-bath manufactured listed at $220k.
Deal economics
- At list price, monthly cash flow is $-282 ($-3k/yr) — negative.
- To cash-flow at today's rent, offer at most $179k (18.5% below list).
- To meet the 1% rule (rent ≥ 1% of price), the offer needs to be $157k (28.7% below list).
- Recommended offer: $157k (28.7% below list) — sets the bar for 1% rule.
- Cap rate 4.8% vs local median 3.1% in Guthrie — top-decile yield for the area; either an underpriced asset or a hidden risk that comps aren't pricing in. Stress-test before assuming the spread holds.
Location & tenants
- Location reads 74/100 on livability (#15 in OK, #4,696 nationally) — a middle-class / working-renter tenant base. Strengths: cost of living A+, housing A+, health & safety A+; Watch: amenities F, commute F.
- Edmond (suburban): math 38% / reading 40% proficiency, ranked #11 of 270 in OK (top 4%) — families likely to look elsewhere, expect single-tenant / working-renter base with shorter leases.
- Zoned schools: Cross Timbers Es (math 61% / reading 48%, grade C, #23 of 845 statewide, top 3%, 846 students, 0% FRL); Sequoyah Ms (math 40% / reading 34%, grade F, #17 of 345 statewide, top 6%, 1,006 students, 0% FRL); North Hs (math 47% / reading 57%, grade D+, #1 of 447 statewide, top 0%, 2,555 students, 0% FRL) — zoned schools average 0% FRL vs 22% district-wide (22 pts lower); this property's tenant base skews higher-income than the district average.
- Market conditions: Rents rising fast (+12.2%/yr); 851 active listings in the ZIP; 102 units permitted in Logan County in 2024 (0 in 5+ unit buildings).
Forward outlook
- Local home prices are declining (-3.0%/yr); year-one equity from $2k of loan paydown is wiped out by about $7k of value loss. Plan a longer hold.
- Logan County population projected at +36% by 2050 — long-run rental-demand tailwind backs the buy-and-hold thesis.
Negotiation context
- It's been on market 121 days — a 12% lower offer ($194k) is reasonable based on typical stale-listing flexibility.
- 2 sale attempts since 20y ago with the ask held roughly flat each time — persistent listings suggest the price (not the market) is what's stuck; bring a comps-based counter.
- Current owner paid $42k; list at $220k implies a 430% gain — meaningful room to come down on a strong offer.
Risks & watch-outs
- Climate carrying-cost: moderate wildfire risk; extreme-heat days projected 7→19/yr by 2055 (HVAC capex compounding) — expect insurance premiums to compound above CPI over the hold.
Questions for the listing agent
- What do current leases actually rent for vs. the listed asking? Can we see a recent rent roll and the last 12 months of T-12 income?
- It's been on market 121 days. Have you received any prior offers? Is the seller open to a 29% concession, seller financing, or rate buy-down credit?
- Why hasn't it sold? Are there any deal-killer items the seller is aware of (foundation, flood, title, zoning, code violations)?
- Is there a deadline driving the sale (1031 exchange, divorce, estate, relocation)? That informs how much negotiation room exists.
- Schools are F-rated, which usually means shorter tenancies and higher turnover. Who's the typical renter profile here, and what's been the actual vacancy rate?
- The area grade is low — what's the realistic commute time and amenity access for the typical tenant pool here? Any planned neighborhood developments (good or bad) we should know about?
- What's the average days-on-market for RENTAL listings here right now (not sales)? A rising rental-DOM trend means longer vacancies and softer asking-rent achievability than the comps imply.
- What's the recent tenant-quality profile in this submarket — average credit score on applications, eviction rate, late-payment / NSF rate, and stable-employment percentage? A property-management company in the area should have these aggregated.
- How much new for-sale + rental construction is in the pipeline within 1–3 miles? Heavy new supply typically softens prices + rents 12–24 months out; constrained supply supports both.
Investment metrics
- 1% rule
- 0.71% ✗
- Cap rate
- 4.76%
- Cash-on-cash
- -5.49%
- DSCR
- 0.76
- GRM
- 11.7
CMA / ARV
No comps found within radius.
Projected returns pro-forma
-3.0% appreciation · 8.0% rent growth · sell at horizon
- IRR
- -20.3%
- Equity multiple
- 0.26×
- Total profit
- $-45,285
- Equity at exit
- $32,803
- IRR
- -5.1%
- Equity multiple
- 0.60×
- Total profit
- $-24,732
- Equity at exit
- $19,022
Cash invested: $61,600 (down + closing). Projections, not guarantees.
Landlord ↔ Tenant lean methodology
- Overall (STATE)
- 83 Strongly Landlord-Friendly
- State Oklahoma
- 83 Strongly Landlord-Friendly · R+20
- County
- — inherits STATE
- City
- — inherits STATE
ZIP-level market 73044
- Home prices YoY
- -25.9%
- Rents YoY
- 12.2%
- Active inventory
- 851
- Price-to-rent
- 11.7×
Monthly cashflow live
- Estimated rent
- $1,568 medium interval (Pro) →
- Mortgage (P&I)
- −$1,154
- Tax est. 1.5%
- −$275 /mo · $3,300/yr
- Insurance
- −$92
- HOA
- −$0
- Vacancy / Maint / Mgmt
- −$329
- Net cashflow
- $-282
Break-even live
Sensitivity live
| Price | -10% $-130 | -5% $-206 | +0% $-282 | +5% $-358 | +10% $-434 |
|---|---|---|---|---|---|
| Rent | -10% $-406 | -5% $-344 | +0% $-282 | +5% $-220 | +10% $-158 |
| Rate | -1.0pp $-171 | -0.5pp $-226 | base $-282 | +0.5pp $-339 | +1.0pp $-397 |
UW: 25.0% down · 7.5% · 30yr · 1.5% tax · 5.0% vac · 8.0% maint · 8.0% mgmt
Financing live
Cash to close
- Down payment
- $55,000
- Closing costs
- $6,600
- Reserves months
- —
- Total cash needed
- —
Loan-product check · same deal, 3 products live
Conventional
25% down · 7.5% · 30yr
- Down + closing
- —
- Monthly P&I
- —
- Monthly cashflow
- —
- DSCR
- —
- Eligible?
- —
Personal DTI + credit; lowest rate.
DSCR
20% down · 8.5% · 30yr
- Down + closing
- —
- Monthly P&I
- —
- Monthly cashflow
- —
- DSCR
- —
- Eligible?
- —
No personal income docs; deal must DSCR.
Hard money
10% down · 12.0% · 12mo
- Down + closing
- —
- Monthly P&I
- —
- Monthly cashflow
- —
- DSCR
- —
- Eligible?
- —
Short-term bridge; refi at stabilization.
Listing history 19 events
-
2026-06-21days on market $220,000 Active 121 DOM
-
2026-06-18days on market $220,000 Active 118 DOM
-
2026-06-17days on market $220,000 Active 117 DOM
-
2026-06-16days on market $220,000 Active 116 DOM
-
2026-06-15days on market $220,000 Active 115 DOM
-
2026-06-13days on market $220,000 Active 113 DOM
-
2026-06-09days on market $220,000 Active 109 DOM
-
2026-06-08days on market $220,000 Active 108 DOM
-
2026-06-07days on market $220,000 Active 107 DOM
-
2026-06-03days on market $220,000 Active 103 DOM
-
2026-06-02days on market $220,000 Active 102 DOM
-
2026-06-01days on market $220,000 Active 101 DOM
-
2026-05-31days on market $220,000 Active 100 DOM
-
2026-04-01price $220,000
-
2026-02-20$225,000 Active
-
2007-09-14soldstatus $41,500 248-char remark
Show marketing remark (248 chars)
Large Pie Shaped lot with a 16' x 20' storage building, large storm shelter, New AC in 2000, New Stove and Dishwasher in 2000, New Refridgerator in 2005. Wood Burning Fireplace. Needs new paint, carpet, and love. Offering a $1000 Carpet Allowance.
-
2006-12-09$48,000 248-char remark
Show marketing remark (248 chars)
Large Pie Shaped lot with a 16' x 20' storage building, large storm shelter, New AC in 2000, New Stove and Dishwasher in 2000, New Refridgerator in 2005. Wood Burning Fireplace. Needs new paint, carpet, and love. Offering a $1000 Carpet Allowance.
-
1999-10-31soldstatus $13,000
-
1990-09-27soldstatus $19,500
ⓘ Source: listings_history table (triggers on properties + properties_extension) + one-shot
backfill from property_details.listing_events for pre-trigger history.
Climate risk First Street
- Flood 1/10 Low FEMA zone X (unshaded) · 0% chance over 30 yrs
- Wildfire 5/10 Major
- Heat 6/10 Major 7 d/yr ≥109°F today · 19 d/yr by 30 yrs out
- Wind 3/10 Moderate 4% chance of damaging wind over 30 yrs
- Air quality 2/10 Low 2 unhealthy d/yr today · 2 by 30 yrs out
Nearby sold comps map
Loading sold comps map…
Walkable amenities ~0.75 mi
Loading nearby amenities…
Taxation est. · year 1
- Rental income
- $18,814
- − Mortgage interest
- −$12,323
- − Property taxes
- −$3,300
- − Insurance
- −$1,100
- − Repairs & maintenance
- −$1,505
- − Management
- −$1,505
- − Depreciation
- −$6,400
- Taxable loss
- −$7,319
- Est. tax savings @ 24.0%
- +$1,757
- After-tax cash flow
- $-1,624/yr
For passive investors: Depreciation is non-cash, so a rental often shows a tax loss while cash-flowing — sheltering income. Rental losses are passive: they offset passive income freely, and up to $25,000/yr can offset ordinary (W-2) income if you actively participate and your MAGI is under $100k (phasing out to $0 by $150k); unused losses carry forward. On sale, claimed depreciation is recaptured at up to 25%, and gains may owe capital-gains tax (a 1031 exchange can defer both). Figures are a year-1 estimate at your 24.0% rate — not tax advice; consult a CPA.
Schools (NCES district)
- District
- Edmond
- NCES district ID
- 4010590
- Math proficiency
- 38% ▼ -12.00%
- Reading proficiency
- 40% ▼ -12.00%
- Median HH income
- $73,212
- Composite
- 35.88/100
- National rank
- #4814
- State rank
- #11 of 270 in OK
Livability — Guthrie
- Score
- 74/100
- State rank
- #15
- US rank
- #4696
Category grades
Schools grade is shown separately in the Schools card above.
Census & demographics
- County
- Logan County · 25,398 people
- City population
- 25,398
- Metro
- Oklahoma City, OK
- Population (ZIP)
- 25,398
- Household income
- $72,288
- Rent vs Own
- Severe rent burden
- 397.0
Population outlook (Logan County) Hauer SSP2
- Today (2025)
- 55,683 people
- By 2030
- 60,011 · +7.8%
- By 2040
- 68,071 · +22.2%
- By 2050
- 75,815 · +36.2%
- By 2075
- 94,749 · +70.2%
- By 2100
- 108,057 · +94.1%
Race, ethnicity, and origin ACS 2023
- Neighborhood character
- Predominantly White (77%)
- Race & ethnicity
- White 77% Two or more races 10% Hispanic / Latino 8% Black 6% Native American 3%
- Hispanic origin (detail)
- Mexican 7%
- Common ancestry
- Slovak 3% Lithuanian 3% Italian 2%
- Foreign-born
- 3% · Canada
- Languages at home
- 94% English-only · Spanish 6%
Political lean MEDSL · Logan
- 2024 margin
- Solid R (+49.0) · D 24.4% · R 73.5% · Other 2.1%
- 2008→2024 swing
- -11.6pp toward R · 2008: -37.4pp · 2024: -49.0pp
- All cycles
- 2024: R+49.0 2020: R+47.1 2016: R+49.5 2012: R+44.8 2008: R+37.4
Not yet ingested
- Civics
- —
Market trends
- HPI YoY
- ▼ -86.90%
- Current HPI
- 247.9481
- Rent YoY
- ▲ 12.22%
- Metro
- Oklahoma City, OK
- State GDP YoY
- ▲ 1.55%
- F500 in state
- 6
Industry mix (Fortune 500 HQ in OK)
| Industry | F500 HQs | Revenue |
|---|---|---|
| Energy | 3 | $48B |
|
||
Price history
+1028.2% since first listed6 events — show timeline
- 2026-04-01 Price Changed $220,000 MLSOK
- 2026-02-20 Listed $225,000 MLSOK
- 2007-09-14 Sold (MLS) $41,500 MLSOK
- 2006-12-09 Listed $48,000 MLSOK
- 1999-10-31 Sold (Public Records) $13,000 Public Records
- 1990-09-27 Sold (Public Records) $19,500 Public Records
Property tax history
+1.2%/yrLatest (2025): $436 · +21.4% YoY. Source: county tax records.
Cash-flow waterfall
monthlySold comps — $/sqft
last 12 mo · ≤1 miLoading sold comps…