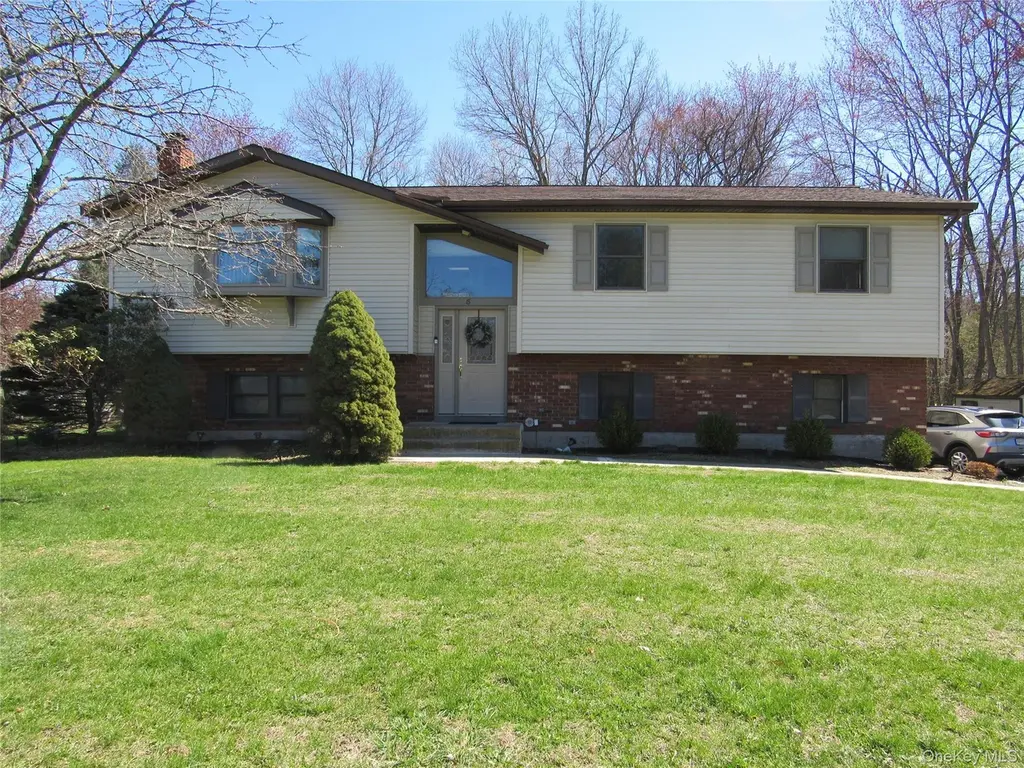
5 Hillside Rd · Middletown, NY
Flood risk 1/10 · Minimal
- FEMA flood zone
- X (unshaded)
- Chance of flooding over 30 yrs
- 0.0%
- Est. flood insurance / yr
- $473 – $860
Fire risk 3/10 · Minor
- Est. fire insurance / yr
- $691 – $1,283
Heat risk 4/10 · Minor
- Hot days now (above 100°F)
- 7 days/yr
- Hot days in 30 yrs
- 15 days/yr
Wind risk 4/10 · Minor
- Chance of severe wind over 30 yrs
- 11.0%
Air-quality risk 2/10 · Minimal
- Unhealthy air days now
- 1 days/yr
- Unhealthy air days in 30 yrs
- 2 days/yr
Risk factors via First Street. Map © Google.
Why this score? — see what drove the D grade
The composite is a weighted blend of 9 inputs, each scored 0–100. Each bar is that input's sub-score; the figure is the points it added to the 100-point composite (weight × sub-score).
- ARV discount +15.0/15.0
- Appreciation +10.0/10.0
- Schools +5.0/10.0
- Livability +4.1/5.0
- Rent growth +2.5/5.0
- Condition / age +2.5/5.0
- Cash flow +1.6/30.0
- 1% rule +0.0/10.0
- DSCR +0.0/10.0
$455,000
🖨 Deal sheet 📄 Offer letter ✓ Due diligence
Listing remarks MLS
Welcome Home! Open and bright with lots of windows! Spacious 3 BR home is set on corner .9 acres in Ridgebury Lake Acres with lake rights to Ridgebury Lake! Well maintained by only owners! Large LR with bay window opens to DR with sliders to deck that overlooks private backyard! EIK has stainless steel appliances and skylight! Spacious Family room has brick fireplace! Pella windows! C/A and whole house fan! Water filter system!
Key facts
- 0.9 acre lot
- 2 garage spots
- Built 1985
Neighborhood map
What this means for you Summary
Snapshot
- This is a 3-bed/2.5-bath single-family listed at $455k.
Deal economics
- At list price, monthly cash flow is $-2k ($-21k/yr) — negative.
- To cash-flow at today's rent, offer at most $177k (61.1% below list).
- To meet the 1% rule (rent ≥ 1% of price), the offer needs to be $197k (56.6% below list).
- Recommended offer: $177k (61.1% below list) — sets the bar for cash-flow.
- Cap rate 1.7% vs local median 3.3% in Middletown — below-typical yield; the buyer is paying a premium for something (appreciation thesis, condition, location) that the cap rate doesn't capture.
Location & tenants
- Location reads 82/100 on livability (#79 in NY, #1,219 nationally) — a professional / high-income tenant draw. Strengths: amenities A+, housing A+, health & safety A+; Watch: commute C-, schools D+.
- Minisink Valley Central School District (rural): math 51% / reading 59% proficiency, ranked #254 of 590 in NY (top 43%) — acceptable for families but not a draw, mixed tenant base, ~2y average lease; only 17% free/reduced lunch — higher-income household profile.
- Market conditions: 47 active listings in the ZIP; 1,746 units permitted in Orange County in 2024 (1,265 in 5+ unit buildings).
Forward outlook
- In year one you build about $49k of equity ($3k loan paydown + $46k appreciation (10.0% local appreciation)).
- By year 2, paydown + projected appreciation supports a ~$78k cash-out refi (75% LTV) — recoverable capital for the next deal without selling this one.
Negotiation context
- It's been on market 36 days — a 3% lower offer ($441k) is reasonable based on typical stale-listing flexibility.
Questions for the listing agent
- What do current leases actually rent for vs. the listed asking? Can we see a recent rent roll and the last 12 months of T-12 income?
- It's been on market 36 days. Have you received any prior offers? Is the seller open to a 61% concession, seller financing, or rate buy-down credit?
- Is there a deadline driving the sale (1031 exchange, divorce, estate, relocation)? That informs how much negotiation room exists.
- Schools are D-rated, which usually means shorter tenancies and higher turnover. Who's the typical renter profile here, and what's been the actual vacancy rate?
- The area grade is low — what's the realistic commute time and amenity access for the typical tenant pool here? Any planned neighborhood developments (good or bad) we should know about?
- What's the average days-on-market for RENTAL listings here right now (not sales)? A rising rental-DOM trend means longer vacancies and softer asking-rent achievability than the comps imply.
- What's the recent tenant-quality profile in this submarket — average credit score on applications, eviction rate, late-payment / NSF rate, and stable-employment percentage? A property-management company in the area should have these aggregated.
- How much new for-sale + rental construction is in the pipeline within 1–3 miles? Heavy new supply typically softens prices + rents 12–24 months out; constrained supply supports both.
Investment metrics
- 1% rule
- 0.43% ✗
- Cap rate
- 1.67%
- Cash-on-cash
- -16.52%
- DSCR
- 0.26
- GRM
- 19.2
CMA / ARV
- ARV (median comp)
- $574,625
- List price
- $455,000
- Delta
- -20.82%
- Verdict
- UNDERPRICED
- Comps
- 10 within 1.0 mi
Projected returns pro-forma
10.0% appreciation · 3.0% rent growth · sell at horizon
- IRR
- 12.9%
- Equity multiple
- 2.07×
- Total profit
- $136,221
- Equity at exit
- $409,900
- IRR
- 13.2%
- Equity multiple
- 4.84×
- Total profit
- $489,266
- Equity at exit
- $883,965
Cash invested: $127,400 (down + closing). Projections, not guarantees.
Landlord ↔ Tenant lean methodology
- Overall (STATE)
- 15 Strongly Tenant-Friendly
- State New York
- 15 Strongly Tenant-Friendly · D+10
- County
- — inherits STATE
- City
- — inherits STATE
ZIP-level market 10973
- Home prices YoY
- 12.3%
- Active inventory
- 47
- Price-to-rent
- 19.2×
Monthly cashflow live
- Estimated rent
- $1,973 medium interval (Pro) →
- Mortgage (P&I)
- −$2,386
- Tax from tax record
- −$737 /mo · $8,847/yr
- Insurance
- −$190
- HOA
- −$0
- Vacancy / Maint / Mgmt
- −$414
- Net cashflow
- $-1,754
Break-even live
UW: 25.0% down · 7.5% · 30yr · 1.5% tax · 5.0% vac · 8.0% maint · 8.0% mgmt
Financing live
Cash to close
- Down payment
- $113,750
- Closing costs
- $13,650
- Reserves months
- —
- Total cash needed
- —
Loan-product check · same deal, 3 products live
Conventional
25% down · 7.5% · 30yr
- Down + closing
- —
- Monthly P&I
- —
- Monthly cashflow
- —
- DSCR
- —
- Eligible?
- —
Personal DTI + credit; lowest rate.
DSCR
20% down · 8.5% · 30yr
- Down + closing
- —
- Monthly P&I
- —
- Monthly cashflow
- —
- DSCR
- —
- Eligible?
- —
No personal income docs; deal must DSCR.
Hard money
10% down · 12.0% · 12mo
- Down + closing
- —
- Monthly P&I
- —
- Monthly cashflow
- —
- DSCR
- —
- Eligible?
- —
Short-term bridge; refi at stabilization.
Listing history 3 events
-
2026-06-02statusdays on market $455,000 Pending 36 DOM
-
2026-04-17$455,000 Active 431-char remark
Show marketing remark (431 chars)
Welcome Home! Open and bright with lots of windows! Spacious 3 BR home is set on corner .9 acres in Ridgebury Lake Acres with lake rights to Ridgebury Lake! Well maintained by only owners! Large LR with bay window opens to DR with sliders to deck that overlooks private backyard! EIK has stainless steel appliances and skylight! Spacious Family room has brick fireplace! Pella windows! C/A and whole house fan! Water filter system!
-
2026-04-14historical $455,000 431-char remark
Show marketing remark (431 chars)
Welcome Home! Open and bright with lots of windows! Spacious 3 BR home is set on corner .9 acres in Ridgebury Lake Acres with lake rights to Ridgebury Lake! Well maintained by only owners! Large LR with bay window opens to DR with sliders to deck that overlooks private backyard! EIK has stainless steel appliances and skylight! Spacious Family room has brick fireplace! Pella windows! C/A and whole house fan! Water filter system!
ⓘ Source: listings_history table (triggers on properties + properties_extension) + one-shot
backfill from property_details.listing_events for pre-trigger history.
Tax reassessment forecast NY · Partial reset (capped growth)
- Current annual tax
- $8,847 · $737/mo
- Projected year-2 tax
- $8,847 · $737/mo
- Expected delta
- $0/yr ($0/mo · 0.0%)
ⓘ Screening estimate from a state-policy table — verify with the county assessor before closing.
Climate risk First Street
- Flood 1/10 Low FEMA zone X (unshaded) · 0% chance over 30 yrs
- Wildfire 3/10 Moderate
- Heat 4/10 Moderate 7 d/yr ≥100°F today · 15 d/yr by 30 yrs out
- Wind 4/10 Moderate 11% chance of damaging wind over 30 yrs
- Air quality 2/10 Low 1 unhealthy d/yr today · 2 by 30 yrs out
Nearby sold comps map
Loading sold comps map…
Walkable amenities ~0.75 mi
Loading nearby amenities…
Taxation est. · year 1
- Rental income
- $23,678
- − Mortgage interest
- −$25,487
- − Property taxes
- −$8,847
- − Insurance
- −$2,275
- − Repairs & maintenance
- −$1,894
- − Management
- −$1,894
- − Depreciation
- −$13,236
- Taxable loss
- −$29,956
- Est. tax savings @ 24.0%
- +$7,189
- After-tax cash flow
- $-13,860/yr
For passive investors: Depreciation is non-cash, so a rental often shows a tax loss while cash-flowing — sheltering income. Rental losses are passive: they offset passive income freely, and up to $25,000/yr can offset ordinary (W-2) income if you actively participate and your MAGI is under $100k (phasing out to $0 by $150k); unused losses carry forward. On sale, claimed depreciation is recaptured at up to 25%, and gains may owe capital-gains tax (a 1031 exchange can defer both). Figures are a year-1 estimate at your 24.0% rate — not tax advice; consult a CPA.
Schools (NCES district)
- District
- Minisink Valley Central School District
- NCES district ID
- 3619560
- Math proficiency
- 51% ▼ -5.00%
- Reading proficiency
- 59% ▲ 5.00%
- Median HH income
- $84,292
- Composite
- 50.18/100
- National rank
- #1897
- State rank
- #254 of 590 in NY
Livability — Middletown
- Score
- 82/100
- State rank
- #79
- US rank
- #1219
Category grades
Schools grade is shown separately in the Schools card above.
Census & demographics
- City population
- 68,033
- Population (ZIP)
- 2,300
Population outlook (Orange County) Hauer SSP2
- Today (2025)
- 379,830 people
- By 2030
- 378,955 · -0.2%
- By 2040
- 375,444 · -1.2%
- By 2050
- 369,311 · -2.8%
- By 2075
- 354,233 · -6.7%
- By 2100
- 318,150 · -16.2%
Race, ethnicity, and origin ACS 2023
- Neighborhood character
- Predominantly White (68%)
- Race & ethnicity
- White 68% Hispanic / Latino 22% Two or more races 15% Black 8% Native American 3% Asian 1%
- Hispanic origin (detail)
- Mexican 2% Puerto Rican 10% Dominican 3%
- Common ancestry
- Romanian 3% Portuguese 2% Scotch-Irish 2%
- Foreign-born
- 6% · Canada, South Korea, China
- Languages at home
- 89% English-only · Spanish 7% French/Haitian/Cajun 1% Russian/Polish/Slavic 1%
Political lean MEDSL · Orange
- 2024 margin
- Lean R (+8.4) · D 45.8% · R 54.2%
- 2008→2024 swing
- -12.5pp toward R · 2008: 4.1pp · 2024: -8.4pp
- All cycles
- 2024: R+8.4 2020: R+0.2 2016: R+6.5 2012: D+5.2 2008: D+4.1
Not yet ingested
- Civics
- —
Market trends
- HPI YoY
- ▲ 31.96%
- Current HPI
- 292.1751
- Rent YoY
- —
- Metro
- —
- State GDP YoY
- ▲ 2.60%
- F500 in state
- 92
Industry mix (Fortune 500 HQ in NY)
| Industry | F500 HQs | Revenue |
|---|---|---|
| Financial Services | 10 | $950B |
|
||
| Consumer Goods | 9 | $162B |
|
||
| Insurance | 4 | $225B |
|
||
| Telecommunications | 2 | $144B |
|
||
| Pharmaceuticals | 2 | $112B |
|
||
| Media / Entertainment | 2 | $69B |
|
||
Price history
+0.0% since first listed2 events — show timeline
- 2026-04-17 Listed $455,000 OneKey® MLS as Distributed by MLS Grid
- 2026-04-14 Coming Soon $455,000 OneKey® MLS as Distributed by MLS Grid
Property tax history
+3.4%/yrLatest (2025): $8,847 · +2.2% YoY. Source: county tax records.
Cash-flow waterfall
monthlySold comps — $/sqft
last 12 mo · ≤1 miLoading sold comps…