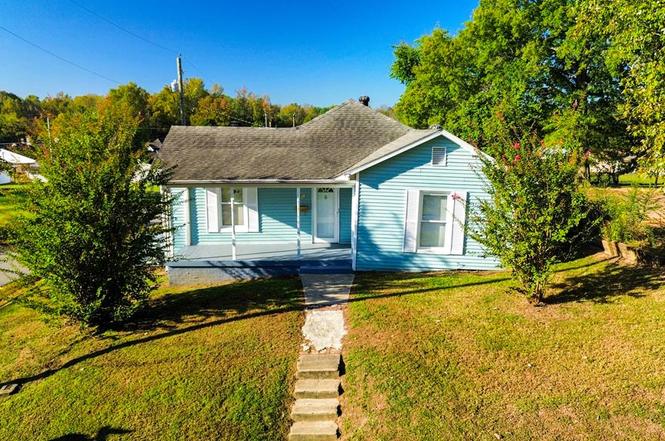
513 S Robinson St · Earlington, KY
Flood risk 1/10 · Minimal
- FEMA flood zone
- X (unshaded)
- Chance of flooding over 30 yrs
- 0.0%
- Est. flood insurance / yr
- $507 – $1,088
Fire risk 4/10 · Minor
- Est. fire insurance / yr
- $839 – $1,559
Heat risk 5/10 · Moderate
- Hot days now (above 109°F)
- 7 days/yr
- Hot days in 30 yrs
- 21 days/yr
Wind risk 3/10 · Minor
- Chance of severe wind over 30 yrs
- 5.0%
Air-quality risk 2/10 · Minimal
- Unhealthy air days now
- 1 days/yr
- Unhealthy air days in 30 yrs
- 1 days/yr
Risk factors via First Street. Map © Google.
Why this score? — see what drove the D grade
The composite is a weighted blend of 9 inputs, each scored 0–100. Each bar is that input's sub-score; the figure is the points it added to the 100-point composite (weight × sub-score).
- Cash flow +12.0/30.0
- ARV discount +7.5/15.0
- Appreciation +5.9/10.0
- DSCR +3.6/10.0
- Livability +3.5/5.0
- Schools +3.0/10.0
- Rent growth +2.5/5.0
- Condition / age +2.5/5.0
- 1% rule +2.2/10.0
$134,900
🖨 Deal sheet (PDF) 📄 Offer letter ✓ Due diligence
Listing remarks
Charming 3-bedroom, 1-bath home on a spacious corner lot with plenty of off-street parking! Enjoy relaxing on the covered front porch or make use of the detached garage and separate workshop - perfect for hobbies or storage. Inside, you'll love the completely remodeled kitchen featuring brand-new stainless-steel appliances, updated cabinetry, and two convenient pantries. Fresh new flooring flows throughout the home and replacement windows bring in great natural light. The large walk-in closet provides excellent storage space, and there's even a cellar (outside entrance only). This move-in-ready home combines modern updates with functional extras and sits in a convenient location close to to
Key facts
- Covered front porch
- Remodeled kitchen
- Updated cabinetry
Tags
Property features AI
Exterior
- Parking: 1-car garage; Gravel parking areas
- Utilities: Public water; Public sewer
- Home design: Single family residence; Residential property
- Construction: Vinyl siding; Composition roof
- Exterior features: Covered patio/porch; Outbuilding; Corner lot; Tons of parking behind home (gravel and blacktop areas)
Interior
- Kitchen: Range; Microwave; Electric range; Refrigerator
- Bedrooms: 3 bedrooms on the main level
- Bathrooms: 1 full bathroom (main level)
- Heating & cooling: Central air; Ceiling fan(s); Forced air heating; Natural gas heating
- Interior features: Walk-in closet(s)
- Laundry & utility: Laundry on the main level; Electric water heater
Neighborhood map
What this means for you Summary
Snapshot
- This is a 3-bed/1.0-bath single-family listed at $135k.
Deal economics
- At list price, monthly cash flow is $-32 ($-380/yr) — negative.
- To cash-flow at today's rent, offer at most $129k (4.1% below list).
- To meet the 1% rule (rent ≥ 1% of price), the offer needs to be $97k (28.4% below list).
- Recommended offer: $97k (28.4% below list) — sets the bar for 1% rule.
Location & tenants
- Location reads 69/100 on livability (#175 in KY) — a middle-class / working-renter tenant base. Strengths: crime A+, cost of living A+, housing A-; Watch: amenities F, commute F, employment D-.
- Hopkins County (town): math 27% / reading 43% proficiency, ranked #65 of 165 in KY (top 39%) — families likely to look elsewhere, expect single-tenant / working-renter base with shorter leases.
- Zoned schools: Earlington Elementary School (math 47% / reading 52%, grade D, #100 of 676 statewide, top 16%, 277 students, 69% FRL); South Hopkins Middle School (math 23% / reading 37%, grade F, #146 of 217 statewide, top 69%, 365 students, 59% FRL); Hopkins County Central High School (math 22% / reading 37%, grade F, #127 of 254 statewide, top 58%, 774 students, 58% FRL).
- Market conditions: 8 active listings in the ZIP; 122 units permitted in Hopkins County in 2024 (0 in 5+ unit buildings).
Forward outlook
- In year one you build about $3k of equity ($933 loan paydown + $2k appreciation (1.9% local appreciation)).
- Hopkins County population projected at -13% by 2050 — secular population decline; favor cash flow + early exit over multi-decade hold.
- At projected returns (1.9% appreciation + 3.0% rent growth), your $38k cash investment doubles in ~9 years — after that, you're playing with house money.
- By year 10, paydown + projected appreciation supports a ~$34k cash-out refi (75% LTV) — recoverable capital for the next deal without selling this one.
Negotiation context
- It's been on market 204 days — a 12% lower offer ($119k) is reasonable based on typical stale-listing flexibility.
- Current owner paid $38k; list at $135k implies a 256% gain — meaningful room to come down on a strong offer.
Risks & watch-outs
- Watch-outs: built in 1909 — expect roof / HVAC / electrical / plumbing capex.
- Climate carrying-cost: extreme-heat days projected 7→21/yr by 2055 (HVAC capex compounding) — expect insurance premiums to compound above CPI over the hold.
Questions for the listing agent
- What do current leases actually rent for vs. the listed asking? Can we see a recent rent roll and the last 12 months of T-12 income?
- It's been on market 204 days. Have you received any prior offers? Is the seller open to a 28% concession, seller financing, or rate buy-down credit?
- Built in 1909 — when were the roof, HVAC, electrical panel, plumbing, and water heater last replaced?
- Why hasn't it sold? Are there any deal-killer items the seller is aware of (foundation, flood, title, zoning, code violations)?
- Is there a deadline driving the sale (1031 exchange, divorce, estate, relocation)? That informs how much negotiation room exists.
- The area grade is low — what's the realistic commute time and amenity access for the typical tenant pool here? Any planned neighborhood developments (good or bad) we should know about?
- What's the average days-on-market for RENTAL listings here right now (not sales)? A rising rental-DOM trend means longer vacancies and softer asking-rent achievability than the comps imply.
- What's the recent tenant-quality profile in this submarket — average credit score on applications, eviction rate, late-payment / NSF rate, and stable-employment percentage? A property-management company in the area should have these aggregated.
- How much new for-sale + rental construction is in the pipeline within 1–3 miles? Heavy new supply typically softens prices + rents 12–24 months out; constrained supply supports both.
Investment metrics
- 1% rule
- 0.72% ✗
- Cap rate
- 6.01%
- Cash-on-cash
- -1.00%
- DSCR
- 0.96
- GRM
- 11.6
CMA / ARV
- ARV (on-the-fly)
- $79,488
- Comps found
- 4
Show comp detail 4 sales within ~0.75 mi
| Address | Dist | Beds/Ba | Sqft | Sold | Price | $/sf | Match |
|---|---|---|---|---|---|---|---|
| 513 S Robinson St | 0.00mi | 3/1.0 | 1,104 (0%) | 0mo | $120,000 | $109 | 100 |
| 410 S Lee Trover Todd Jr Hwy | 0.13mi | 2/1.0 (-1) | 1,172 (+6%) | 1mo | $13,000 | $11 | 78 |
| 408 W Boyle Ave | 0.47mi | 3/1.0 | 1,164 (+5%) | 5mo | $80,000 | $69 | 65 |
| 106 Oakwood Ave | 0.59mi | 2/1.0 (-1) | 1,216 (+10%) | 11mo | $87,500 | $72 | 42 |
Match score weights: distance 35% · size 25% · config 20% · recency 20%. Top-matched comps best support the ARV.
Projected returns pro-forma
1.85% appreciation · 3.0% rent growth · sell at horizon
- IRR
- 3.0%
- Equity multiple
- 1.16×
- Total profit
- $6,129
- Equity at exit
- $52,107
- IRR
- 6.9%
- Equity multiple
- 1.93×
- Total profit
- $35,053
- Equity at exit
- $74,198
Cash invested: $37,772 (down + closing). Projections, not guarantees.
Landlord ↔ Tenant lean methodology
- Overall (STATE)
- 83 Strongly Landlord-Friendly
- State Kentucky
- 83 Strongly Landlord-Friendly · R+16
- County
- — inherits STATE
- City
- — inherits STATE
ZIP-level market 42410
- Home prices YoY
- 2.1%
- Active inventory
- 8
- Price-to-rent
- 11.6×
Monthly cashflow live
- Estimated rent
- $966 medium interval (Pro) →
- Mortgage (P&I)
- −$707
- Tax from tax record
- −$31 /mo · $369/yr
- Insurance
- −$56
- HOA
- −$0
- Vacancy / Maint / Mgmt
- −$203
- Net cashflow
- $-32
Break-even live
Sensitivity live
| Price | -10% $45 | -5% $7 | +0% $-32 | +5% $-70 | +10% $-108 |
|---|---|---|---|---|---|
| Rent | -10% $-108 | -5% $-70 | +0% $-32 | +5% $7 | +10% $45 |
| Rate | -1.0pp $36 | -0.5pp $3 | base $-32 | +0.5pp $-67 | +1.0pp $-102 |
UW: 25.0% down · 7.5% · 30yr · 1.5% tax · 5.0% vac · 8.0% maint · 8.0% mgmt
Financing live
Cash to close
- Down payment
- $33,725
- Closing costs
- $4,047
- Reserves months
- —
- Total cash needed
- —
Loan-product check · same deal, 3 products live
Conventional
25% down · 7.5% · 30yr
- Down + closing
- —
- Monthly P&I
- —
- Monthly cashflow
- —
- DSCR
- —
- Eligible?
- —
Personal DTI + credit; lowest rate.
DSCR
20% down · 8.5% · 30yr
- Down + closing
- —
- Monthly P&I
- —
- Monthly cashflow
- —
- DSCR
- —
- Eligible?
- —
No personal income docs; deal must DSCR.
Hard money
10% down · 12.0% · 12mo
- Down + closing
- —
- Monthly P&I
- —
- Monthly cashflow
- —
- DSCR
- —
- Eligible?
- —
Short-term bridge; refi at stabilization.
Listing history 9 events
-
2026-05-13status Pending
-
2026-05-06price $134,900
-
2026-04-07price $139,900
-
2026-03-07price $145,000
-
2026-01-12price $154,000
-
2025-10-20$165,000 Active
-
2001-08-01soldstatus $37,900
-
1997-08-01soldstatus $38,000
-
1985-11-01soldstatus $19,000
ⓘ Source: listings_history table (triggers on properties + properties_extension) + one-shot
backfill from property_details.listing_events for pre-trigger history.
Tax reassessment forecast KY · Resets to sale price
- Current annual tax
- $369 · $31/mo
- Projected year-2 tax
- $1,160 · $97/mo
- Expected delta
- +$791/yr (+$66/mo · 214.1%)
ⓘ Screening estimate from a state-policy table — verify with the county assessor before closing.
Climate risk First Street
- Flood 1/10 Low FEMA zone X (unshaded) · 0% chance over 30 yrs
- Wildfire 4/10 Moderate
- Heat 5/10 Major 7 d/yr ≥109°F today · 21 d/yr by 30 yrs out
- Wind 3/10 Moderate 5% chance of damaging wind over 30 yrs
- Air quality 2/10 Low 1 unhealthy d/yr today · 1 by 30 yrs out
Nearby sold comps map
Loading sold comps map…
Walkable amenities ~0.75 mi
Loading nearby amenities…
Taxation est. · year 1
- Rental income
- $11,587
- − Mortgage interest
- −$7,556
- − Property taxes
- −$369
- − Insurance
- −$674
- − Repairs & maintenance
- −$927
- − Management
- −$927
- − Depreciation
- −$3,924
- Taxable loss
- −$2,792
- Est. tax savings @ 24.0%
- +$670
- After-tax cash flow
- $291/yr
For passive investors: Depreciation is non-cash, so a rental often shows a tax loss while cash-flowing — sheltering income. Rental losses are passive: they offset passive income freely, and up to $25,000/yr can offset ordinary (W-2) income if you actively participate and your MAGI is under $100k (phasing out to $0 by $150k); unused losses carry forward. On sale, claimed depreciation is recaptured at up to 25%, and gains may owe capital-gains tax (a 1031 exchange can defer both). Figures are a year-1 estimate at your 24.0% rate — not tax advice; consult a CPA.
Schools (NCES district)
- District
- Hopkins County
- NCES district ID
- 2102860
- Math proficiency
- 27% ▼ -23.00%
- Reading proficiency
- 43% ▼ -17.00%
- Median HH income
- $42,436
- Composite
- 29.56/100
- National rank
- #6488
- State rank
- #65 of 165 in KY
Livability — Earlington
- Score
- 69/100
- State rank
- #175
- US rank
- #8758
Category grades
Schools grade is shown separately in the Schools card above.
Census & demographics
- Census place
- Earlington, KY
- City population
- 1,113
- Population (ZIP)
- 1,113
Population outlook (Hopkins County) Hauer SSP2
- Today (2025)
- 45,164 people
- By 2030
- 44,083 · -2.4%
- By 2040
- 41,650 · -7.8%
- By 2050
- 39,303 · -13.0%
- By 2075
- 34,567 · -23.5%
- By 2100
- 29,476 · -34.7%
Race, ethnicity, and origin ACS 2023
- Neighborhood character
- Predominantly White (72%)
- Race & ethnicity
- White 72% Black 24% Asian 2% Two or more races 2%
- Common ancestry
- Italian 7% Slovak 2% Serbian 1%
- Foreign-born
- 2%
Political lean MEDSL · Hopkins
- 2024 margin
- Solid R (+50.9) · D 23.9% · R 74.8% · Other 1.2%
- 2008→2024 swing
- -26.0pp toward R · 2008: -24.9pp · 2024: -50.9pp
- All cycles
- 2024: R+50.9 2020: R+48.0 2016: R+54.0 2012: R+39.9 2008: R+24.9
Not yet ingested
- Civics
- —
Market trends
- HPI YoY
- ▲ 1.85%
- Current HPI
- 87.8854
- Rent YoY
- —
- Metro
- —
- State GDP YoY
- ▲ 1.81%
- F500 in state
- 4
Industry mix (Fortune 500 HQ in KY)
| Industry | F500 HQs | Revenue |
|---|---|---|
| Healthcare | 1 | $118B |
|
||
| Food / Beverage | 1 | $7B |
|
||
Price history
+610.0% since first listed9 events — show timeline
- 2026-05-13 Pending — MHCBOR
- 2026-05-06 Price Changed $134,900 MHCBOR
- 2026-04-07 Price Changed $139,900 MHCBOR
- 2026-03-07 Price Changed $145,000 MHCBOR
- 2026-01-12 Price Changed $154,000 MHCBOR
- 2025-10-20 Listed $165,000 MHCBOR
- 2001-08-01 Sold (Public Records) $37,900 Public Records
- 1997-08-01 Sold (Public Records) $38,000 Public Records
- 1985-11-01 Sold (Public Records) $19,000 Public Records
Property tax history
+1.9%/yrLatest (2025): $369 · -0.1% YoY. Source: county tax records.
Cash-flow waterfall
monthlySold comps — $/sqft
last 12 mo · ≤1 miLoading sold comps…