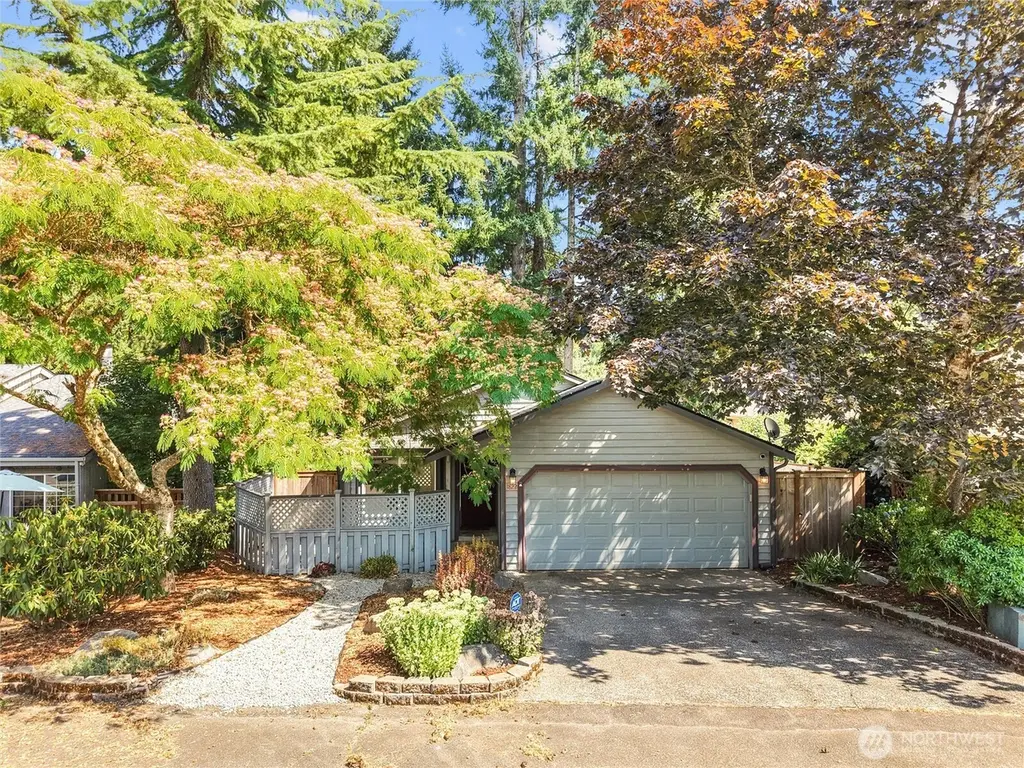
1822 Jonquil Ln NW · Olympia, WA
Flood risk 1/10 · Minimal
- FEMA flood zone
- X (unshaded)
- Chance of flooding over 30 yrs
- 0.0%
- Est. flood insurance / yr
- $473 – $860
Fire risk 1/10 · Minimal
- Est. fire insurance / yr
- $604 – $1,122
Heat risk 3/10 · Minor
- Hot days now (above 88°F)
- 7 days/yr
- Hot days in 30 yrs
- 14 days/yr
Wind risk 1/10 · Minimal
- Chance of severe wind over 30 yrs
- —
Air-quality risk 6/10 · Moderate
- Unhealthy air days now
- 6 days/yr
- Unhealthy air days in 30 yrs
- 7 days/yr
Risk factors via First Street. Map © Google.
Why this score? — see what drove the D grade
The composite is a weighted blend of 9 inputs, each scored 0–100. Each bar is that input's sub-score; the figure is the points it added to the 100-point composite (weight × sub-score).
- ARV discount +12.2/15.0
- Appreciation +10.0/10.0
- Schools +6.2/10.0
- Cash flow +4.2/30.0
- Livability +4.2/5.0
- Rent growth +3.3/5.0
- Condition / age +2.5/5.0
- 1% rule +0.0/10.0
- DSCR +0.0/10.0
$455,000
🖨 Deal sheet (PDF) 📄 Offer letter ✓ Due diligence
Listing remarks
Welcome to your new home on Olympia's desirable Westside! This beautifully updated 3-bedroom, 2-bath residence offers a perfect blend of comfort and style. Step inside to an airy, open layout with vaulted ceilings, oversized windows, and skylights that fill the space with natural light. The spacious living area, complete with a cozy gas fireplace, is perfect for relaxing or entertaining. The primary suite is a true retreat, featuring a large walk-in closet and a private ensuite bath. Recent upgrades include new floors, toilets, and door hardware, plus a fresh coat of paint throughout. Outside, you'll find a serene, low-maintenance yard with a private front patio and a large deck in the full
Key facts
- Picture windows
- Walk-in closet
- Gas fireplace
Tags
Neighborhood map
What this means for you Summary
Snapshot
- This is a 3-bed/2.0-bath single-family listed at $455k.
Deal economics
- At list price, monthly cash flow is $-1k ($-15k/yr) — negative.
- To cash-flow at today's rent, offer at most $236k (48.2% below list).
- To meet the 1% rule (rent ≥ 1% of price), the offer needs to be $219k (51.8% below list).
- Recommended offer: $219k (51.8% below list) — sets the bar for 1% rule.
- Cap rate 3.0% vs local median 2.4% in Olympia — meaningfully above typical; check what's discounted (condition, days-on-market, listing class) to confirm the premium yield is real.
Location & tenants
- Location reads 83/100 on livability (#58 in WA, #1,036 nationally) — a professional / high-income tenant draw. Strengths: amenities A+, commute A+, health & safety A+; Watch: crime F, cost of living D-.
- Olympia School District (urban): math 66% / reading 75% proficiency, ranked #17 of 291 in WA (top 6%) — strong family-tenant draw, lease renewals of 3-5y typical.
- Zoned schools: Leland P Brown Elementary (316 students, 63% FRL); Jefferson Middle School (447 students, 54% FRL); Capital High School (1,326 students, 38% FRL) — zoned schools average 52% FRL vs 25% district-wide (27 pts higher); higher-poverty schools than district average — tighter screening recommended.
- Market conditions: Rents rising (+3.2%/yr); 306 active listings in the ZIP; 16 comparable units currently listed for rent nearby; rentals at typical pace (median 23d on market — plan ~3-4 weeks tenant-placement turnaround); solid renter incomes; 1,222 units permitted in Thurston County in 2024 (508 in 5+ unit buildings).
Forward outlook
- In year one you build about $49k of equity ($3k loan paydown + $46k appreciation (10.0% local appreciation)).
- Thurston County population projected at +27% by 2050 — long-run rental-demand tailwind backs the buy-and-hold thesis.
- By year 2, paydown + projected appreciation supports a ~$78k cash-out refi (75% LTV) — recoverable capital for the next deal without selling this one.
Negotiation context
- It's been on market 264 days — a 12% lower offer ($400k) is reasonable based on typical stale-listing flexibility.
- 5 sale attempts since 9y ago; this cycle's ask has dropped $95k (17%) from the opening price — seller is motivated, your offer sets the floor, not the list.
- Current owner paid $362k; 26% above their basis — modest negotiation headroom, anchor on the comps not their cost.
Questions for the listing agent
- What do current leases actually rent for vs. the listed asking? Can we see a recent rent roll and the last 12 months of T-12 income?
- It's been on market 264 days. Have you received any prior offers? Is the seller open to a 52% concession, seller financing, or rate buy-down credit?
- What does the HOA fee cover, when was the last increase, and are there any pending special assessments or reserve-fund shortfalls?
- Why hasn't it sold? Are there any deal-killer items the seller is aware of (foundation, flood, title, zoning, code violations)?
- Is there a deadline driving the sale (1031 exchange, divorce, estate, relocation)? That informs how much negotiation room exists.
- Schools are A-rated — typically a magnet for longer-tenancy family renters. What's the average tenant stay here, and is there a school-zone premium baked into asking?
- Crime grade is F in this area — have there been break-ins, vandalism, or insurance claims at this property in the last 3 years? What carrier currently insures it and at what premium?
- The area grade is low — what's the realistic commute time and amenity access for the typical tenant pool here? Any planned neighborhood developments (good or bad) we should know about?
- What's the average days-on-market for RENTAL listings here right now (not sales)? A rising rental-DOM trend means longer vacancies and softer asking-rent achievability than the comps imply.
- What's the recent tenant-quality profile in this submarket — average credit score on applications, eviction rate, late-payment / NSF rate, and stable-employment percentage? A property-management company in the area should have these aggregated.
- How much new for-sale + rental construction is in the pipeline within 1–3 miles? Heavy new supply typically softens prices + rents 12–24 months out; constrained supply supports both.
Investment metrics
- 1% rule
- 0.48% ✗
- Cap rate
- 3.02%
- Cash-on-cash
- -11.68%
- DSCR
- 0.48
- GRM
- 17.3
CMA / ARV
- ARV (median comp)
- $508,677
- List price
- $455,000
- Delta
- -10.55%
- Verdict
- UNDERPRICED
- Comps
- 20 within 1.0 mi
Show comp detail 12 sales within ~0.75 mi
| Address | Dist | Beds/Ba | Sqft | Sold | Price | $/sf | Match |
|---|---|---|---|---|---|---|---|
| 1822 Jonquil Ln NW | 0.00mi | 3/2.0 | 1,390 (0%) | 0mo | $454,000 | $327 | 100 |
| 1810 Thornton St NW | 0.06mi | 3/1.5 | 1,342 (-4%) | 8mo | $479,900 | $358 | 83 |
| 2525 17th Ave NW | 0.12mi | 3/2.0 | 1,513 (+9%) | 8mo | $540,000 | $357 | 73 |
| 2534 17th Ave NW | 0.09mi | 3/2.0 | 1,588 (+14%) | 1mo | $510,000 | $321 | 72 |
| 1902 Thornton St NW | 0.05mi | 3/1.5 | 1,202 (-14%) | 2mo | $455,000 | $379 | 71 |
| 2510 17th Ave NW | 0.11mi | 3/1.0 | 1,251 (-10%) | 5mo | $450,000 | $360 | 70 |
| 2202 Sophie Way NE | 0.37mi | 3/2.5 | 1,436 (+3%) | 8mo | $510,000 | $355 | 68 |
| 2506 19th Way NW | 0.10mi | 4/2.0 (+1) | 1,514 (+9%) | 8mo | $535,000 | $353 | 68 |
| 3121 Langridge Ave NW | 0.58mi | 3/2.0 | 1,418 (+2%) | 7mo | $500,000 | $353 | 64 |
| 2201 Sophie Way NW | 0.39mi | 3/2.5 | 1,530 (+10%) | 6mo | $489,000 | $320 | 58 |
| 900 Dundee Rd NW | 0.56mi | 4/1.0 (+1) | 1,360 (-2%) | 7mo | $418,500 | $308 | 55 |
| 1923 26th Ave NW | 0.75mi | 3/1.5 | 1,536 (+10%) | 5mo | $367,000 | $239 | 42 |
Match score weights: distance 35% · size 25% · config 20% · recency 20%. Top-matched comps best support the ARV.
Projected returns pro-forma
10.0% appreciation · 3.16% rent growth · sell at horizon
- IRR
- 16.1%
- Equity multiple
- 2.33×
- Total profit
- $169,097
- Equity at exit
- $409,900
- IRR
- 15.5%
- Equity multiple
- 5.40×
- Total profit
- $560,661
- Equity at exit
- $883,965
Cash invested: $127,400 (down + closing). Projections, not guarantees.
Landlord ↔ Tenant lean methodology
- Overall (STATE)
- 28 Tenant-Leaning
- State Washington
- 28 Tenant-Leaning · D+8
- County
- — inherits STATE
- City
- — inherits STATE
ZIP-level market 98502
- Home prices YoY
- 1.8%
- Rents YoY
- 3.2%
- Active inventory
- 306
- Price-to-rent
- 17.3×
Monthly cashflow live
- Estimated rent
- $2,194 high interval (Pro) →
- Mortgage (P&I)
- −$2,386
- Tax from tax record
- −$383 /mo · $4,598/yr
- Insurance
- −$190
- HOA
- −$15
- Vacancy / Maint / Mgmt
- −$461
- Net cashflow
- $-1,240
Break-even live
Sensitivity live
| Price | -10% $-983 | -5% $-1,111 | +0% $-1,240 | +5% $-1,369 | +10% $-1,498 |
|---|---|---|---|---|---|
| Rent | -10% $-1,414 | -5% $-1,327 | +0% $-1,240 | +5% $-1,154 | +10% $-1,067 |
| Rate | -1.0pp $-1,011 | -0.5pp $-1,124 | base $-1,240 | +0.5pp $-1,358 | +1.0pp $-1,478 |
UW: 25.0% down · 7.5% · 30yr · 1.5% tax · 5.0% vac · 8.0% maint · 8.0% mgmt
Financing live
Cash to close
- Down payment
- $113,750
- Closing costs
- $13,650
- Reserves months
- —
- Total cash needed
- —
Loan-product check · same deal, 3 products live
Conventional
25% down · 7.5% · 30yr
- Down + closing
- —
- Monthly P&I
- —
- Monthly cashflow
- —
- DSCR
- —
- Eligible?
- —
Personal DTI + credit; lowest rate.
DSCR
20% down · 8.5% · 30yr
- Down + closing
- —
- Monthly P&I
- —
- Monthly cashflow
- —
- DSCR
- —
- Eligible?
- —
No personal income docs; deal must DSCR.
Hard money
10% down · 12.0% · 12mo
- Down + closing
- —
- Monthly P&I
- —
- Monthly cashflow
- —
- DSCR
- —
- Eligible?
- —
Short-term bridge; refi at stabilization.
Rent comps 16 comps
| Address | Beds | Baths | Sqft | Rent | $/sqft | DOM | Units | Dist |
|---|---|---|---|---|---|---|---|---|
| 1829 E End St NW Unit B Olympia, WA | 2.0 | 1.0 | 1100 | $2,100 | $1.91 | 45d | 1 | 0.14mi |
| 2006 Burbank Ave NW Unit NA Olympia, WA | 4.0 | 3.0 | 1750 | $2,650 | $1.51 | 45d | 1 | 0.48mi |
| 2137 Conger Ave NW Unit A Olympia, WA | 3.0 | 2.0 | 1248 | $1,995 | $1.60 | 45d | 1 | 0.72mi |
| 2137 Conger Ave NW Unit C Olympia, WA | 3.0 | 2.0 | 1248 | $1,895 | $1.52 | 45d | 1 | 0.72mi |
| 2016 Porta Ct NW Olympia, WA | 2.0 | 1.5 | 1200 | $1,995 | $1.66 | 15d | 1 | 0.77mi |
| 2028 Porta Ct NW Olympia, WA | 2.0 | 1.5 | 950 | $1,995 | $2.10 | 23d | 1 | 0.78mi |
| 2040 Aqua Ct NW Olympia, WA | 2.0 | 1.0 | 975 | $2,150 | $2.21 | 15d | 1 | 0.86mi |
| 2800 Limited Ln NW Olympia, WA | 1.0–2.0 | 1.0–2.0 | 775 | $1,503 | $1.94 | 15d | 4 | 0.89mi |
| 300 Kenyon St NW Olympia, WA | 1.0–2.0 | 1.0–2.0 | 878 | $1,995 | $2.27 | 15d | 6 | 0.92mi |
| 1626 Madison Ave NW Olympia, WA | 2.0 | 2.0 | 1064 | $2,100 | $1.97 | 15d | 1 | 0.95mi |
| 1901 Hudson St NW Olympia, WA | 3.0 | 2.5 | 1705 | $2,700 | $1.58 | 15d | 1 | 1.10mi |
| 125 Decatur St NW Olympia, WA | 2.0 | 1.0 | 980 | $1,900 | $1.94 | 23d | 1 | 1.22mi |
| 121 Decatur St NW Olympia, WA | 2.0 | 1.0 | 1000 | $1,695 | $1.70 | 23d | 1 | 1.22mi |
| 600 Black Lake Blvd SW Olympia, WA | 1.0–2.0 | 1.0 | 851 | $1,600 | $1.88 | 15d | 23 | 1.27mi |
| 2010 8th Ct SW Olympia, WA | 2.0 | 2.0 | 1072 | $2,295 | $2.14 | 23d | 1 | 1.46mi |
| 3311 6th Ave SW Olympia, WA | 1.0–3.0 | 1.0–2.0 | 888 | $2,470 | $2.78 | 15d | 16 | 1.50mi |
HOA detail
- Monthly dues
- $15 · $180/yr
- Likely covers
- gas
Listing history 26 events
-
2026-05-14status Pending
-
2026-04-30price $455,000
-
2026-04-14price $474,000
-
2026-04-11status Active
-
2026-04-08status Pending
-
2026-03-21price $479,000
-
2026-03-11status Active
-
2026-03-04status Pending
-
2026-02-21price $489,000
-
2025-11-05price $499,000
-
2025-09-22price $519,000
-
2025-08-21price $539,000
-
2025-08-13$550,000 Active
-
2020-10-14soldstatus $362,000 Sold
-
2020-10-14soldstatus $362,000
-
2020-09-18status Pending
-
2020-09-08status Pending Inspection
-
2020-09-02$349,950 Active
-
2017-09-26historical
-
2017-09-25soldstatus $263,000 Sold
-
2017-09-25soldstatus $263,000
-
2017-07-14status Pending Inspection
-
2017-07-05$259,000 Active
-
1997-10-16soldstatus $127,500
-
1990-02-16soldstatus $79,500
-
1986-09-04soldstatus $67,900
ⓘ Source: listings_history table (triggers on properties + properties_extension) + one-shot
backfill from property_details.listing_events for pre-trigger history.
Tax reassessment forecast WA · Resets to sale price
- Current annual tax
- $4,598 · $383/mo
- Projected year-2 tax
- $4,598 · $383/mo
- Expected delta
- $0/yr ($0/mo · 0.0%)
ⓘ Screening estimate from a state-policy table — verify with the county assessor before closing.
Climate risk First Street
- Flood 1/10 Low FEMA zone X (unshaded) · 0% chance over 30 yrs
- Wildfire 1/10 Low
- Heat 3/10 Moderate 7 d/yr ≥88°F today · 14 d/yr by 30 yrs out
- Wind 1/10 Low
- Air quality 6/10 Major 6 unhealthy d/yr today · 7 by 30 yrs out
Nearby sold comps map
Loading sold comps map…
Walkable amenities ~0.75 mi
Loading nearby amenities…
Taxation est. · year 1
- Rental income
- $26,333
- − Mortgage interest
- −$25,487
- − Property taxes
- −$4,598
- − Insurance
- −$2,275
- − Repairs & maintenance
- −$2,107
- − Management
- −$2,107
- − HOA
- −$180
- − Depreciation
- −$13,236
- Taxable loss
- −$23,656
- Est. tax savings @ 24.0%
- +$5,678
- After-tax cash flow
- $-9,205/yr
For passive investors: Depreciation is non-cash, so a rental often shows a tax loss while cash-flowing — sheltering income. Rental losses are passive: they offset passive income freely, and up to $25,000/yr can offset ordinary (W-2) income if you actively participate and your MAGI is under $100k (phasing out to $0 by $150k); unused losses carry forward. On sale, claimed depreciation is recaptured at up to 25%, and gains may owe capital-gains tax (a 1031 exchange can defer both). Figures are a year-1 estimate at your 24.0% rate — not tax advice; consult a CPA.
Schools (NCES district)
- District
- Olympia School District
- NCES district ID
- 5306180
- Math proficiency
- 66% ▼ -2.00%
- Reading proficiency
- 75% ▼ -2.00%
- Median HH income
- $63,852
- Composite
- 62.27/100
- National rank
- #1438
- State rank
- #17 of 291 in WA
Livability — Olympia
- Score
- 83/100
- State rank
- #58
- US rank
- #1036
Category grades
Schools grade is shown separately in the Schools card above.
Census & demographics
- Census place
- Olympia, WA
- County
- Thurston County · 269,345 people
- City population
- 98,428
- Metro
- Olympia-Lacey-Tumwater, WA
- Population (ZIP)
- 35,398
- Household income
- $92,207
- Rent vs Own
- Severe rent burden
- 1811.0
Population outlook (Thurston County) Hauer SSP2
- Today (2025)
- 308,239 people
- By 2030
- 326,483 · +5.9%
- By 2040
- 359,890 · +16.8%
- By 2050
- 391,800 · +27.1%
- By 2075
- 468,024 · +51.8%
- By 2100
- 519,890 · +68.7%
Race, ethnicity, and origin ACS 2023
- Neighborhood character
- Predominantly White (71%)
- Race & ethnicity
- White 71% Two or more races 13% Hispanic / Latino 11% Asian 6% Black 3% Native American 1%
- Hispanic origin (detail)
- Mexican 3% Puerto Rican 4%
- Common ancestry
- Italian 5% Portuguese 4% Iranian 3%
- Foreign-born
- 8% · Vietnam, Canada, China
- Languages at home
- 90% English-only · Spanish 3% Vietnamese 2% Other Asian/Pacific 1%
Political lean MEDSL · Thurston
- 2024 margin
- Strong D (+20.4) · D 58.5% · R 38.1% · Other 3.5%
- 2008→2024 swing
- -1.3pp toward R · 2008: 21.7pp · 2024: 20.4pp
- All cycles
- 2024: D+20.4 2020: D+18.6 2016: D+15.4 2012: D+19.0 2008: D+21.7
Not yet ingested
- Civics
- —
Market trends
- HPI YoY
- ▲ 18.49%
- Current HPI
- 1056.49
- Rent YoY
- ▲ 3.16%
- Metro
- Olympia-Lacey-Tumwater, WA
- State GDP YoY
- ▲ 4.65%
- F500 in state
- 22
Industry mix (Fortune 500 HQ in WA)
| Industry | F500 HQs | Revenue |
|---|---|---|
| Retail | 2 | $269B |
|
||
| Technology / Retail | 1 | $638B |
|
||
| Technology | 1 | $245B |
|
||
| Telecommunications | 1 | $38B |
|
||
| Food / Beverage | 1 | $36B |
|
||
| Automotive / Trucks | 1 | $34B |
|
||
Price history
+570.1% since first listed26 events — show timeline
- 2026-05-14 Pending — NWMLS as Distributed by MLS Grid
- 2026-04-30 Price Changed $455,000 NWMLS as Distributed by MLS Grid
- 2026-04-14 Price Changed $474,000 NWMLS as Distributed by MLS Grid
- 2026-04-11 Relisted — NWMLS as Distributed by MLS Grid
- 2026-04-08 Pending — NWMLS as Distributed by MLS Grid
- 2026-03-21 Price Changed $479,000 NWMLS as Distributed by MLS Grid
- 2026-03-11 Relisted — NWMLS as Distributed by MLS Grid
- 2026-03-04 Pending — NWMLS as Distributed by MLS Grid
- 2026-02-21 Price Changed $489,000 NWMLS as Distributed by MLS Grid
- 2025-11-05 Price Changed $499,000 NWMLS as Distributed by MLS Grid
- 2025-09-22 Price Changed $519,000 NWMLS as Distributed by MLS Grid
- 2025-08-21 Price Changed $539,000 NWMLS as Distributed by MLS Grid
- 2025-08-13 Listed $550,000 NWMLS as Distributed by MLS Grid
- 2020-10-14 Sold (Public Records) $362,000 Public Records
- 2020-10-14 Sold (MLS) $362,000 NWMLS as Distributed by MLS Grid
- 2020-09-18 Pending — NWMLS as Distributed by MLS Grid
- 2020-09-08 Pending — NWMLS as Distributed by MLS Grid
- 2020-09-02 Listed $349,950 NWMLS as Distributed by MLS Grid
- 2017-09-26 Delisted — NWMLS as Distributed by MLS Grid
- 2017-09-25 Sold (Public Records) $263,000 Public Records
- 2017-09-25 Sold (MLS) $263,000 NWMLS as Distributed by MLS Grid
- 2017-07-14 Pending — NWMLS as Distributed by MLS Grid
- 2017-07-05 Listed $259,000 NWMLS as Distributed by MLS Grid
- 1997-10-16 Sold (Public Records) $127,500 Public Records
- 1990-02-16 Sold (Public Records) $79,500 Public Records
- 1986-09-04 Sold (Public Records) $67,900 Public Records
Property tax history
+4.5%/yrLatest (2026): $4,598 · -0.1% YoY. Source: county tax records.
Cash-flow waterfall
monthlySold comps — $/sqft
last 12 mo · ≤1 miLoading sold comps…